Risk factors for 30-day readmissions after
acute myocardial infarction retrospective
cohort study in Dallas Texas, USA
Benjamin Cruz Rodriguez
1, Priyanka Acharya
2, Edwin Olson
3, Leslie Cler
11. Internal Medicine, Methodist Dallas Medical Center, Dallas 2. Clinical Research Institute, Methodist Health System, Dallas 3. Interventional Cardiology, Methodist Dallas Medical Center, Dallas
Introduction / Background
The hospital readmission rate has been thought to reflect the quality of patient care including patient assessment, education, medication compliance and post-discharge
follow-up.1 Currently, the United States has the highest rate of acute
myocardial infarction (AMI) readmissions compared to Canada,
Australia and many European nations2.
Patient characteristics that are thought to influence an increase in readmission rate include female gender, living alone, advanced age, advanced stage of disease, greater length of stay during the initial hospitalization, more frequent emergency
department utilization, and the acuteness of the illness3,4,5.
Comorbidities appear to play a central and increasing role in
readmissions. Longer length of stay, and complications of angiography and revascularization or reperfusion are associated with increased 30-day rehospitalization risk after AMI. Many rehospitalizations seem to be unrelated to the incident
AMI.6 In contrast, other studies have not found difference in
comorbidity-adjusted hazard ratios by patient age, sex, or
race to a clinically significant degree7,8. Analysis of young and
middle-aged adults found similar readmission rates for elderly patients (older than 65 year old), classically included in previous
studies.9
Systematic review of the literature has revealed remarkably few studies that provide information about predictors of readmission after AMI or allow for the stratification of risk at the patient
ISSN: 2410-2636 © Barcaray Publishing * Corresponding author. E-mail: [email protected]
Abstract
Background
The hospital readmission rate has been thought to reflect the quality of patient care. Understanding the risk factors for these can guide strategies to reduce them.
Methods
Retrospective cohort design that included all the admissions for AMI from October 2011 to September 2014. Primary outcome was 30-day readmission rate. Secondary outcomes were 7-day readmission rate, reasons for readmission and cardiac-related readmission rate. Univariate and multivariate logistic regression were conducted with Hosmer-Lemeshow goodness-of-fit statistics for model calibration and ROC curve for model discrimination.
Results
We identified 2958 cases of AMI and 334 readmissions (11.3%). The final sample for analysis included 310 readmitted and 652 non-readmitted patients. The principal causes of readmission were cardiac related (42%), followed by respiratory (15%) and gastrointestinal (11%). Separate analysis for the early readmissions showed the same pattern. 42% of the readmissions happened during the first week and 68% in the first 2 weeks after discharge. Median time for readmission was 10 days. Older age, days from admission to catheterization, complete medical therapy at discharge, diabetes, hypertension, stroke, major psychiatric disorders, insurance status, chronic kidney disease and congestive heart failure were independently associated with 30-day readmission. The final multivariate model discriminated well with a ROC of 0.753 (95% CI 0.72-0.79).
Conclusion
Reasons for readmission found in our study were consistent with previous studies. Absolute readmission rates reported in this study were lower than in some prior publications. We present novel and addressable patient risk factors derived from the index admission that can be used to predict readmission.
Acronyms: ACEI: angiotensin converting enzyme inhibitor. ARB: Angiotensin receptor blocker. AMI: acute myocardial
infarction. CABG: coronary artery bypass grafting. CAD: coronary artery disease. CHF: Congestive heart failure.
COPD: chronic obstructive pulmonary disease. DM: Diabetes mellitus. EF: ejection fraction. ESRD: End
stage renal disease. HTN: Hypertension. MHS: Methodist Health System. NSTEMI: Non-ST segment elevation
myocardial infarction. PNA: pneumonia. PCI: percutaneous coronary intervention. SNF: skill nursing facility.
STEMI: ST segment elevation myocardial infarction.
Key words: acute myocardial infarction; 30-day readmission; hospital readmission; predictive model
level or profiling of performance at
the hospital level.10 Furthermore, it
has been found that readmissions are rather heterogeneous in nature and that many readmissions are unrelated to the index stay and thus not easily predicted with common
clinical variables.11
Implementing interventions to reduce readmission after AMI will require an understanding of the patient characteristics associated with readmission, as knowledge of relevant patient characteristics within one community will help physicians stratify AMI patients according to risk of readmission and assist with
developing discharge plans.12
With the present study, we aimed to determine the risk factors for readmission of the AMI survivors diagnosed in the four facilities of Methodist Health System (MHS) in the Dallas metropolitan area in order to facilitate interventions to reduce the readmission rate. MHS comprises of four community-based hospitals (including one inner-city teaching hospital and referral center) in north Texas, USA. Secondary objectives were to identify the reason for readmission, the risk factors for early readmission (within 1 week) as well as for cardiac-related readmission (those cardiac-related to re-infarction, congestive heart failure [CHF] or medication side effects).
Methodology
Study design
Using a retrospective cohort design, we identified all the admissions for AMI (Non-ST segment elevation AMI - NSTEMI, and ST segment
elevation AMI - STEMI)13 within the
four facilities of MHS from October 2011 to September 2014. We used the Crimson Database (performance improvement software) to identify the cases, and then performed a manual review of the electronic medical records. We compared patients who were and were not re-hospitalized to determine the risk factors for readmission. We included 100% of the readmitted patients, and for the non-readmitted patients, we randomly selected a third of the patients. This was based on a sample calculation using the
computer program G-power 3.114 to
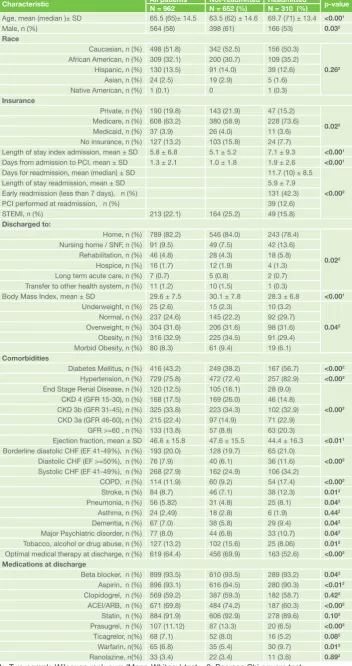
detect a small effect (Cohen’s d = 0.2) with 80% power and allocation ratio 1:2 for readmitted vs. non-Table 1: Patient demographics and characteristics
Characteristic All patientsN = 962 Not-readmitted ReadmittedN = 652 (%) N = 310 (%) p-value Age, mean (median )± SD 65.5 (65)± 14.5 63.5 (62) ± 14.6 69.7 (71) ± 13.4 <0.001
Male, n (%) 564 (58) 398 (61) 166 (53) 0.032
Race
Caucasian, n (%) 498 (51.8) 342 (52.5) 156 (50.3)
0.263
African American, n (%) 309 (32.1) 200 (30.7) 109 (35.2) Hispanic, n (%) 130 (13.5) 91 (14.0) 39 (12.6)
Asian, n (%) 24 (2.5) 19 (2.9) 5 (1.6) Native American, n (%) 1 (0.1) 0 1 (0.3)
Insurance
Private, n (%) 190 (19.8) 143 (21.9) 47 (15.2)
0.022
Medicare, n (%) 608 (63.2) 380 (58.9) 228 (73.6) Medicaid, n (%) 37 (3.9) 26 (4.0) 11 (3.6) No insurance, n (%) 127 (13.2) 103 (15.8) 24 (7.7)
Length of stay index admission, mean ± SD 5.8 ± 6.8 5.1 ± 5.2 7.1 ± 9.3 <0.001
Days from admission to PCI, mean ± SD 1.3 ± 2.1 1.0 ± 1.8 1.9 ± 2.6 <0.001
Days for readmission, mean (median) ± SD 11.7 (10) ± 8.5
<0.002
Length of stay readmission, mean ± SD 5.9 ± 7.9
Early readmission (less than 7 days), n (%) 131 (42.3)
PCI performed at readmission, n (%) 39 (12.6)
STEMI, n (%) 213 (22.1) 164 (25.2) 49 (15.8)
Discharged to:
Home, n (%) 789 (82.2) 546 (84.0) 243 (78.4)
0.022
Nursing home / SNF, n (%) 91 (9.5) 49 (7.5) 42 (13.6) Rehabilitation, n (%) 46 (4.8) 28 (4.3) 18 (5.8)
Hospice, n (%) 16 (1.7) 12 (1.9) 4 (1.3) Long term acute care, n (%) 7 (0.7) 5 (0.8) 2 (0.7) Transfer to other health system, n (%) 11 (1.2) 10 (1.5) 1 (0.3)
Body Mass Index, mean ± SD 29.6 ± 7.5 30.1 ± 7.8 28.3 ± 6.8 <0.001
Underweight, n (%) 25 (2.6) 15 (2.3) 10 (3.2)
0.042
Normal, n (%) 237 (24.6) 145 (22.2) 92 (29.7) Overweight, n (%) 304 (31.6) 206 (31.6) 98 (31.6) Obesity, n (%) 316 (32.9) 225 (34.5) 91 (29.4) Morbid Obesity, n (%) 80 (8.3) 61 (9.4) 19 (6.1)
Comorbidities
Diabetes Mellitus, n (%) 416 (43.2) 249 (38.2) 167 (56.7) <0.002
Hypertension, n (%) 729 (75.8) 472 (72.4) 257 (82.9) <0.002
End Stage Renal Disease, n (%) 120 (12.5) 105 (16.1) 28 (9.0)
<0.002
CKD 4 (GFR 15-30), n (%) 168 (17.5) 169 (26.0) 46 (14.8) CKD 3b (GFR 31-45), n (%) 325 (33.8) 223 (34.3) 102 (32.9) CKD 3a (GFR 46-60), n (%) 215 (22.4) 97 (14.9) 71 (22.9)
GFR >=60 , n (%) 133 (13.8) 57 (8.8) 63 (20.3)
Ejection fraction, mean ± SD 46.6 ± 15.8 47.6 ± 15.5 44.4 ± 16.3 <0.011
Borderline diastolic CHF (EF 41-49%), n (%) 193 (20.0) 128 (19.7) 65 (21.0)
<0.002
Diastolic CHF (EF >=50%), n (%) 76 (7.9) 40 (6.1) 36 (11.6) Systolic CHF (EF 41-49%), n (%) 268 (27.9) 162 (24.9) 106 (34.2)
COPD, n (%) 114 (11.9) 60 (9.2) 54 (17.4) <0.002
Stroke, n (%) 84 (8.7) 46 (7.1) 38 (12.3) 0.012
Pneumonia, n (%) 56 (5.82) 31 (4.8) 25 (8.1) 0.042
Asthma, n (%) 24 (2.49) 18 (2.8) 6 (1.9) 0.442
Dementia, n (%) 67 (7.0) 38 (5.8) 29 (9.4) 0.042
Major Psychiatric disorder, n (%) 77 (8.0) 44 (6.8) 33 (10.7) 0.042
Tobacco, alcohol or drug abuse, n (%) 127 (13.2) 102 (15.6) 25 (8.06) 0.012
Optimal medical therapy at discharge, n (%) 619 (64.4) 456 (69.9) 163 (52.6) <0.002
Medications at discharge
Beta blocker, n (%) 899 (93.5) 610 (93.5) 289 (93.2) 0.042
Aspirin, n (%) 896 (93.1) 616 (94.5) 280 (90.3) <0.012
Clopidogrel, n (%) 569 (59.2) 387 (59.3) 182 (58.7) 0.422
ACEI/ARB, n (%) 671 (69.8) 484 (74.2) 187 (60.3) <0.002
Statin, n (%) 884 (91.9) 606 (92.9) 278 (89.6) 0.102
Prasugrel, n (%) 107 (11.12) 87 (13.3) 20 (6.5) <0.002
Ticagrelor, n(%) 68 (7.1) 52 (8.0) 16 (5.2) 0.082
Warfarin, n(%) 65 (6.8) 35 (5.4) 30 (9.7) 0.012
Ranolazine, n(%) 33 (3.4) 22 (3.4) 11 (3.6) 0.892 1: Two-sample Wilcoxon rank-sum (Mann-Whitney) test 2: Pearson Chi-square test
readmitted patients using t-test between means with γ at 0.05. Data was collected and analyzed from December 2014 to May 2015. The study was approved by Aspire IRB and the Internal Medicine Department of Methodist Dallas Medical Center. Informed consent was waived due to the retrospective nature of the study.
Inclusion and Exclusion Criteria
Inclusion criteria were patients of any age, sex and race with diagnosis of NSTEMI or STEMI; we also identified those with 30-day readmissions for any diagnosis. For patients with more than one readmission after the index admission, only the first one was considered for analysis. Reasons for exclusion were in-hospital death, transfer to another facility and discharge against medical advice. Patients with planned readmissions for elective procedures were also excluded, with the exception of planned coronary artery bypass grafting (CABG), as this is specifically stated as a penalty for AMI readmissions in the
Hospital Readmission Reduction Program.15 Figure 1 describes
the study population.
Outcome measures
Demographic data, clinical parameters, comorbidities, medications at discharge, information about the index hospitalization and readmission were collected from the electronic medical records. The principal reason for readmission was extracted from the discharge summary of the readmission. The readmission rate was calculated as patients who were readmitted 30 days after discharge for AMI divided by the total of people with AMI in the MHS.
CHF and ejection fraction (EF) were classified according to the 2013 American Heart Association Guidelines for CHF. The glomerular filtration rate (GFR) was calculated with the Modification of Diet in Renal
Disease equation17. Optimal
medical therapy was considered if the patient was discharged on dual antiplatelet therapy, statin, angiotensin-converting enzyme inhibitor / angiotensin receptor blocker (ACEI/ARB) and beta blocker.
Early readmission was defined as admission within 7 days of discharge. Cardiac related readmission was defined as any coronary artery event (NSTEMI, STEMI, stent thrombosis, angina), CHF, arrhythmias or side effect due to medications related to coronary disease.
Statistical Analysis
Descriptive analyses were performed for all continuous variables. Mean ± standard deviation (SD) is presented for normally distributed variables and median ± SD is presented for non-normal variables. Normally distributed continuous variables were analyzed with Student’s t-test and
non-normally distributed continuous variables were analyzed with nonparametric Wilcoxon-Mann-Whitney test. Categorical variables were analyzed using chi-square test or Fisher’s exact test for smaller samples.
Patient demographics, comorbidities, medication, insurance, in-hospital outcomes, and discharge location were evaluated for inclusion in the prediction model using chi-square and Student t-test comparisons and univariate logistic regression. Except for age and days to catheterization, all independent variables considered in the analysis were specified in categorical form. Each level of a categorical variable was considered to be a unique risk factor. Both forward and backward step logistic
Figure 2: Percentage of Patients Readmitted During Consecutive Periods Following Hospitalization for Acute Myocardial Infarction.
1= quetiapine overdose (0.3%), psychosis (0.6%) 2= cholecystitis (1.3%), acute urinary retention (0.3%) 3= acute retroperitoneal bleeding (0.3%), access site hematoma (0.3%), epistaxis (0.3%), subdural hematoma (0.6%), subarachnoid hemorrhage (0.3%). 4= hypoglycemia (0.6%), hyponatremia (0.9%), volume depletion (0.6%), symptomatic anemia (0.6%), metastatic cancer complications (0.6%). 5= Headache (0.3%), syncope (1.3%), seizures (0.6%), stroke (3.6%) 6 = AKI (1.9%), ESRD volume overload (3.6%), chest pain or hypotension during dialysis (1.9%). 7 = UTI (1.4%), sepsis (2.6%), cellulitis (3.6%), meningoencephalitis (0.3%), neutropenia (0.3%). 8 = GI bleeding (3.8%), diarrhea (5.1%), biliary colic (1.5%), eosinophilic esophagitis (0.6%), constipation (0.6%). 9 = COPD exacerbation (4.4%), pneumonia (4.9%), PE/DVT (3.4%), pulmonary fibrosis (0.7%), pleural effusion (2.4%). 10 = CHF exacerbation (14.5%), NSTEMI (9.35%), STEMI (2.3%), angina (3.5%), unstable angina (3.2%), arrhythmias (4.8%), Prinzmetal angina (0.3%), pericarditis (0.3%), hypertensive urgency (1.2%), medication side effects (1.2%), atypical chest pain (2.2%).
Figure 1: Study population
regression were conducted using only factors with univariate associations with the composite end point of readmission within 30 days, to determine factors to be included in the multivariable model using an γ of 0.10. The same process was repeated twice for the endpoints of early readmission (within 7 days) and cardiac-related readmission within 30 days. Factors remaining in the multivariate models were evaluated and only factors with an γ of <0.10 were included in the final prediction model. First-order interaction terms were evaluated for the variables in final model. The methods by Lemeshow and Hosmer were
used for assessing the model calibration.18 The area under the
receiver operating characteristic (ROC) curve C-statistic (ROC area) was estimated to assess the discriminating ability of the
final multivariate logistic regression model.19 Analyses were
performed using STATA version 13.0 (StataCorp LP, College Station, TX).
Results
We identified 2958 cases of AMI and 334 were readmitted (11.3%). As described in Figure 1, the final sample for analysis included 310 readmitted and 652 non-readmitted patients. The principal causes of readmission were cardiac related (42%), followed by respiratory (15%) and gastrointestinal (11%) as presented in Figure 2. Separate analyses for the early 7- and 15-day readmissions showed the same pattern with only slight changes in renal and infectious causes (fourth and fifth most common causes of readmission).
Table 1 describes the patient demographics, comorbidities, admission characteristics and discharge medications. The difference between readmitted and non-readmitted patients is evaluated with the statistical test described in the footnote. Readmitted patients were more likely to be older, female, have Medicare as insurance, longer length of stay and to have been discharged to a skilled nursing facility (SNF). Furthermore, we found that readmitted patients were more likely to have had an NSTEMI, lower EF, cardiac catheterization performed later than non-readmitted patients and suboptimal medical therapy at discharge. Specifically, patients were less likely to have had aspirin, ACEI/ARB, and a second antiplatelet (clopidogrel, prasugrel or ticagrelor). Comorbidities significantly associated with readmission were diabetes mellitus (DM), hypertension (HTN), chronic kidney disease (CKD), pneumonia (PNA), chronic obstructive pulmonary disease (COPD), stroke, dementia, tobacco, alcohol or drug abuse and major psychiatric disorder.
As described in Figure 3, 42% of the readmissions (131) happened during the first week, and 68% occur in the first 2 weeks after discharge. The median time for readmission was 10 days (mean 11.7, SD 8.5 days).
Figure 3: 30-day Readmission by Day (0-30) after Acute Myocardial Infarction
The columns represent absolute number of readmissions per day after index discharge.
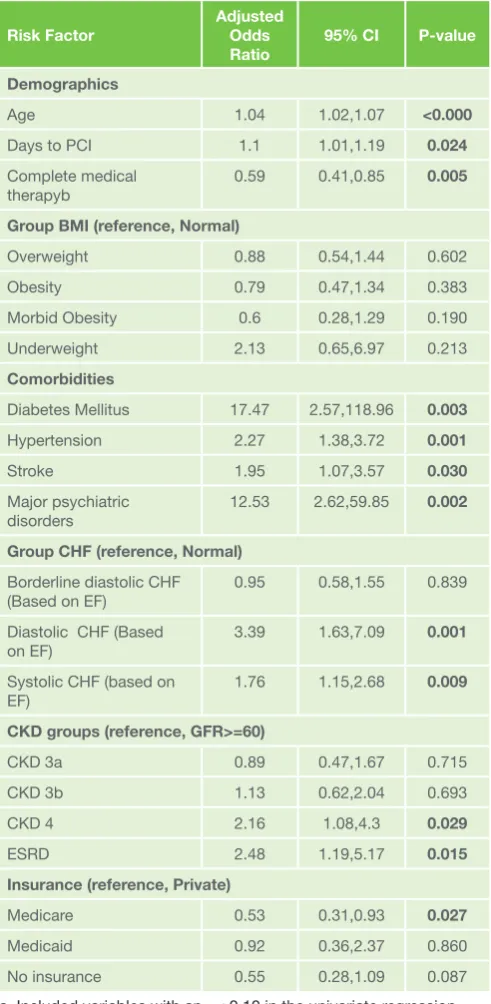
Risk factors associated with 30-day emergent readmission, which were included in the multivariate model are described in Table 2. Gender, length of stay, type of infarction, discharge destination facility, comorbidities such as COPD, PNA, dementia, drug/alcohol abuse were not significantly associated with the readmission risk. Factors such as age, days to catheterization, complete medical therapy, comorbidities such as DM, HTN, stroke and major psychiatric disorders; insurance; Table 2: Multivariate Logistic Regression Model for 30-day
readmission
Risk Factor Adjusted Odds Ratio
95% CI P-value
Demographics
Age 1.04 1.02,1.07 <0.000
Days to PCI 1.1 1.01,1.19 0.024
Complete medical therapyb
0.59 0.41,0.85 0.005
Group BMI (reference, Normal)
Overweight 0.88 0.54,1.44 0.602
Obesity 0.79 0.47,1.34 0.383
Morbid Obesity 0.6 0.28,1.29 0.190
Underweight 2.13 0.65,6.97 0.213
Comorbidities
Diabetes Mellitus 17.47 2.57,118.96 0.003
Hypertension 2.27 1.38,3.72 0.001
Stroke 1.95 1.07,3.57 0.030
Major psychiatric disorders
12.53 2.62,59.85 0.002
Group CHF (reference, Normal) Borderline diastolic CHF
(Based on EF) 0.95 0.58,1.55 0.839
Diastolic CHF (Based
on EF) 3.39 1.63,7.09 0.001
Systolic CHF (based on EF)
1.76 1.15,2.68 0.009
CKD groups (reference, GFR>=60)
CKD 3a 0.89 0.47,1.67 0.715
CKD 3b 1.13 0.62,2.04 0.693
CKD 4 2.16 1.08,4.3 0.029
ESRD 2.48 1.19,5.17 0.015
Insurance (reference, Private)
Medicare 0.53 0.31,0.93 0.027
Medicaid 0.92 0.36,2.37 0.860
No insurance 0.55 0.28,1.09 0.087
a. Included variables with an γ < 0.10 in the univariate regression model
b. Represents the use of dual antiplatelet therapy, statin, beta blocker, ACEI/ARB
CKD and CHF were independently associated with 30-day emergent readmission. In addition, the following interaction terms were included among the candidate variable for the final model: age and DM; DM and major psychiatric disorders; and HTN and major psychiatric disorders.
The final multivariate model discriminated well with a ROC
of 0.753 and 95% CI: 0.72-0.79. The Hosmer-Lemeshow γ2
was 730 with a p value of 0.56 > 0.05 indicating a significant
goodness-of-fit18.
We performed secondary analysis with the readmitted patients to identify risk factors associated with cardiac related readmission and early readmissions, within the first week after discharge. These analyses were performed only with the subset of readmitted patients.
As described in Table 3, being discharged to a nursing home or SNF and having Medicare as insurance was significantly associated with decreased odds of being readmitted for a
cardiac-related reason. On the other hand, being readmitted during the first week, having a major psychiatric disorder and patients with systolic CHF had significantly higher odds of being readmitted for a cardiac-related reason. The ROC of this analysis was 0.74, 95% CI: 0.69-0.80. The Hosmer-Lemeshow γ2 was 9.35 with a p-value of 0.31 > 0.05 indicating a significant goodness-of-fit.
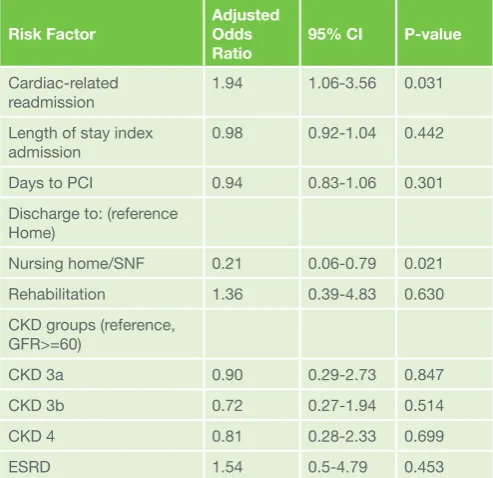
Table 4 describes the analysis of the early readmission. Consistent with the cardiac-related readmission, been discharged to a nursing home or SNF was significantly
associated with decreased odds of having an early readmission and have a cardiac-related readmission significantly increased the odds of early readmission. The ROC of this analysis was 0.66, 95% CI: 0.59-0.74. The Hosmer-Lemeshow γ2 was 9.07 with a p-value of 0.34 > 0.05 indicating a significant goodness-of-fit. No interaction terms were found in both cardiac and early readmission analysis.
Discussion
Findings
We have reviewed the risk factors and developed a
comprehensive model for estimating risk of 30-day readmission after AMI based on the MHS in Dallas Metropolitan Area.
Systematic reviews have shown that identification of consistent and reliable predictors of readmission requires appropriately local analysis to implement risk-based interventions to reduce readmission after AMI. Although variable selection may in part be informed by the literature, empirical development and validation analyses using appropriate local data sets and rigorous hierarchical statistical methods are needed, because patient-level predictors of readmission (social and behavioral variables, comorbidities) are likely to account for variation Table 4: Multivariate Logistic Regression Model for Early Readmissiona,b
Risk Factor Adjusted Odds
Ratio 95% CI P-value
Cardiac-related
readmission 1.94 1.06-3.56 0.031
Length of stay index admission
0.98 0.92-1.04 0.442
Days to PCI 0.94 0.83-1.06 0.301
Discharge to: (reference Home)
Nursing home/SNF 0.21 0.06-0.79 0.021
Rehabilitation 1.36 0.39-4.83 0.630
CKD groups (reference, GFR>=60)
CKD 3a 0.90 0.29-2.73 0.847
CKD 3b 0.72 0.27-1.94 0.514
CKD 4 0.81 0.28-2.33 0.699
ESRD 1.54 0.5-4.79 0.453
a. Included variables with an γ < 0.10 in the univariate regression model
b. Represents hospital readmissions in the first 7 days.
CKD: chronic kidney disease. ESRD: end stage renal disease. SNF: skilled nursing facility. PCI: percutaneous coronary intervention.
Table 3: Multivariate Logistic Regression Model for Readmission Related to Cardiac Causesa
Risk Factor Adjusted Odds
Ratio 95% CI P-value Discharged to Nursing
home/SNF (reference Home)
0.35 0.15-0.85 0.020
NSTEMI (vs STEMI) 1.72 0.82-3.63 0.155
Early readmissionb 1.93 1.13-3.31 0.016
Insurance (reference, No insurance)
Private 0.95 0.32-2.89 0.935
Medicare 0.32 0.12-0.88 0.027
Medicaid 0.68 0.13-3.51 0.649
Major psychiatric
disorders 3.28 1.3-8.31 0.012
Group CHF (reference, Normal)
Borderline diastolic CHF 1.56 0.76-3.2 0.227
Diastolic CHF 2.12 0.86-5.25 0.103
Systolic CHF 2.94 1.5-5.76 0.002
CKD groups (reference, GFR>=60)
CKD 3a 2.04 0.66-6.32 0.218
CKD 3b 2.67 0.94-7.57 0.064
CKD 4 2.30 0.78-6.76 0.130
ESRD 0.79 0.26-2.41 0.677
Group BMI (reference, Normal)
Overweight 1.13 0.57-2.27 0.726
Obesity 0.72 0.35-1.48 0.372
Morbid Obesity 1.31 0.38-4.6 0.669
Underweight 0.17 0.03-1.01 0.052
a. Included variables with an γ < 0.10 in the univariate regression model
even after developing validated risk-standardized statistical
models.10 These variables are frequently not documented in
the electronic medical records.20 With the present study, we
aimed to determine the local factors for readmission in order to implement directed interventions to reduce them.
The reasons for readmission found in our study were
consistent with previous studies.7,21 In our sample, 43% of the
readmissions were cardiac related, 14% due to acute CHF, 11% due to reinfarction (most of them NSTEMI) and almost 5% arrhythmia-related. Pulmonary, gastrointestinal, infectious and renal causes account for another significant amount of the readmissions, emphasizing that comprehensive strategies of care in patients with AMI need to be deployed to incorporate timely treatment of both cardiovascular and non-cardiovascular diseases to prevent future hospitalizations.
Data Interpretation
Absolute readmission rates reported in this study were
lower than in some prior publications.6,11,21,22,23,24 However, it
is difficult to directly compare rates, due to several factors:
previous analysis have focused only on Medicare patients7,10,
only patients with STEMI21, or only patients undergoing PCI
(percutaneous coronary intervention)23,24.
A recent study looking at elderly NSTEMI survivors found, contrary to our results, that rehospitalization rates did not rise substantially with advancing age, but the mortality rate was twice as much. Similarly to our data, they demonstrated that
the readmission is often for non-cardiac diagnoses.25
Contrary to previously publications26,27, patients discharged to
SNF had decreased odds of being readmitted in the multivariate analysis for early and cardiac related readmission. On the other hand, univariate analysis of all 30-day readmissions, showed that patients discharged to rehabilitation and SNF were more likely to be readmitted. These contradictory results could be explained by the different functional levels, multiple comorbidities of patients deemed to have a skilled need instead of going home and the different SNF transfer rates that vary considerably across hospitals.
Our model fits reasonably well. Compared to previously developed 30-day readmission models, our model has better discrimination with ROC curves as those range between 0.63 and 0.67.21,23,24,28
Limitations
This study is not free of limitations. We are not including death as an outcome, as we did not have the capacity to follow patients outside of our system. Because of the PCI capacity of our four institutions, our report may not be generalizable to medical centers performing predominantly primary thrombolytic therapy. Third, the retrospective nature of our study
conceptually limits the inferential capacity of our model.
We detected readmissions using MHS data, which includes four facilities but we did not have the power to detect admissions to other health systems. To completely ascertain the end point of readmission, it has been suggested to use Medicare
data10. Nonetheless, this approach would only analyze patients
over the age of 65 years and not include health maintenance organization (HMO)-covered beneficiaries under Medicare, which in our sample were 9%, but in some geographic regions
can represent more than 50%21. On the other hand,
hospital-level adjusted readmission rates developed using Medicare
claims have been demonstrated to be highly correlated to the
use of hospital medical records, (correlation, 0.98). 27
We have excluded patients with planned readmissions which might account for some selection bias in our final sample. Most of these patients had gastrointestinal or orthopedic procedures performed. Nonetheless, patients with triple vessel disease and residual high grade coronary stenosis that were readmitted for CABG were included in our sample, decreasing the likelihood of excluding more symptomatic cardiac patients in our analysis.
Studies looking for both 30-day and 1-year readmissions after AMI have found significant variation in predictors depending on the cause and timing of readmission, suggesting that all-cause 30-day readmission rates may be too simplistic, and perhaps
even misleading, as a hospital performance metric.11, 24
Clinical implication
We expanded on the science by adding risk factors derived from the time to cardiac catheterization since admission and destination at discharge, both of which were associated with readmission. We contributed to the existing literature a clinical risk model for AMI 30-day readmission in the community setting, taking into account all ages, insurance status and treatment modality for the index AMI.
Conclusion
We present a prediction model for 30-day readmission following AMI. We present novel and addressable patient risk factors derived from the index hospitalization and their utility in predicting readmission. Our model can be used to develop routine surveillance systems when planning discharge after AMI to determine the likelihood of near-term adverse events that may eminently jeopardize patient safety.
Based on this analysis, we have implemented interventions to decrease the readmission rate, especially addressed for the first week after discharge. These include having all the medications delivered to bedside before discharge, a checklist with multidisciplinary standard of care parameters, a dedicated hospitalist for AMI and CHF patients, phone call by nurse with standardized questionnaire 3 days after discharge and setting up a high risk follow-up appointment within 1 week, either with our academic clinic or with the attending cardiologist. Follow up analysis will determine the efficacy of these interventions.
Statement of ethical publishing
The authors state that they adhere to the statement of ethical
publishing of the International Cardiovascular Forum Journal29.
Conflict of interest statement:
Address for correspondence:
Benjamin Cruz Rodriguez, M.D.1 Second Year Resident
Internal Medicine Residency, Methodist Dallas Medical Center 1441 N. Beckley Av. Dallas, TX 75203
Office 214-947-2306
E-mail: [email protected]
References:
1. BerensonRA, PaulusRA,KalmanNS. Medicare’s readmissions-reduction program—a positive alternative. N Engl JMed. 2012;366:1364-1366. doi: 10.1056/NEJMp1201268
2. Moon MA. U.S. tops 16 nations in STEMI readmissions. CardiologyNews. February 2012:30.
3. Au AG, McAlister FA, Bakal JA, et al. Predicting the risk of unplanned readmission or death within 30 days of discharge after a heart failure hospitalization. Am Heart J. 2012;164:365-372. doi: 10.1016/j. ahj.2012.06.010
4. Bradley EH, Curry L, Horwitz LI, et al. Contemporary evidence about hospital strategies for reducing 30-day readmissions. J Am Coll Cardiol. 2012;60:607-614. doi: 10.1016/j.jacc.2012.03.067.
5. Bettger JP, Alexander KP, Dolor RJ, et al. Transitional care after hospitalization for acute stroke or myocardial infarction. Ann Intern Med. 2012;157:407-416. doi: 10.7326/0003-4819-157-6-201209180-00004. 6. Dunlay SM, Weston SA, Killian JM, Bell MR, Jaffe AS, Roger VL.
Thirty-day rehospitalizations after acute myocardial infarction: a cohort study. Ann Intern Med. 2012 Jul 3;157(1):11-8. doi: 10.7326/0003-4819-157-1-201207030-00004.
7. Dharmarajan K, Hseih AF, Lin Z, et al. Diagnoses and timing of 30-day readmissions after hospitalization for heart failure, acute myocardial infarction, or pneumonia. JAMA. 2013 Jan 23;309(4):355–63. DOI:http:// dx.doi.org/10.1001/jama.2012.216476.
8. Mathews R, Chen AY, Thomas L, Wang TY, Chin CT, Thomas KL, Roe MT, Peterson ED, Differences in short-term versus long-term outcomes of older black versus white patients with myocardial infarction: findings from the Can Rapid Risk Stratification of Unstable Angina Patients Suppress Adverse Outcomes with Early Implementation of American College of Cardiology/American Heart Association Guidelines (CRUSADE). Circulation. 2014 Aug 19;130(8):659-67. doi: 10.1161/ CIRCULATIONAHA.113.008370. Epub 2014 Jul 7.
9. Ranasinghe I, Wang Y, Dharmarajan K, Hsieh AF, Bernheim SM, Krumholz HM. Readmissions after Hospitalization for Heart Failure, Acute Myocardial Infarction, or Pneumonia among Young and Middle-Aged Adults: A Retrospective Observational Cohort Study PLoS Med. 2014 Sep 30;11(9):e1001737. doi: 10.1371/journal.pmed.1001737. 10. Desai MM, Stauffer BD, Feringa HH, Schreiner GC. Statistical models
and patient predictors of readmission for acute myocardial infarction: a systematic review. Circ Cardiovasc Qual Outcomes. 2009 Sep;2(5):500-7. doi: 10.1161/CIRCOUTCOMES.108.832949.
11. Southern DA, Ngo J, Martin BJ, Galbraith PD, Knudtson ML, Ghali WA, James MT, Wilton SB. Characterizing types of readmission after acute coronary syndrome hospitalization: implications for quality reporting. J Am Heart Assoc. 2014 Sep 18;3(5). pii: e001046. doi: 10.1161/ JAHA.114.001046.
12. Coleman EA, Parry C, Chalmers S, Min SJ. The care transitions intervention: results of a randomized controlled trial. Arch Intern Med2006;166:1822-8. doi:10.1001/archinte.166.17.1822.
13. Thygesen K, Alpert JS, White HD. Universal definition of myocardial infarction. Eur Heart J. 2007; 28:2525–2538. [PubMed: 17951287] doi: http://dx.doi.org/10.1093/eurheartj/ehm355
14. Faul, F, Erdfelder, E, Buchner, A, & Lang, AG Statistical power analyses using G*Power 3.1: Tests for correlation and regression analyses. Behavior Research Methods 2009; 41: 1149-1160.
15. Hospital Readmissions Reduction Program. Affordable Care Act., Subpart 1 of 42 CRT part 412. Sect. 1886(q) (2012).
16. Yancy CW, Jessup M, Bozkurt B, et al. 2013 ACCF/AHA guideline for the management of heart failure: a report of the American College of Cardiology Foundation/American Heart Association Task Force on practice guidelines. Circulation. 2013 Oct 15;128(16):e240-327. doi: 10.1161/CIR.0b013e31829e8776.
17. Levey AS, Coresh J, Greene T, Stevens LA, Zhang YL, Hendriksen S, et al. Using standardized serum creatinine values in the modification of diet in renal disease study equation for estimating glomerular filtration rate. Ann Intern Med. 2006; 145:247–254. doi:10.7326/0003-4819-145-4-200608150-00004
18. Lemeshow S, Hosmer DW. The use of goodness-of-fit statistics in the development of logistic regression models. Am J Epidemiol. 1982;115:92–106.
19. Hanley JA, McNeil BJ. The meaning and use of the area under a receiver operating characteristic (ROC) curve. Radiology. 1982;143:29–36. doi: http://dx.doi.org/10.1148/radiology.143.1.7063747
20. Hebert C, Shivade C, Foraker R, Wasserman J, Roth C, Mekhjian H, Lemeshow S, Embi P. Diagnosis-specific readmission risk prediction using electronic health data: a retrospective cohort study. BMC Med Inform Decis Mak. 2014 Aug 4;14:65. doi: 10.1186/1472-6947-14-65. 21. Brown JR, Conley SM, Niles NW 2nd. Predicting readmission or death
after acute ST-elevation myocardial infarction. Clin Cardiol. 2013 Oct;36(10):570-5. doi: 10.1002/clc.22156.
22. Curtis JP, Schreiner G, Wang Y, Chen J, Spertus JA, Rumsfeld JS, et al. All-cause readmission and repeat revascularization after percutaneous coronary intervention in a cohort of Medicare patients. J Am Coll Cardiol. 2009; 54:903–907. doi: 10.1016/j.jacc.2009.04.076.
23. Hannan EL, Zhong Y, Krumholz H, et al. 30-day readmission for patients undergoing percutaneous coronary interventions in New York state. JACC Cardiovasc Interv. 2011;4:1335–1342. doi: 10.1016/j. jcin.2011.08.013.
24. Yeh RW, Rosenfield K, Zelevinsky K, et al. Sources of hospital variation in short-term readmission rates after percutaneous coronary intervention. Circ Cardiovasc Interv. 2012;5:227–236. doi: 10.1161/ CIRCINTERVENTIONS.111.967638.
25. Lopes RD, Gharacholou SM, Holmes DN, Thomas L, Wang TY, Roe MT, Peterson ED, Alexander KP. Cumulative Incidence of Death and Rehospitalization Among the Elderly in the First Year after NSTEMI. Am J Med. 2015 Jun;128(6):582-90. doi: 10.1016/j.amjmed.2014.12.032. 26. Dunlay SM, Pack QR, Thomas RJ, Killian JM, Roger VL, Participation in
cardiac rehabilitation, readmissions, and death after acute myocardial infarction. Am J Med. 2014 Jun;127(6):538-46. doi: 10.1016/j. amjmed.2014.02.008.
27. Chen J,Ross JS,Carlson MD,et al. Skilled nursing facility referral andhospital readmission rates after heart failure or myocardial infarction Am J Med. 2012 Jan;125(1):100.e1-9. doi: 10.1016/j. amjmed.2011.06.011.
28. Krumholz HM, Lin Z, Drye EE, Desai MM, Han LF, Rapp MT, Mattera JA, Normand SL. An administrative claims measure suitable for profiling hospital performance based on 30-day all-causereadmission rates among patients with acute myocardial infarction. Circ Cardiovasc Qual Outcomes. 2011 Mar;4(2):243-52. doi: 10.1161/ CIRCOUTCOMES.110.957498.