Prevalence of Metabolic Syndrome and
Diabetes on a High-Risk Population with
Suspected Coronary Artery Disease
Prevalência de Síndrome Metabólica e Diabetes numa População de Alto Risco
com Suspeita de Doença Coronária
A.T.T., M.M.C., R.C.F.: Serviço de Cardiologia. Hospital Santa Marta. Lisboa. Portugal.
Recebido: 23 de Dezembro de 2011 - Aceite: 30 de Abril de 2012 | Copyright © Ordem dos Médicos 2012
Ana Teresa TIMÓTEO, Miguel MOTA CARMO, Rui Cruz FERREIRA Acta Med Port 2012 Mar-Apr;25(2):83-90
RESUMO
Objectivos: A prevalência de Sindroma Metabólica (SM) e diabetes é variável consoante a definição utilizada, assim como com a região geográfica e o grupo étnico estudado. Não existem estudos em indivíduos portugueses com suspeita de doença arterial coro-nária. Analisámos a prevalência de SM e diabetes nesta população específica de doentes, comparando também definições.
Métodos: Incluíram-se no estudo 300 indivíduos, com uma idade media de 64 ± 9 anos, 59% do género masculino, admitidos para angiografia coronária electiva, tendo sido excluídos os doentes com doença cardíaca previamente conhecida. Avaliou-se a prevalência de SM e de diabetes.
Resultados: A prevalência ajustada de SM foi de 39,3% (critério NCEP-ATP III), 53,8% (critério IDF) e 48,4% (critério AHA/NHLBI). A prevalência ajustada de diabetes foi de 14,8% pela definição prévia da ADA e de 36.4% com a definição mais recente. A concordância global entre as definições de SM foi de 45,3%, sendo mais elevada entre as definições da AHA/NHLBI e da NCEP-ATP III (Kappa 0,821). A prevalência de SM está altamente dependente da idade em ambos os géneros, sendo mais prevalente no género feminino. A prevalência de diabetes é também dependente da idade, sendo semelhante em ambos os géneros. O componente de SM mais frequente é a hipertensão arterial, seguido pela obesidade abdominal, elevação da glicose, colesterol-HDL baixo e finalmente elevação dos triglicéridos. É também importante referir que 60% dos doentes estavam sob terapêutica hipolipemiante (56,6% com estatinas, 1,7% com fibratos e 1,7% com ambos). A diferença mais significativa entre géneros no que diz respeito aos componentes de SM é a elevada prevalência de obesidade abdominal no género feminino.
Conclusões: Nesta população de alto risco, a prevalência de SM é elevada, sendo contudo a prevalência de diabetes semelhante à registada em estudos epidemiológicos na população geral.
AbStRACt
Objectives: Metabolic syndrome and diabetes prevalence varies according to chosen definition, as well as with the geographical and ethnical group. No studies are available in Portuguese patients with suspected coronary artery disease. We analysed metabolic syn-drome and diabetes prevalence in this specific population and compared definitions.
Methods: The study included 300 patients, with a mean age of 64 ± 9 years, 59% males, admitted for an elective coronary angiography and we excluded patients with previous cardiac disease. Metabolic syndrome and diabetes prevalence was obtained.
Results: The adjusted prevalence of metabolic syndrome was found to be 39.3% (NCEP-ATP III criteria), 53.8% (IDF criteria) and 48.4% (AHA/NHLBI). Adjusted prevalence of diabetes was 14.8% by the previous ADA definition and 36.4% with the new definition. Global agreement between metabolic syndrome definitions was 45.3%, with the highest value between AHA/NHLBI and NCEP-ATP III (Kappa 0.821). Metabolic syndrome prevalence was highly age-dependent in both genders and more prevalent in females. Diabetes prevalence was also age-dependent, with similar prevalence in both genders. The most frequent metabolic syndrome component was hypertension, followed by abdominal obesity, raised glucose, low HDL-cholesterol and finally increased triglycerides. It is also important to mention that 60% of the patients were under lipid-lowering treatment (56.6% with statins, 1.7% with fibrates and 1.7% with both). The most significant difference between genders for metabolic syndrome components is the high prevalence of abdominal obesity in females.
Conclusions: In this high-risk population, metabolic syndrome prevalence is high, with similar diabetes prevalence compared with general population epidemiological studies.
INtRODUCtION
Metabolic syndrome (MS) is a cluster of metabolic dis-turbances that includes abdominal obesity, atherogenic dyslipidemia (hypertriglyceridemia and/or low HDL-choles-terol), elevated blood pressure, and glucose metabolism disorders, and is a determinant of cardiovascular disease and type 2 diabetes.1,2 Cardiovascular disease is a major problem in Portugal, not only as far as coronary artery dis-ease is concerned, but also in terms of stroke, the incidence of which is among the highest in the world.3 Clinically it is of great significance the identification of patients at risk of developing cardiovascular disease and/or diabetes to en-able preventive interventions and promote lifestyle
modi-fications. In the last few years, there have been several definitions and classification criteria for MS. Currently, the definitions most often used for MS are those of the National Cholesterol Education Program – Third Adult Treatment Panel (NCEP-ATP III), the International Diabetes Federa-tion (IDF) and a more recent definiFedera-tion from the American Heart Association and the National Heart, Lung, and Blood Institute (AHA/NHLBI).4-6
Since there is a strong age and gender dependence in the prevalence of MS and diabetes, as well as a geographi-cal variation, it is important to perform specific studies in regional populations.7,8 In Portugal, there are few studies in
AR
the general population, but no study addressed specifically the high-risk population with suspected coronary artery dis-ease.9-17 Other studies in similar populations performed in European countries used mainly NCEP-ATP III definition and no comparison was made with the more recent defi-nition. Also the impact of the recent definition of diabetes from the American Diabetes Association (ADA) was not yet analysed in a Portuguese population.18
In a sample of individuals admitted for an elective coro-nary angiography with suspected corocoro-nary artery disease, we analysed the prevalence of MS using the new AHA/ NHLBI definition and compared it with the two older defini-tions, measuring classification agreement. Diabetes preva-lence was analysed with the 2003 ADA definition and com-pared it with the most recent definition.18,19 In general, we aimed to characterize the cardiovascular risk profile of an adult Portuguese population with suspected coronary artery disease by determining the prevalence of diabetes, MS and each of its components.
MAtERIAL AND MEtHODS
The present study is an observational and cross-sec-tional study, with prospective inclusion of patients admitted for an elective coronary angiography with suspected coro-nary artery disease (clinically or with ischemia documen-tation by non-invasive tests) between 2008 and 2010. All patients had an age ≥ 18 years. Patients with previously known heart disease were excluded. All patients gave their written informed consent and the study protocol conforms to the ethical guidelines of the 1975 Declaration of Helsinki. Anthropometrical data were obtained after an overnight fast. Body weight was measured to the nearest kilogram, and height to the nearest centimetre. Body Mass Index (BMI) was calculated as weight in kilograms divided by the height in meters, squared. Waist circumference (WC) was measured to the nearest centimetre, with the subject stand-ing, midway between the lower limit of the rib cage and the iliac crest. Obesity was defined as BMI ≥ 30 Kg/m2, over-weight as BMI 25-29.9 Kg/m2, normal BMI as < 25 Kg/m2. Blood pressure was measured on several occasions during hospital stay and hypertension was defined by a previous diagnosis of hypertension or the presence of systolic blood pressure ≥ 140 mmHg or diastolic blood pressure ≥ 90 mmHg (mean of two consecutive measurements). Patients that smoked during the previous six months were classi-fied as smokers and were self-reported. Patients on treat-ment with lipid-lowering drugs or with abnormal lipid profile were classified has having hyperlipidemia. All participants were asked to bring their current medication and this was recorded.
A venous blood sample was drawn after a 12-hour overnight fast. Serum glucose, total cholesterol and triglyc-erides were determined using automatic standard routine enzymatic methods. HDL-cholesterol was determined after specific precipitation. LDL-cholesterol was determined by Friedwald formula.
MS was considered present by the NCEP-ATP III
defi-nition if at least three of the following characteristics were present: fasting glucose ≥ 110 mg/dL; blood pressure ≥ 130/85 mmHg; triglycerides ≥ 150 mg/dL; HDL-cholesterol < 50 mg/dL in women and < 40 mg/dL in men; WC ≥ 88 cm in women and ≥ 102 cm in men.4 The IDF definition was WC³ 80 cm in women and³ 94 cm in men, and at least two of the following: fasting glucose ≥ 100 mg/dL or previously diagnosed type 2 diabetes; blood pressure ≥ 130/85 mmHg or antihypertensive medication; triglycerides ≥ 150 mg/dL or specific treatment for this lipid abnormality; HDL-cholesterol < 50 mg/dL in women and < 40 mg/dL in men or specific treatment for this lipid abnormality.5 Finally, the AHA/NHLBI defined MS as at least three of the following: fasting glucose ≥ 100 mg/dL or antidiabetic treatment; blood pressure ≥ 130/85 mmHg or antihypertensive medication; triglycerides ≥ 150 mg/dL or specific treatment for this lipid abnormality; HDL-cholesterol < 50 mg/dL in women and < 40 mg/dL in men or specific treatment for this lipid abnormality; WC ≥ 88 cm in women and ≥ 102 cm in men.6
Diabetes was defined as a previous diagnosis or in the presence of a fasting glucose level ≥ 126 mg/dL according to 2003 ADA definition, or the above criteria and/or a gli-cated hemoglobin ≥ 6.5% by the 2010 ADA definition.18,19 Significant coronary artery disease was defined by a coronary stenosis ≥ 50% in any segment.
Statistical analysis
Statistical analysis was performed with PASW version 18 statistical software (Chicago, Illinois, USA). A p-value < 0.05 was considered statistically significant.
Continuous variables were described as mean and standard deviation, or as median values and corresponding 25th and 75th percentiles for non-normally distributed vari-ables. Comparison was made with Student’s t-test or Mann-Whitney’s test as appropriate. One-way ANOVA or Kruskal-Wallis’s test was used to compare continuous variables with more than two groups. Proportions were reported for cate-gorical variables and compared using the chi-square test or Fischer’s exact test, whenever appropriate. Prevalence was adjusted for gender and age by the total probability theo-rem, taking into account the demographical composition of the adult population resident in Portugal in 2000 (National Institute of Statistics data) to make results comparable to other general population studies. The kappa coefficient was used to analyse statistical agreement between metabolic syndrome definitions.
RESULtS
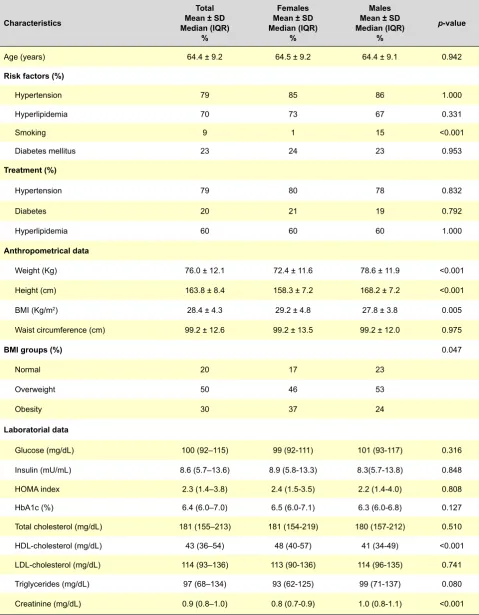
We included 300 patients in the study, with a mean age of 64 ± 9 years (aged 38 - 86 years), 59% males (Table 1). In females, the prevalence of smoking was lower, but the prevalence of the other risk factors was similar between genders. Treatment was also identical, as well as almost all laboratorial parameters with the exception of HDL-choles-terol and creatinine (Table 1). WC was similar but women had higher BMI. The combined prevalence of Obesity / Overweight in the present population reaches 80%.
AR
Table 1 – Characteristics of the study population and by gender.
Characteristics
total Mean ± SD Median (IQR)
%
Females Mean ± SD Median (IQR)
%
Males Mean ± SD Median (IQR)
%
p-value
Age (years) 64.4 ± 9.2 64.5 ± 9.2 64.4 ± 9.1 0.942
Risk factors (%)
Hypertension 79 85 86 1.000
Hyperlipidemia 70 73 67 0.331
Smoking 9 1 15 <0.001
Diabetes mellitus 23 24 23 0.953
treatment (%)
Hypertension 79 80 78 0.832
Diabetes 20 21 19 0.792
Hyperlipidemia 60 60 60 1.000
Anthropometrical data
Weight (Kg) 76.0 ± 12.1 72.4 ± 11.6 78.6 ± 11.9 <0.001
Height (cm) 163.8 ± 8.4 158.3 ± 7.2 168.2 ± 7.2 <0.001
BMI (Kg/m2) 28.4 ± 4.3 29.2 ± 4.8 27.8 ± 3.8 0.005
Waist circumference (cm) 99.2 ± 12.6 99.2 ± 13.5 99.2 ± 12.0 0.975
bMI groups (%) 0.047
Normal 20 17 23
Overweight 50 46 53
Obesity 30 37 24
Laboratorial data
Glucose (mg/dL) 100 (92–115) 99 (92-111) 101 (93-117) 0.316
Insulin (mU/mL) 8.6 (5.7–13.6) 8.9 (5.8-13.3) 8.3(5.7-13.8) 0.848
HOMA index 2.3 (1.4–3.8) 2.4 (1.5-3.5) 2.2 (1.4-4.0) 0.808
HbA1c (%) 6.4 (6.0–7.0) 6.5 (6.0-7.1) 6.3 (6.0-6.8) 0.127
Total cholesterol (mg/dL) 181 (155–213) 181 (154-219) 180 (157-212) 0.510
HDL-cholesterol (mg/dL) 43 (36–54) 48 (40-57) 41 (34-49) <0.001
LDL-cholesterol (mg/dL) 114 (93–136) 113 (90-136) 114 (96-135) 0.741
Triglycerides (mg/dL) 97 (68–134) 93 (62-125) 99 (71-137) 0.080
Creatinine (mg/dL) 0.9 (0.8–1.0) 0.8 (0.7-0.9) 1.0 (0.8-1.1) <0.001
SD, standard deviation; IQR, interquartil range; BMI, body mass index; HOMA, Homeostasis Model Assessment; HbA1c, Glicated hemoglobin.
AR
AR
tIGO ORIGINAL
MS prevalence was 55.3% by the AHA/NHLBI definition, which was intermediate between the NCEP-ATP III and the IDF definition (Table 2). The prevalence was also higher in females in all definition. Agreement between MS defini-tions was variable, being higher for the AHA/NHLBI and the NCEP-ATP III (Kappa 0.821) followed by the AHA/NHLBI and the IDF (Kappa 0.746) and the NCEP-ATP III and the IDF (Kappa 0.634). Global agreement (number of patients with MS according to all three definitions) was 45.3%. There was a progressive increase on MS prevalence with age, from 40% in those with an age < 50 years, to 54.1% in those between 50-59 years, 53.4% in those with 60-69 years and 63.9% in those with 70 years or older. Overall, the prevalence was higher in the female gender (p=0.001) with different proportions according to age group. In younger patients, the prevalence was similar (40%), but after the fifth decade there is a divergence of prevalence between genders, with prevalence above 60% in women. In the age group of 50-59 years, the prevalence in males was 47.2% and in females 64.0%. In the age group of 60-69 years, it was 42.9% and 68.5% and in the age group ≥ 70 years, it was 55.1% and 76.5% respectively, in males and females.
The most prevalent MS component by the AHA/NHLBI definition was hypertension, present in 85.7% of individuals, followed by abdominal obesity (58%), high blood glucose (53.7%), low HDL-cholesterol (48.3%) and elevated triglyc-erides (22%) (Table 3). Atherogenic dislipidemia, defined by elevated triglycerides and/or low HDL-cholesterol, was present in 57% of individuals. We had an elevated percent-age of patients with normal levels of triglycerides (78%) and HDL-cholesterol (51.7%). For the analysis of lipid profile, it is important to bare in mind that 60% of the present popula-tion was under specific lipid-lowering therapy (56.6% with statins, 1.7% with fibrates and 1.7% with both). If consid-ered the NCEP-ATP III definition, the prevalence of elevated glucose is lower than in the AHA/NHLBI definition (30.7%). In gender comparison, the main difference was found on abdominal obesity that was significantly higher in females (Table 4). With increasing age, we detected an increase in the prevalence of abdominal obesity, increased blood glu-cose and low-HDL-cholesterol (Table 3). Elevated triglycer-ides prevalence decreased slightly with age. No significant variation was detected for hypertension.
Age was identical in the three BMI groups. MS preva-lence, abdominal obesity, low HDL-cholesterol and in-creased triglycerides were more prevalent in overweight and obese patients, with similar prevalence of hypertension and obesity (Table 5).
Diabetes prevalence was also much higher with the new ADA definition compared with the 2003 definition (Table 2). The prevalence with the 2003 definition also increases with age, being 4% in those with an age < 50 years, to 21.3% in those between 50-59 years, 27.5% in those with 60-69 years and 23% in those with 70 years or older. In diabet-ics, the prevalence of MS was 65.2% (Males: 45% and Females: 93.1%) and 60.9% for abdominal obesity (Males:
37.5% and Females: 93.1%). Diabetes was more prevalent in ‘Normal’ BMI group, followed by ‘Obese’ and ‘Overweight’ (Table 5).
Significant angiographic coronary artery disease was present in 51.3% of patients, but it was significantly lower in females (35.8% vs. 62.1%, p<0.001). None of the MS defi-nitions could predict the presence of significant coronary ar-tery disease: NCEP-ATP III (OR 0.94, 95% CI 0.59 – 1.48, p=0.778), IDF (OR 0.89, 95% CI 0.56 – 1.42, p=0.629) and AHA/NHLBI (OR 0.98, 95% CI 0.62 – 1.55, p=0.935). The same was obtained after adjustment for age and gender: NCEP-ATP III (OR 1.24, 95% CI 0.75 – 2.05, p=0.397), IDF (OR 1.00, 95% CI 0.60 – 1.65, p=0.994) and AHA/NHLBI (OR 1.09, 95% CI 0.66 – 1.78, p=0.740).
DISCUSSION
We found in our study population a very high prevalence of obesity compared to other studies performed in primary care setting. In our study group, 30% of the patients were obese, reaching an alarming value of 80% after inclusion of overweight patients, which is probably related to the fact that our population is a high-risk population. Obesity preva-lence is particularly high in women, similar to previous stud-ies.
Several epidemiological studies suggested an increase in MS prevalence in western societies as a consequence of the obesity epidemic particularly in the youngest.20,21 Fol-lowing this increase in obesity, cardiovascular risk factors related with obesity (such as diabetes, hyperlipidemia and hypertension) are also more prevalent with an important impact in society.20 In a Portuguese study on the preva-lence of obesity, it was reported an increase in obesity and overweight from the year 2003 to 2005, affecting already 53.6% of the population.22 The IDEA study (International Day for the Evaluation of Abdominal Obesity) recently pub-lished and conducted in 63 countries at primary care level, detected obesity in 24% of men and 27% of females and abdominal obesity in 29% and 48% respectively.23 In the Portuguese cohort, 25.5% were obese and 39.6% were overweight, with higher prevalence compared to previous studies and close to our results. These results might be ex-plained by the fact that our population has a high cardiovas-cular risk (with different characteristics from primary care) or might translate a real increase in obesity/overweight preva-lence, as suggested by epidemiological studies in the last decades.
Table 2– Metabolic syndrome (MS) and diabetes crude and adjusted prevalence.
(%) AHA/NHLBIMS NCEP-ATP IIIMS IDFMS ADA 2003Diabetes ADA 2010Diabetes
Males 46.9 36.2 56.5 22.6 45.2
Females 67.5 61.0 72.4 23.6 50.4
Total 55.3 46.3 63.0 23.0 47.3
Total Adjusted 48.4 39.3 53.8 14.8 36.4
Table 3– Prevalence of each metabolic syndrome component according to age.
Age (years) syndromeMetabolic Hypertension Abdominal obesity Increased glucose triglyceridesIncreased HDL-cholesterolLow
< 50 40.0% 88.0% 48.0% 28.0% 32.0% 24.0%
50 - 59 54.1% 77.0% 55.7% 47.5% 24.6% 44.3%
60-69 53.4% 87.0% 53.4% 58.0% 21.4% 50.4%
≥70 63.9% 89.2% 69.9% 59.0% 18.1% 55.4%
Total 55.3% 85.7% 58.0% 53.7% 22.0% 48.3%
Table 4 - Prevalence of individual metabolic syndrome components by gender and prevalence of metabolic syndrome by age and gen-der.
Prevalence Males Females
Hypertension 85.9% 85.4%
Abdominal obesity 38.4% 86.2%
Increased triglycerides 24.3% 18.7%
Low HDL-cholesterol 41.2% 58.5%
Increased glucose 56.5% 49.6%
Metabolic syndrome
Total 46.9% 67.5%
< 50 years 40.0% 40.0%
50 – 59 years 47.2% 64.0%
60 – 69 years 42.9% 68.5%
≥ 70 years 55.1% 76.5%
Table 5– Metabolic syndrome components according to BMI groups.
Normal Overweight Obese p-value
Age (years) 65 ± 10 64 ± 9 65 ± 9 0.525
Male gender (%) 65.6 62.7 48.3 0.047
Lipid-lowering treatment (%) 54.1 61.3 61.8 0.572
Diabetes (%) 27.9 19.3 25.8 0.307
Metabolic syndrome (%) 23.0 54.0 79.8 <0.001
MS components (%)
Hypertension 78.7 86.7 88.8 0.198
Increased glucose 41.0 58.0 55.1 0.076
Abdominal obesity 24.6 51.3 91.2 <0.001
Low HDL-cholesterol 29.5 47.3 62.9 <0.001
Increased triglycerides 8.2 22.0 31.5 0.003
MS: metabolic syndrome.
AR
abdominal obesity, which is at the same level as the other components. The age and gender-adjusted prevalence (to allow comparison with previous epidemiological studies in the general population) is higher than previous national and international population studies, confirming the higher prev-alence of MS in our high-risk population.9-17,24,25
Several epidemiological studies detected some varia-tion of MS prevalence worldwide, according to geographical area, gender and ethnical background, suggesting an im-portant effect of genetic and environmental factors, reinforc-ing the importance of regional studies.7,8 Most studies used the NCEP-ATP III definition and showed an elevated preva-lence of MS in different regions of the world. In the United States of America, the NHANES III study (Third National Health and Nutrition Examination Survey), reported a global prevalence of 23.7%, increasing after 40 years of age and no differences were detected between genders.24 However, it detected a significant difference by ethnical origin, being more prevalent in Hispanic patients (31.9%) compared to Caucasians (23.8%) or Afro-American patients (21.6%). In the DECODE (Diabetes Epidemiology: Collaborative analy-sis Of Diagnostic Criteria in Europe) study, conducted in Europe in non-diabetic patients and using the NCEP-ATP III criteria, MS prevalence was 25.9% in males and 23.4% in females, close to the NHANES III registry.26 Globally, smaller studies in Europe with the NCEP-ATP III definition reported prevalences close to 20-25%, but with significant geographical variations from 11.8% to 24.5% in Mediterra-nean countries.25,27-35 However, comparisons between stud-ies must be done with caution due to different definitions as well as with different population characteristics.
In Portugal some studies were performed at primary care level. A study by Santos, et al. in an urban population showed that 24% of the population fulfilled the NCEP-ATP III criteria for MS.11,16 However, this result cannot be gener-alized to the general population with different characteristics from an urban population. The same author reported that the prevalence according to the NCEP-ATP III definition
was 24.0%, 26.4% by the WHO definition, 37.2% by the AHA/NHLBI definition and 41.9% according to the IDF defi-nition. The VALSIM (Estudo Epidemiológico de Prevalên-cia da Síndrome Metabólica na População Portuguesa) study is the largest study on cardiovascular risk profile of an adult Portuguese population followed in primary care.21 MS prevalence in that study (by the NCEP-ATP III definition) was elevated (27.5% non-adjusted and 23.7% adjusted to age and gender), similar to the NHANES III report. In non-diabetic patients, the prevalence was 27.6% (19.8% adjust-ed), lower than in the DECODE study report. The VALSIM study also showed an important regional variation. That study used NCEP-ATP III MS definition and in our study, the prevalence was higher with both the AHA/NHLBI definition (our main definition) and NCEP-ATP III definition (p<0.001). Thus, our results showed a higher prevalence of MS even after age and gender adjustment, reflecting a high-risk pop-ulation, but as in the case of obesity, it can also reflect a real increase in the prevalence of MS in the population, because previous studies were done before 2008 (Fig.1).
In general, good agreement was found between defini-tions. The agreement was highest when we compared the AHA/NHLBI definition with the NCEP-ATP III definition, and lowest with the IDF definition. This reflects the fact that the first two definitions consider the same five factors to de-scribe MS: central obesity, raised fasting glucose, raised tri-glyceride levels, reduced HDL-cholesterol and raised blood pressure. Moreover, the AHA/NHLBI definition only makes minor changes to the NCEP-ATP III definition, lowering the threshold for considering raised fasting glucose. Also, the IDF and the AHA/NHLBI definitions include the use of phar-macological treatment for the metabolic abnormalities, con-sidering the component present when a subject takes that specific medication. However, our global agreement be-tween definitions was only 45.3%, which was lower than the 61% reported by Santos et al., but with similar results when comparing each pair of definitions.16 It is therefore very im-portant to agree on a single definition. This is very imim-portant Fig. 1 – Prevalence of metabolic syndrome and each metabolic syndrome component in our study and compared to the VALSIM study.
* p-value < 0.001.
AR
not only to compare prevalence across populations but also to correctly identify cases with MS.
As expected, we found a significant association of age and female gender with MS prevalence, similar to the VAL-SIM study.21 Overall, obesity is more prevalent in women with a prevalence above 60% in women above 50 years. Portuguese and Italian epidemiological studies showed an increased risk of MS in women, unlike other studies such as the NHANES III study where no difference was found.21,24,33,34,36 However, this last study also analysed dif-ferent ethnic groups and concluded that there is a higher prevalence of MS amongst North American Caucasian men (24.8 vs. 22.8%) and amongst Afro-American and Hispanic females (25.7% vs. 16.4% and 35.6 vs. 28.3%, respective-ly). This data suggests an important influence of ethnicity. In general, the prevalence of each component is higher than in primary care populations, reflecting the study high-risk population, with the exception of raised triglycerides that are less frequent and probably related to the fact that a very significant proportion of patients were on lipid lowering therapy. Comparing the prevalence of high blood glucose reported in the VALSIM study (with the NCEP-ATP III defini-tion – 25.0%) with ours, using the same definidefini-tion (30.7%), to allow a more accurate comparison, it was significantly higher (p=0.021), confirming that in this high-risk popula-tion there is a poor glucose control. We also like to menpopula-tion the fact that raised blood glucose was present in 53.7% of patients with the AHA/NLHBI definition, compared with the 30.7% obtained with the NCEP-ATP III definition (p<0.001), as a result of the cut-off reduction of fasting blood glucose in the most recent MS definition.
In our population, the adjusted diabetes prevalence was 14.8%, close to the prevalence obtained in the VALSIM (13%) and the IDEA study in the general popula-tion.16,23 No gender difference was detected. However, it is worth to mention that with the most recent diabetes defi-nition from the ADA, which included glicated hemoglobin as a criterion, the adjusted prevalence in our population increases to 36.4%, which is a very significant increase. This will have an important impact in therapeutical terms, because it will imply an important increase in medical costs. As expected, the prevalence of diabetes is also highly age-dependent, similar to the DECODE study.26
We can conclude from these results that although dia-betic patients are considered to have a high-risk for coro-nary artery disease, they aren’t being consistently referred for coronary angiography. Diabetic patients are often as-ymptomatic or present with atypical / equivalent symptoms, which might delay referral for coronary angiography. There-fore, since the risk in these patients is very high, medical doctors should be more alert for signs suggestive of myo-cardial ischemia with subsequent referral for coronary an-giography in case of ischemia detection by non-invasive tests.
Our study showed a surprisingly low diagnostic yield of
coronary angiography. However, recent registries point to the same results. The recently published CathPCI Regis-try of the National Cardiovascular Data RegisRegis-try (NCDR), a large registry of clinical data and in-hospital outcome data associated with diagnostic cardiac catheterisation and percutaneous coronary interventions collected from more than 800 United States sites reported also a low diagnostic yield in patients without previously known coronary artery disease, with only a minority of patients with obstructive disease (41.0%) similar to our results.37 This registry repre-sents contemporary clinical practice in the community. In our population, no association was found between MS (by any definition) and significant angiographic coronary artery disease. These results are in opposition to previous reports that showed an association between MS and car-diovascular events.1 However, our study is an angiographic study that provides different information from that obtained in epidemiological studies that analyse cardiovascular events. Acute cardiovascular events have different patho-physiological mechanisms from what we observe in stable coronary atherosclerotic plaque and metabolic syndrome seems to be more related with vulnerable atherosclerotic plaques. In fact, the metabolic syndrome factors confer very different intensities of independent risk for angiograph-ic coronary artery disease, from high independent risk of hypertriglyceridemia and high blood glucose to almost no independent effect of overweight that even appears to be protective.38 In the absence of obesity, three other higher risk criteria are required for the diagnosis. As a result, there is heterogeneity of risk among patients with metabolic syn-drome, depending on the particular criteria used to diag-nose it.
CONCLUSIONS
In this high-risk population of patients with suspected coronary artery disease, metabolic syndrome prevalence is high, with similar diabetes prevalence compared with general population epidemiological studies. Metabolic syndrome prevalence is highest with the IDF definition, fol-lowed by the AHA/NHLBI definition and the NCEP-ATP III definition. However, global agreement between definitions is modest, which might have implications in the results of studies on metabolic syndrome. There is an important age-dependence of metabolic syndrome and diabetes preva-lence. In women, the prevalence of metabolic syndrome is significantly higher, related with the very high prevalence of increased abdominal obesity.
CONFLICt OF INtEREStS
None stated.
FUNDING SOURCES
None stated.
AR
level, relative body weight, and changes in their association over 10 years: an international perspective from the WHO MONICA Project. Am J Public Health 2000;90(8):1260-1268.
22. do Carmo I, Dos Santos O, Camolas J, Vieira J, Carreira M, Medina L,
et al. Overweight and obesity in Portugal: national prevalence in 2003 – 2005. Obes Rev 2008;9(1):11-19.
23. Balkau B, Deanfield JE, Després JP, Bassand JP, Fox KA, Smith SC Jr,,
et al. International Day for the Evaluation of Abdominal Obesity (IDEA): a study of waist circumference, cardiovascular disease, and diabetes mellitus in 168.000 primary care patients in 63 countries. Circulation 2007;116(17):1942-1951
24. Ford ES, Giles WH, Dietz WH. Prevalence of metabolic syndrome among US adults: findings from the third National Health and Nutrition Examination Survey.JAMA 2002;287(3):356-359.
25. Alegría E, Cordero A, Laclaustra M, Grima A, León M, Casasnovas JA, et al. Prevalence of metabolic syndrome in the Spanish working population: MESYAS registry. Rev Esp Cardiol 2005;58(7):797-806. 26. Qiao Q, DECODE Study Group. Comparison of different definitions
of the metabolic syndrome in relation to cardiovascular mortality in European men and women. Diabetologia 2006;49(12):2837-2846. 27. Martínez-Larrad MT, Fernández-Pérez C, González-Sánchez
JL, López A, Fernández-Alvarez J, Riviriego J, et al. Prevalence of the metabolic syndrome (ATP-III criteria). Population-based study of rural and urban areas in the Spanish province of Segovia. Med Clin (Barc) 2005;125(13):481-486.
28. Martinez CJ, Franch NJ, Romero OJ, Canovas DC, Gallardo MA, Paez PM. Prevalence of metabolic syndrome in the adult population of Yecla (Murcia). Degree of agreement between three definitions of it. Aten Primaria 2006;38(2):72-79.
29. Calbo Mayo JM, Terrancle de Juan I, Fernández Jiménez P, Rodríguez Martín MJ, Martínez Díaz V, Santisteban López Y, et al. Prevalence of metabolic syndrome in the province of Albacete (Spain). Rev Clin Esp 2007;207(2):64-68.
30. Boronat M, Chirino R, Varillas VF, Saavedra P, Marrero D, Fábregas M, et al. Prevalence of the metabolic syndrome in the island of Gran Canaria: comparison of three major diagnostic proposals. Diabet Med 2005;22(12):1751-1756.
31. Guize L, Thomas F, Pannier B, Bean K, Danchin N, Bénétos A. Metabolic syndrome: prevalence, risk factors and mortality in a French population of 62000 subjects. Bull Acad Natl Med 2006;190(3):685-697. 32. Pannier B, Thomas F, Eschwège E, Bean K, Benetos A, Leocmach Y, et
al. Cardiovascular risk markers associated with the metabolic syndrome in a large French population: the “SYMFONIE” study. Diabetes Metab 2006;32(5 Pt 1):467-474.
33. Bo S, Ciccone G, Pearce N, Merletti F, Gentile L, Cassader M, et al. Prevalence of undiagnosed metabolic syndrome in a population of adult asymptomatic subjects. Diabetes Res Clin Pract 2007;75(3):362-365. 34. Cicero AF, Nascetti S, Noera G, Gaddi AV, Massa Lombarda Project
team. Metabolic syndrome prevalence in Italy. Nutr Metab Cardiovasc Dis 2006;16(6):e5-e6.
35. Athyros VG, Bouloukos VI, Pehlivanidis AN, Papageorgiou AA, Dionysopoulou SG, Symeonidis AN, et al. The prevalence of the metabolic syndrome in Greece: the MetS-Greece Multicenter Study. Diabetes Obes Metab 2005;7(4):397-405
36. Miccoli R, Bianchi C, Odoguardi L, Penno G, Caricato F, Giovannitti MG, et al. Prevalence of the metabolic syndrome among Italian adults according to ATP III definition. Nutr Metab Cardiovasc Dis 2005;15(4):250-254.
37. Patel MR, Peterson ED, Dai D, Brennan JM, Redberg RF, Anderson HV,
et al. Low diagnostic yield of elective coronary angiography. N Engl J Med 2010;362(10):886-95.
38. Timóteo AT, Mota Carmo M, Ferreira RC. Does metabolic syndrome predict significant angiographic coronary artery disease? Rev Port Cardiol 2012 (In press).
AR
tIGO ORIGINAL
REFERENCES
1. Mottillo S, Filion KB, Genest J, Joseph L, Pilote L, Poirier P, et al. The metabolic syndrome and cardiovascular risk. A systematic review and meta-analysis. J Am Coll Cardiol 2010;56(14):1113-1132.
2. Wilson PWF, D’Agostino RB, Parise H, Sullivan L, Meigs JB. Metabolic syndrome as a precursor of cardiovascular disease and type 2 diabetes mellitus. Circulation 2005;112(20):3066-3072.
3. World Health Organization on behalf of the European Observatory of Health Systems and Policies. Health in the European Union. Trends and analysis. Copenhagen; World Health Organization Regional Office for Europe; 2009.
4. National Cholesterol Education Program (NCEP) Expert Panel on Detection, Evaluation, and Treatment oh High Blood Cholesterol in Adults (Adult Treatment Panel III). Third Report of the National Cholesterol Education Program (NCEP) Expert Panel on Detection, Evaluation, and Treatment of High Blood Cholesterol in Adults (Adult Treatment Panel III) final report. Circulation 2002;106(25); 3143-3421. 5. Alberti K, Zimmet P, Shaw J. Metabolic syndrome – a new world-wide
definition. A consensus statement from the International Diabetes Federation.Diabet Med 2006;23(5):469-480.
6. Grundy SM, Cleeman JI, Daniels SR, Donato KA, Eckel RH, Franklin BA, et al. Diagnosis and management of the metabolic syndrome. An American Heart Association/National Heart, Lung, and Blood Institute Scientific Statement. Circulation 2005;112(17):2735-2752.
7. Takahashi K, Bokura H, Kobayashi S, Iijima K, Nagai A, Yamaguchi S. Metabolic syndrome increases the risk of ischemic stroke in women. Intern Med 2007;46(10):643-648.
8. Butler J, Rodondi N, Zhu Y, Figaro K, Fazio S, Vaughan DE, et al. Metabolic syndrome and the risk of cardiovascular disease in older adults. J Am Coll Cardiol 2006;47(8):1595-1602.
9. Correia F, Poínhos R, Freitas P, Pinhão S, Maia A, Carvalho D, et al. Prevalence of the metabolic syndrome: comparison between ATP III and IDF criteria in a feminine population with severe obesity. Acta Med Port 2006;19(4):289-293.
10. Santos AC, Barros H. Prevalence and determinants of obesity in an urban sample of Portuguese adults. Public Health 2003;117(6):430-437. 11. Santos AC, Lopes C, Barros H. Prevalence of metabolic syndrome in the
city of Porto. Rev Port Cardiol 2004;23(1):45-52.
12. Santos AC, Lopes C, Guimarães JT, Barros H. Central obesity as a major determinant of increased high-sensitivity C-reactive protein in metabolic syndrome. Int J Obes (Lond) 2005;29(12):1452-1456. 13. Santos AC, Ebrahim S, Barros H. Alcohol intake, smoking, sleeping
hours, physical activity and the metabolic syndrome. Prev Med 2007;44(4):328-334.
14. von Hafe P, Lopes C, Maciel MJ, Barros H. The clustering of cardiovascular risk factors in the urban population of Porto. Acta Med Port 1998;11(12):1059-1064.
15. Monteiro S, Dias P, Madeira S, de Moura P, Silva JM, Providência LA, et al. Metabolic syndrome in dyslipidemia consultations. Rev Port Cardiol 2006;25(9):821-831.
16. Santos AC, Barros H. Impact of metabolic syndrome definitions on prevalence estimates: a study in a Portuguese community. Diab Vasc Dis Res 2007;4(4):320-327.
17. Cortez-Dias N, Martins S, Belo A, Fiuza M, VALSIM. Prevalence, management and control of diabetes mellitus and associated risk factors in primary health care in Portugal. Rev Port Cardiol 2010;29(4):509-537. 18. American Diabetes Association. Executive Summary: Standards of
medical care in diabetes – 2010. Diabetes Care 2010;33(Suppl 1):S4-S10
19. American Diabetes Association. Standards of medical care in diabetes - 2006.Diabetes Care 2006;29(Suppl 1):S4-S42.
20. Fiúza M, Cortez-Dias N, Martins S, Belo A, VALSIM study investigators. Metabolic syndrome in Portugal: prevalence and implications for cardiovascular risk – results from the VALSIM study. Rev Port Cardiol 2008;27(12):1495–1529.