International Journal Advances in Social Science and Humanities
Available Online at: www.ijassh.com
RESEARCH ARTICLE
The Study on the Index for Global Mobility of Scientific and
Technological Talents
Yinqiu Wang1, 2*, Hui Luo1, Zhengfeng Li2
1National Academy of Innovation Strategy, China Association for Science and Technology, Beijing, China.
2School of Social Sciences, Tsinghua University, Beijing, China.
*Corresponding Author: Yinqiu Wang
Abstract
The global mobility of scientific and technological talents is a prominent phenomenon, and many countries all over the world have put a high premium on it in recent years. Therefore, in this paper, we design a quantitative method to measure and evaluate brain gains and brain drains with a group of indicators for countries in the round. Not only considering the amounts of inflow and outflow of talents, we also investigate qualities of global mobility of talents and its effectiveness for origin countries and destination countries. An index named Global Scientific and Technological Talents Mobility Index is constructed on the grouping of 17 indicators into 8 sub--sub--pillars, 4 sub--sub--pillars, 2 pillars and an overall index. Then, a great number of corresponding data and information about the proposed indicators about global mobility of talents was collected and processed. Finally, the values of indicators, sub--sub--pillars, sub--pillars and pillars about global mobility of talents for some selected OECD countries are calculated; hence, comparisons between these countries can be obtained. The effectiveness of the proposed results is discussed and varied.
Keywords:Talent mobility, Indicator system, Scientific and Technological talents, Quantitative analyses.
Introduction
In the field of knowledge economy, scientific and technological progress is the first origin for economic prosperity and social development. And scientific talents, as subjects to promote the national progress of science and technology, have become the most critical driver of national competitiveness and national strength. Scientific and technological talents are key elements for competitions between countries and enterprises. It follows that each country and many multinational companies have attached great importance to recruit best scientific and technological talents from all over the world.
Therefore, during the last decade, international mobility of talents has grown tremendously with the increase in the globalization, the cheap airline tickets and the opening up of world markets. However, knowing exactly where to find them and how to measure and evaluate global talent mobility between countries can sometimes prove difficult. With this in mind, some governments need for the research on the global mobility of scientific and technological talents, and the research results can support to making talent policies.
Hence, there exist a great number of papers or reports investigating this topic. For example, the report [1] discussed the dimensions, significance, and policy implications of international flows of human resources in science and technology, and maintained that the international mobility of highly skilled workers was increasing in scale and complexity as more economies participated in research and development, and innovation activity. And in [2], the author analyzed the strategy and policy in talent mobility between China and the world.
In [3], the authors examined the “global war for talent”, the factors that impacted it, and organizations’ responses to it with a comprehensive search of more than 400 contemporary academic and business press articles.
global mobility of scientific talent based on the moving-in and moving-out data and the oversea talent policies of typical countries, and also analyzed the reasons for talent mobility. Moreover, the most famous reference about talent mobility in recent years is [6], which answered several questions about the characteristics of mobile talents, the implications of increased mobility of talents and so on.
In addition, the paper [7] took a fresh look at the topic of international mobility examining talented and highly educated individuals, and it highlighted the potential of “brain circulation” embedded in the greater mobility of graduate students, professionals, information technology experts, entrepreneurs, cultural workers, and others in the world economy.
The paper [8] made a co–citation analysis and detailed the three core areas of the research on foreign science and technology mobility:“ brain circulation”, “brain drain” and “brain gain”. Although the literatures mentioned above study the talent mobility from different aspects, most of the results are obtained based on authors’ empiric and qualitative analysis, hence, these results may be lack of confidence. It follows that many scholars and organizations investigate talent mobility using big data method with quantitative analysis, such as network, data mining, mathematical statistics and system of indicators method. In [9], a kind of Global Talent Competitiveness Index (GTCI) was established, and the corresponding report about the GTCI focused the attention of readers on key dimensions of talent competitiveness that were critical for the ability of countries to chart a sustainable course between economic, social and political imperatives. Also, the focus of the report [10] was on indicators used in statistical measures of the economic and social convergence between immigrants and the native–borns.
That approach posed two sets of issues: how the immigrant population should be defined and to which subset of the population their outcomes should be compared; and how to use indicators to measure migration. Moreover, the paper [11] explored the relationships between international human migration and merchandise trade using a complex–network approach, and results suggested that bilateral trade between any two countries was not only affected by the presence of migrants from either countries, but also by
their relative embeddedness in the complex web of corridors making up the network of international human migration. The authors in [12] studied bilateral trade flows between China and 28 sample countries with the consideration of immigration network. And in [13], the authors examined the impact of immigration on income inequality, and linked the changes in income inequality as measured by the Gini index with immigrant flows into each metropolitan area in the U.S...
An indicator is a variable, based on measurements, representing as accurately as possible and necessary a phenomenon of interest to human beings. And a system of indicators measures distinct components of the system and also provides information about how the individual components work together to produce the overall effect.
The output of a system of indicators is viewed as index. Considering that the advantages of indicators, some literatures employed this method to assess fuzzy events or questions In [14], the Global Innovation Index (GII) was proposed to measure the innovation capacity of nations across the world and presented a comparative analysis to help in understanding the variation in national competencies, and it covered 141 economies around the world and used 79 indicators across a range of themes. The report [15] provided a tool for decision-makers to holistically benchmark national 74 energy systems, and its core were 18 indicators defined across each side of the energy triangle: economic growth and development, environmental sustainability, and energy access and security.
quantitative results are accordance to the qualitative conclusion.
Construction of Global Scientific and Technological Talents Mobility Index
In this section, we introduce a system of indicators to measure the scientific and technological talent mobility and evaluate its implications for countries quantitatively.
The proposed system of indicators focuses on three main issue: the amount and proportions of all kinds of international mobile talents; qualitative aspects of mobile top talents; and the effectiveness of the international mobility of talents. Hence, the framework of the system of indicators is in Table 1.
Table 1: Framework of scientific and technological talent global mobility index
Scientific and Technological Talent Global Mobility Index
Inflow–talents
Amount of inflow–
talents Proportion and situation of inflow–talents
Percentage of inflow–talents in tertiary–educated workforce Percentage of inflow–talents in
immigrates
Percentage of foreign born with tertiary degree in population
Brain gain
Quality of inflow– talents
International students
International tertiary students ratio International graduate students
ratio
Top inflow–talents
Total amount of top inflow–talents Increment of top inflow–talents
Total amount of top returnee talents
Performance of inflow–
talents Percentage of patents invented by inflow–talents
Outflow– talents
Amount of
outflow–talents Proportion and situation of outflow–talents
Percentage of outflow–talents in tertiary–educated workforce Percentage of outflow–talents in
emigrate Brain drain
Quality of outflow–talents
Studying aboard Tertiary students aboard proportion
Top outflow–talents Total amount of top outflow–talents Increment of top outflow–talents Performance of outflow–
talents
Proportion of patents invented by out–talents
The sources and definitions of the above indicators are given in the following.
Percentage of Inflow–talents in Tertiary-educated Workforce (%)
The ratio of the immigrates from 2006 to 2011 with at least tertiary degree to the tertiary-educated workforce of the year 2011 for a given destination country. Sources: OECD, Indicators of Immigrant Integration 2015; International Labour 100 Organization, Key Indicators of the Labour Market (www.oil.org/kilm)
Percentage of Inflow–talents in Immigrates) (%)
The ratio of the immigrates with at least tertiary degree to the total immigrates from 2006 to 2011 for a given destination country.
Sources: OECD Indicators of Immigrant Integration 2015; and Database of Population Division, United Nations.
Percentage of Foreign Born with Tertiary Degree in Population (%)
The ratio of the people foreign born with tertiary in population in 2011. Sources: OECD Indicators of Immigrant Integration 2015.
Brain Gain
A survey conducted by The World Economic Forum gathering information from business leaders about the ability of the country attracts talented people in 2011. According to its source, the value of this indicator is the range from 1 to 7. It is the answer to the question: Does your country attract talented people from aboard? [1=not at all; 7=attracts the best and brightest from around the world] Source: World Economic Forum, Executive Opinion Survey 2011-2012.
International Tertiary Students’ Ratio (%)
International Graduate Students Ratio (%)
The number of graduate students from aboard studying in a given country as a percentage of the total international students in that country in the year of 2011 Source: OECD, Education at a Glance 2012
Total Amount of Top Inflow–talents
The number of top selected talents from all over the world to the destination country in 2011
Source: Web of Sciences, Innography, talents’ CVs and other information about the locations of the selected talents.
Increment of Top Inflow–talents
It refers to the positive variation of the amount of top selected talents from a given country to all over the world between 2010 and 2011. Source:
Web of Sciences, Innography, talents’ CVs and other information about the locations of talents.
Total Amount of top Returnee Talents
The number of top talents returns their homeland after studying or working aboard from 2006 to 2011. Source: Web of Sciences, Innography, talents’ CVs and other information about the locations of talents.
Percentage of Patents Invented by Inflow– talents (%)
The ratio of patents invented by talents foreign born to the total patents in a given destination country in 2011. Source: The patent database under the Patent Cooperation Treaty (PCT) [16].
Percentage of Outflow–talents in Tertiary– educated Workforce (%)
The ratio of the emigrates from 2006 to 2011 with at least tertiary degree to the tertiary– educated work force of the year 2011 for a given original country. Sources: OECD. Indicators of Immigrant Integration 2015; International Labor Organization, Key Indicators of the Labor Market
Percentage of Inflow–talents in Emigrates) (%)
The ratio of the emigrates from 2006 to 2011 with at least tertiary degree to the total emigrates for a given original country. Sources:
OECD. Indicators of Immigrant Integration 2015 and Database of Population Division, United Nations.
Brain drain
A survey conducted by The World Economic Forum gathering information from business leaders about the ability of the country retain talented people in 2011. According to its source, the value of this indicator is the range from 1 to 7. It is the answer to the question: Does your country attract talented people from aboard? [1=the best and brightest leave to pursue opportunities in other countries; 7=the best and brightest stay and pursue opportunities in the countries]. Source: World Economic Forum, Executive Opinion Survey 2011-2012.
Tertiary Students A board Proportion (%)
The ratio of tertiary students studying aboard from a given original country to the total tertiary students in that country in the year of 2011. Source: UNESCO Institute for Statistics, UIS online database; OECD Education at a Glance 2012.
Total Amount of Top Outflow–talents
The number of top talents from the given origin country to all over the world. Source: Web of Sciences, Innography, talents’ CVs and other information about the locations of talents.
Increment of Top Outflow–Talents
It refers to the variation of the amount of top talents from a given country to all over the world between 2010 and 2011. Source: Web of Sciences, Innography, tanlents’ CVs and other information about the locations of talents.
Proportion of Patents Invented by Outflow–Talents (%)
The ratio of patents invented by outflow–talents to the total patents in a given original country in 2011 Source: The patent database under the Patent Cooperation Treaty (PCT) [16].
Overall, the index includes three indices
The inflow talents pillar is the simple average of the first two sub-pillars;
The outflow talents pillar is the simple average of the last two sub-pillars;
The global scientific and technological talents mobility index is the simple average of the two pillars.
Therefore, for a given country, the lager value of the index means that more talents come into the country from all over the world and less talents leave the country, so that the index also reflects that the given country is the talent-highland of the world, and vice versa.
Data Collection and Processing
The absence of detailed and high quality data is the main based to measure and evaluate the global mobility of talents quantitatively. In this section, according to the data needed in the above section, we collected and process two kinds of data. The first kind of data, called macro-data, is about the total amount of all kinds of inflow or outflow talents for countries and the proportion of inflow or outflow talents in specific groups, which is obtained from the reports of some famous international organizations and the corresponding databases, such OECD, World Intellectual Property Organization, the World Bank and so on.
The second kind of data, called micro-data, is about the global mobility of top talents obtained by CV analysis. In this paper, we define top talents as the authors of the top ten highest cited papers according to Web of Sciences, and the top ten inventors of the strongest patents according to the tool-Innography developed by Dialog in ten frontiers of sciences and technologies, that is “Frontier and basic 203 science”, “New energy technology”, “New information technology”, “Advanced material research”, “Development of ocean, space and earth”, “Advanced equipment manufacturing”, “Agriculture and food security, “Resource and environment”, “Modern medicine and frontier biotechnological research” and “Smart city and digital society”.
These fields are obtained from the discussion of many famous scholars based on the trend of science and technology, and the development demand of countries all over the world. More
details about the strongest patent and patent strength have been introduced in [17]. After collecting the data above mentioned, because the sources are different, and different data may have different unit, normalization is needed before data analysis and processing. In this paper, linear function is employed for data normalization, and the normalized method is in the following. For the inflow–talents pillar, we have
Where x is the origin value before normalization, y is the final value after normalization, Max value is the maximum value, and Min value is the minimum value in these collected data. And for outflow–talents pillar, the following reverse normalization was applied.
100,
x Minvalue
y
Maxvalue Minvalue
Hence, it is clear that if the drain brain of a given country is more serious than other countries, its corresponding value of outflow– talents pillar is smaller, and vice versa. And the value of
100
x Minvalue
100
y
Maxvalue Minvalue
Also can represent the overall situation of outflow–talents. Moreover, the ratio
100 ( outflow talents- )
Means whether net talents inflow or net talents outflow for a given country compared to other countries, and this ratio is defined as Indicator of net mobility of talents in this paper. In detail, if the indicator is larger than 1, the country is in the state of net talents outflow; otherwise, the country suffers from net talents outflow.
inf
-low talents
outflow talents
Measurement and Evaluation for Talent Mobility of OECD Countries
choosing these countries is that these are belonged to OECD, therefore, the data and information about the talent mobility is available and confidential. Another reason is that these countries are typical countries for their continents. Then, according to the discussion on the section about data collection, the values of indicators, pillars, sub-pillars and sub-pillars of these five selected countries are in Appendix.
Remark 1 According to Appendix, the values of some indicators, especially the final index for one country is zero, because linear function is employed for data normalization, and this method must result in at least zero value of countries’ scores.
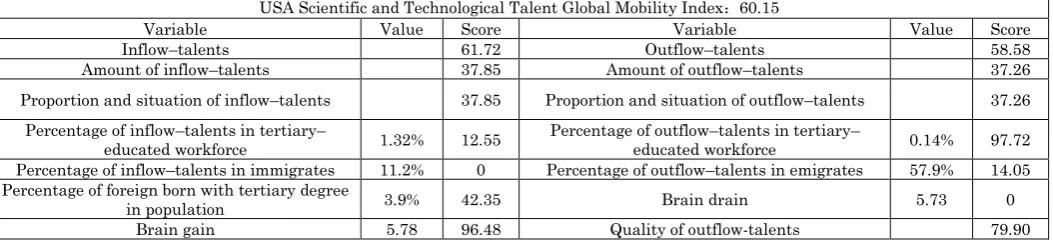
Then, it follows from the indices of the five countries that the score of the USA is the highest in these selected countries, and there exists a gap between this country and other selected countries. After calculation Indicator of net mobility of talents for the USA is 1.49, larger than 1, which means that the country is in the state of net talents outflow. It may be obvious that the USA has gathered a great number of talents from all over the country, and more and more talents from the world are entering to it, which promotes the development of its science and technology greatly. The reason of these results may be that the country can support the best academic research condition and good salaries.
The UK has the fourth highest index in these countries, and Indicator of net mobility of talents is 0.91. The characteristics of the talent mobility of the UK are that although the country suffers from brain drain, many talents enter into it, and these talents also have great effectiveness on its development. And the Indicator of net mobility of talents is smaller than 1, so that the given country is in the state of net outflow–talents in the range of 2006 to 2011.
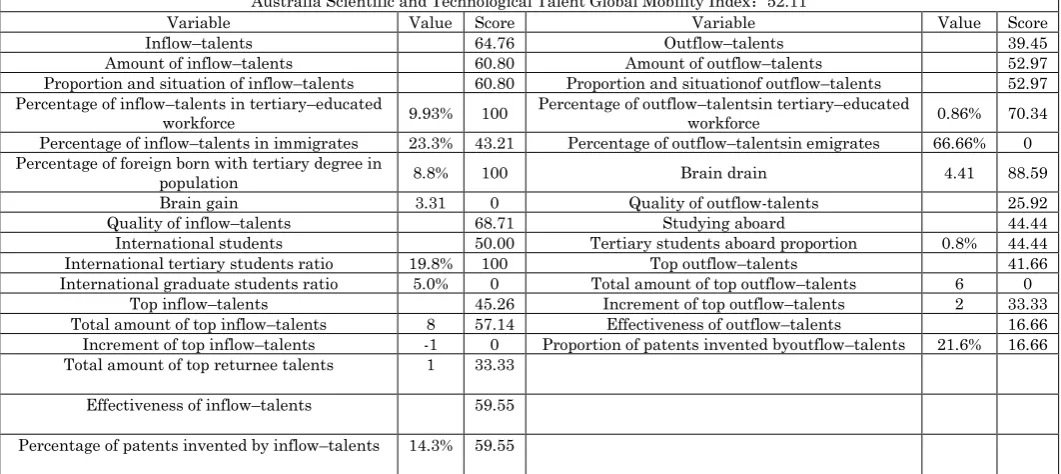
Australia has the second largest of the index, the scores of some indicators are the highest amount these selected countries. The Indicator of net mobility of talents for this country is 1.07. It means that Australia also attracts and gathers some talents in recent years, and considering the population of this country is not very large, the inflow–talents can make a greater influence. The reason of more talents
coming into it may be that the country has good environment and good social security, and the wage level of talents is also very high.
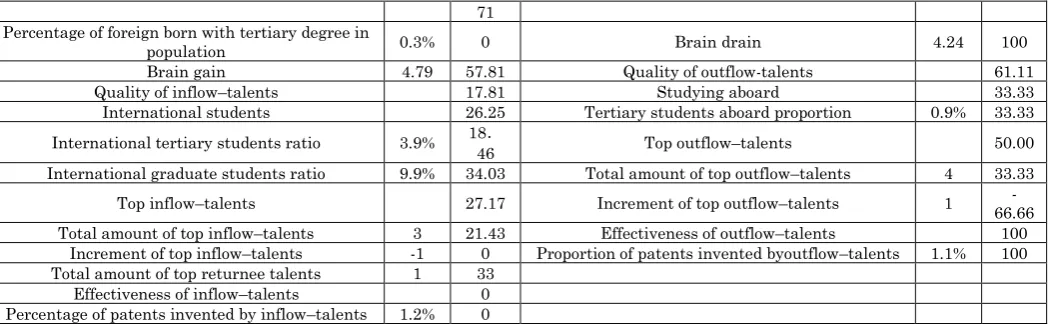
The score of Japan is the third highest, but not far from Australia. The result shows that little amount of talents come into this country, but the number of outflow-talents is not great. Also the Indicator of net talent mobility is 0.85, so that the country is in the state of net outflow talents. The reason may be the country has very different cultures from all over the world, and more local talents have been trained in recent years, so that the effectiveness of inflow–talents and outflow–talents may be limited.
Chile has the lowest score; the Indicator of net talent mobility is 0.65 less than 1, 259 and is the smallest in the selected countries. It follows that it lost many talents, and few talents enter into it. Although the absolute quantities of outflow-talents are not very large, but the population of this country is also the smallest, the effectiveness of brain drain may also be serious.
Therefore, based on the above discussion about the global mobility its effectiveness of scientific and technological talents for the five typical countries in the range of 2006 to 2011, it is known that the proposed index and its corresponding system of indicators can measure and evaluate the talents mobility with quantitative analysis in a whole. And according to the indicators, sub-sub-pillars, sub-pillars and pillars, we can also measure and evaluate many sub-aspects of talents mobility, such top talents and international students. Moreover, the comparisons of talent for some countries can be obtained totally and partially.
Conclusion
In this paper, we have studied the measurement and evaluation of global mobility of scientific and technological talents and its implications for some countries with a kind of quantitative methods–system of indicators. Firstly, a framework of a system of indicators and its corresponding index is designed, and its data source is also introduced.
for these countries is made. The future work should include assigning different weights for different pillars, sub-sub-pillars, sub-pillars and indicators according to the importance of their effectiveness in analyzing international mobility of scientific and technological talents. Moreover, we should also focus on the reasons why these countries have the score, and investigate the attraction of scientific and technological talents
constructing a global scientific and technological talent attraction index.
Acknowledgements
This work was supported by Junior Fellowships of CAST Advanced S&T Think-tank Programs (NO. ZKQN-2016-005 and NO. DXB-ZKQN-2017-010).
References
1. Basri (2008) The global competition for talent:
mobility of the high skilled. OECD.
2. Wang H (2012) China’s competition for global
talents: strategy, policy and recommendations.
3. Beechler S, Woodward IC (2009) The global “war
for talent”. Journal of international
management. 15(3):273–285.
4. Kerr SP, Kerr WR, Ozden C, Parsons CR (2016)
Global Talent Flows. Social Science Electronic Publishing. 30(4):83–106.
5. Wang Y, Luo H, Li Z (2016) New States and
New Features of Scientific Talent Mobility. Global Science, Technology and Economy Outlook. 31(12):30–35.
6. Org Z (2015) Global Mobility of Research
Scientists. Elsevier Monographs.
7. Solimano A (2008) Causes and Consequences of
Talent Mobility. International Mobility of Talent. 1–19.
8. Zhu JW, Yi-Ying LI (2016) The evolution of the
overseas research on science and technology talents mobility. Studies in Science of Science.
9. Lanvin B, Evans P (2016) The Global Talent
Competitiveness Index. INSEAD Business
School, Adecco Group and Human Capital Leadership Institute.
10. OECD (2015) Indicators of Immigrant
Integration Settling In.
11. Fagiolo G, Mastrorillo M (2014) Does human
migration affect international trade? A complex-network perspective. Plos One. 9(5): 97331.
12. Zhao Y (2012) Immigration Network and Trade
Creation Effect. World Economy Study.
13. Hibbs B, Hong G (2015) An examination of the
effect of immigration on income inequality: A Gini index approach. Economics Bulletin. 650– 656.
14. Dutta S (2013) The global innovation index
2013: the local dynamics of innovation.
15. Schwab K (2014) The Global Energy
Architecture Performance Index Report. World Economic Forum.
16. Miguelez E, Fink C (2013) Measuring the
International Mobility of Inventors:A New Database. Wipo Economic Research Working Papers. 21(35):84–104.
17. Narin F, Noma E, Perry R (1987) Patents as
indicators of corporate technological strength. Research policy. 16(2-4):143–155.
Appendix
Following from the proposed global scientific and technological talents mobility index and its pillars, sub-pillars and indicators, we have the following results after normalization for the five selected countries.
Table A-1: Scientific and Technological Talent Global Mobility Index for the USA USA Scientific and Technological Talent Global Mobility Index:60.15
Variable Value Score Variable Value Score
Inflow–talents 61.72 Outflow–talents 58.58
Amount of inflow–talents 37.85 Amount of outflow–talents 37.26
Proportion and situation of inflow–talents 37.85 Proportion and situation of outflow–talents 37.26 Percentage of inflow–talents in tertiary–
educated workforce 1.32% 12.55
Percentage of outflow–talents in tertiary–
educated workforce 0.14% 97.72
Percentage of inflow–talents in immigrates 11.2% 0 Percentage of outflow–talents in emigrates 57.9% 14.05 Percentage of foreign born with tertiary degree
in population 3.9% 42.35 Brain drain 5.73 0
International students 57.59 Tertiary students aboard proportion 0.3% 100
International tertiary students ratio 3.4% 15.90 Top outflow–talents 41.66
International graduate students ratio 19.4% 100 Total amount of top outflow–talents 5 16.67
Top inflow–talents 100 Increment of top outflow–talents 1 66.66
Total amount of top inflow–talents 14 100 Effectiveness of outflow–talents 98.05
Increment of top inflow–talents 2 100 Proportion of patents invented by outflow–talents 1.5% 98.05 Total amount of top returnee talents 3 100
Effectiveness of inflow–talents 100
Percentage of patents invented by inflow–
talents 23.2% 100
Table A-2: Scientific and Technological Talent Global Mobility Index for the UK UK Scientific and Technological Talent Global Mobility Index:46.61
Variable Value Score Variable Value Score
Inflow–talents 68.32 Outflow–talents 24.89
Amount of inflow–talents 67.97 Amount of outflow–talents 31.46
Proportion and situation of inflow–talents 67.97 Proportion and situationof outflow–talents 31.46 Percentage of inflow–talents in tertiary–
educated workforce 1.15% 10.70 Percentage of outflow–talentsin tertiary–educated workforce 1.75% 36.50 Percentage of inflow–talents in immigrates 39.2% 100 Percentage of outflow–talentsin emigrates 59.9% 10.90 Percentage of foreign born with tertiary degree
in population 5.5% 61.18 Brain drain 5.03 46.98
Brain gain 5.87 100 Quality of outflow-talents 18.33
Quality of inflow–talents 68.67 Studying aboard 0
International students 55.85 Tertiary students aboard proportion 1.2% 0
International tertiary students ratio 16.8% 86.42 Top outflow–talents 41.66
International graduate students ratio 8.9% 27.08 Total amount of top outflow–talents 5 16.67
Top inflow–talents 72.90 Increment of top outflow–talents 1 66.66
Total amount of top inflow–talents 12 85.71 Effectiveness of outflow–talents 13.32
Increment of top inflow–talents 2 100 Proportion of patents invented byoutflow–talents 22.5% 13.32
Total amount of top returnee talents 1 33
Effectiveness of inflow–talents 77.27
Percentage of patents invented by inflow–
talents 18.2% 77.27
Table A-3: Scientific and Technological Talent Global Mobility Index for Australia Australia Scientific and Technological Talent Global Mobility Index:52.11
Variable Value Score Variable Value Score
Inflow–talents 64.76 Outflow–talents 39.45
Amount of inflow–talents 60.80 Amount of outflow–talents 52.97
Proportion and situation of inflow–talents 60.80 Proportion and situationof outflow–talents 52.97 Percentage of inflow–talents in tertiary–educated
workforce 9.93% 100 Percentage of outflow–talentsin tertiary–educated workforce 0.86% 70.34 Percentage of inflow–talents in immigrates 23.3% 43.21 Percentage of outflow–talentsin emigrates 66.66% 0 Percentage of foreign born with tertiary degree in
population 8.8% 100 Brain drain 4.41 88.59
Brain gain 3.31 0 Quality of outflow-talents 25.92
Quality of inflow–talents 68.71 Studying aboard 44.44
International students 50.00 Tertiary students aboard proportion 0.8% 44.44
International tertiary students ratio 19.8% 100 Top outflow–talents 41.66
International graduate students ratio 5.0% 0 Total amount of top outflow–talents 6 0
Top inflow–talents 45.26 Increment of top outflow–talents 2 33.33
Total amount of top inflow–talents 8 57.14 Effectiveness of outflow–talents 16.66
Increment of top inflow–talents -1 0 Proportion of patents invented byoutflow–talents 21.6% 16.66 Total amount of top returnee talents 1 33.33
Effectiveness of inflow–talents 59.55
Percentage of patents invented by inflow–talents 14.3% 59.55
Table A-4: Scientific and Technological Talent Global Mobility Index for Japan Japan Scientific and Technological Talent Global Mobility Index:48.19
Variable Value Score Variable Value Score
Inflow–talents 19.97 Outflow–talents 76.40
Amount of inflow–talents 22.13 Amount of outflow–talents 91.69
Proportion and situation of inflow–talents 22.13 Proportion and situationof outflow–talents 91.69 Percentage of inflow–talents in tertiary–educated
Percentage of foreign born with tertiary degree in
population 0.3% 0 Brain drain 4.24 100
Brain gain 4.79 57.81 Quality of outflow-talents 61.11
Quality of inflow–talents 17.81 Studying aboard 33.33
International students 26.25 Tertiary students aboard proportion 0.9% 33.33
International tertiary students ratio 3.9% 18.
46 Top outflow–talents 50.00
International graduate students ratio 9.9% 34.03 Total amount of top outflow–talents 4 33.33
Top inflow–talents 27.17 Increment of top outflow–talents 1 66.66
-Total amount of top inflow–talents 3 21.43 Effectiveness of outflow–talents 100
Increment of top inflow–talents -1 0 Proportion of patents invented byoutflow–talents 1.1% 100 Total amount of top returnee talents 1 33
Effectiveness of inflow–talents 0
Percentage of patents invented by inflow–talents 1.2% 0
Table A-5: Scientific and Technological Talent Global Mobility Index for Chile Chile Scientific and Technological Talent Global Mobility Index:43.54
Variable Value Score Variable Value Score
Inflow–talents 24.20 Outflow–talents 62.84
Amount of inflow–talents 32.28 Amount of outflow–talents 81.24
Proportion and situation of inflow–talents 32.28 Proportion and situationof outflow–talents 81.24 Percentage of inflow–talents in tertiary–educated
workforce 1.43% 13.76
Percentage of outflow–talentsin tertiary–educated
workforce 2.71% 0
Percentage of inflow–talents in immigrates 31.9% 73.93 Percentage of outflow–talentsin emigrates 4.30% 100 Percentage of foreign born with tertiary degree in
population 0.4% 1.18 Brain drain 4.80 62.42
Brain gain 4.34 40.23 Quality of outflow-talents 44.44
Quality of inflow–talents 16.11 Studying aboard 33.33
International students 9.03 Tertiary students aboard proportion 0.9% 33.33
International tertiary students ratio 0.3% 0 Top outflow–talents 100
International graduate students ratio 7.6% 18.06 Total amount of top outflow–talents 0 100
Top inflow–talents 11.11 Increment of top outflow–talents 0 100
Total amount of top inflow–talents 0 0 Effectiveness of outflow–talents 0
Increment of top inflow–talents 0 33.33 Proportion of patents invented byoutflow–talents 25.7% 0 Total amount of top returnee talents 0 0
Effectiveness of inflow–talents 28.18