The Application of Projected Visuals in Teaching
Collocations to Intermediate EFL Learners
Zohre Asgari Rad
ELT Department, Faculty of Persian Literature and Foreign Languages, Roudehen Branch, Islamic Azad University, Roudehen, Iran
Andisheh Saniei
ELT Department, Faculty of Persian Literature and Foreign Languages, Roudehen Branch, Islamic Azad University, Roudehen, Iran
Abstract—The present study is an attempt to investigate the effective of using projected visuals, pictures in the
form of slides displayed through projectors, in teaching English collocations on students’ learning. To this end, 60 Iranian EFL learners were selected out of 90 based on their performance on a language proficiency test, PET, and were assigned randomly into two homogeneous groups of control and experimental. Both groups took a 40-item researcher-made, validated pretest of collocations whose reliability was calculated as 0.74 through KR-21. 130 collocations were presented to each group in ten sessions through ten tables which consisted of 10 to 15 collocations with their L2 definitions and L1 (Persian) equivalents. The control group was required to make sentences, including the newly instructed collocations following the examples provided by the instructor, while the experimental group was shown a set of slides related to the newly-instructed collocations and was asked to determine the intended collocation related to each picture. After receiving ten treatment sessions, both groups took the posttest. The collected data were analyzed through ANCOVA and the results indicated that the experimental group significantly outperformed the control group. Therefore, the use of visuals as instructional aids in teaching English collocations is proved helpful and recommended to those EFL instructors who are seeking for enhancing their students’ learning through more effective materials.
Index Terms—English collocations, projected visuals, teaching aids, collocation teaching and learning
I. INTRODUCTION
Learning language has been occurred significantly through words and co-occurrence of words, namely collocations. In the existing literature, collocations are defined as the tendency of one word to co-occur with one or several other words in a particular domain so as to give a specific meaning (Hsu, 2007; Nation, 2001; Nesselhauf, 2003). The significance of collocations for communicative competence and the evolution of L2 vocabulary have been highlighted by a number of researchers (Benson, 1985; Cowie, 1994; Lewis, 1997) who commented on how to teach the non-native speakers English collocations. The collocation knowledge as an essential part of native speakers’ competence makes learner creative in producing or processing language fluently (Forquera, 2006; Hsu & Chiu, 2008; Nation, 2001; Schmitt, 2000) and helps them “think more quickly and communicate more efficiently” (Hill, 2000, p. 54). In fact, one central feature of language production which can make a difference between a native and a non-native speaker is the use of collocations (McCarty, 1990; Nation,2001; Wouden, 1997), and the improved knowledge of collocations could help learners be informed of language chunks and muli-word items used by native speakers (Narmvar, 2012).
Despite the major role of collocations in second language learning and teaching, many researchers have specified that collocation learning/teaching is still one problematic area in second language acquisition (Bahns & Eldaw, 1993; Millar, 2005; Taiwo, 2004; Walsh, 2005). Similarly, Aghbar’s studies (1990) have shown that the lack of learners’ collocation knowledge causes their poor performances of the second language. With no exception, Iranian learners who learn English in an EFL context have similar problems in using collocations despite having the required knowledge of grammar and vocabulary.
1990). Visuals can be prepared in various styles and formats so as to make learners more interested in what are being presented to them. Perhaps this is why Koren (1997) claims that learning foreign words becomes easier through pictures.
Considering the need for language teachers to equip their teaching with more interesting techniques and with respect to the fact that no study has been conducted so far to evaluate the result of using visuals in collocation teaching and learning in an EFL context, the researchers of the current study attempted to investigate the application of visuals as teaching aids in enhancing learners’ knowledge of collocations. In other words, the present study aims to explore the effect of collocation instruction with the aid of projected visuals on Iranian Intermediate EFL learners’ achievement of collocations.
II. RESEARCH QUESTION AND HYPOTHESIS
In order to achieve the purpose of this study, the following research question was proposed:
Does applying visuals as teaching aids have any significant impact on EFL learners’ achievement of collocations? Based on the raised research question, the following null hypothesis was formulated:
Applying visuals as teaching aids does not have any significant impact on EFL learners’ achievement of collocations.
III. METHOD
A. Participants
SixtyIranian female learners at intermediate level within the age range of 16 to 21 who were studying English in a language institute in Tehran were the participants of this study. They were selected out of 90 based on their performance on a language proficiency test, PET, and then were randomly assigned into two 30-member homogeneous groups, namely experimental and control groups. The homogeneity of the study groups was determined through an independent samples T-test.
B. Instrumentation
In order to test the hypothesis of the present study, two sets of tests were used for data collection: (a) Preliminary English Test (PET), and (b) a researcher-made pre/posttest of English collocations. Besides, 130 slides were developed by the researcher based on the content of the instruction to be used in the experimental group. Moreover, ten tables which contained the intended collocations to be instructed in each session were provided by the researchers to be used in 10 treatment sessions. The collocations were selected from the book ‘Cambridge English Collocations in Use’ written by McCarthy and O’Dell (2005) in order to be used in both study groups.
1. Preliminary English Test (PET)
The Preliminary English Test (PET) was given to 90 students out of whom 60 within the range of one standard deviation above and below the mean were selected. It is worth mentioning here that for the ease of administration and ease of scoring, the speaking and writing sections were excluded in the present study. Then, the reliability of the 60-item test, including reading and listening sections, was calculated through KR-21.
2. Pretest/Posttest of Collocations
A 40-item researcher-made test of English collocations was designed by the researcher to assess the participants’ achievement of collocations presented in their course. The test was used as both pre- and post-test and was piloted on 20 EFL learners who were almost at the same level of the main subjects of this study. Two experienced university professors were consulted for confirming the content validity of the test, and the reliability of the test was also calculated as 0.74 through KR-21.
3. Pictures
Pictures of the collocations that were instructed in each session were presented to the experimental group. The pictures were extracted from internet and some of them were modified by the researchers through drawing and painting to give learners a better perception of the intended collocations. The pictures were further developed in the form of slides to be displayed through a projector.
C. Procedure of the Study
The following steps were followed in order to conduct the present study:
The preliminary step was related to piloting the instruments, PET and the pre/posttest of English collocations, by giving them to 20 students who were similar to the participants of the study. The reliability of the two tests was calculated at this stage.
130 collocations from the book ‘Cambridge English Collocations in Use’ were selected and placed in ten tables. Each table included 11 to 15 collocations followed by their definitions and L1 (Persian) equivalents. The tables were presented to both groups in 10 sessions and each session lasted for 90 minutes. The students in the control group received one table each session and were asked to read aloud and have several repetitions of each collocation in the table as well as their definitions following their instructor. After that, the instructor helped them in making sentences for each collocation.
The experimental group also received the same tables followed by the presentation of a set of pictures related to the same collocations represented by each table. The students were given turn to state the collocation related to the displayed picture and in case of providing the wrong answer, the other students were asked to participate. The instructor (one of the researchers) also helped them if they were unable to produce the correct answer.
At the end of the 10-session treatment, the participants received the posttest of collocations. The aim was to determine whether or not there was a significant difference between the study groups’ achievement of collocations. The results of the statistical analyses are represented in what follows.
IV. RESULTS AND DISCUSSION
The collected data were analyzed through independent samples t-test and analysis of covariance (ANCOVA) which has two common assumptions; homogeneity of variances of the groups and normality. The ANCOVA has two more specific assumptions; homogeneity of regression slopes and linear relationship between the dependent variable and the covariate. Except for the assumption of normality, the other three assumptions will be discussed when reporting the main results. The assumption of normality – as displayed in Table 1 – was met. The ratios of skewness and kurtosis over their standard errors were lower than +/- 1.96. It should be noted that skewness refers to the symmetry of the distribution of the data. The skewness is zero in a perfectly normal set data. The data said to be skewed when data points begin to pile up on either side of the distribution.
TABLE 1
TESTING NORMALITY ASSUMPTION
Group
N Skewness Kurtosis
Statistic Statistic Std. Error Ratio Statistic Std. Error Ratio
Control
PET 30 .687 .427 1.61 1.053 .833 1.26 Pretest 30 -.235 .427 -0.55 -.396 .833 -0.48 Posttest 30 -.227 .427 -0.53 -.838 .833 -1.01
Experimental
PET 30 -.035 .427 -0.08 -.154 .833 -0.18 Pretest 30 .206 .427 0.48 -.395 .833 -0.47 Posttest 30 .386 .427 0.90 -.866 .833 -1.04
It should be noted that kurtosis refers to the relative height of the distribution of the data and is zero in a perfectly normal set data.
A. The Results of PET Analysis
The PET general language proficiency test was administered to 90 subjects in order to select 60 cases for the main study. Based on the mean (M = 34.99) plus and minus one standard deviation (SD = 9.87), 60 subjects were selected and divided into two groups (See Table 2).
TABLE 2
DESCRIPTIVE STATISTICS;SAMPLE SELECTION THROUGH PETGENERAL LANGUAGE PROFICIENCY
N Mean Std. Deviation Variance
PET 90 34.99 9.87 97.51
An independent samples t-test was run to compare the experimental and control groups’ means on the PET in order to prove that the study groups were homogenous in terms of their general language proficiency. As shown in Table 3, the experimental (M = 34.03, SD = 5.28) and control (M = 32.20, SD = 5.51) groups had almost the same means on the PET.
TABLE 3
DESCRIPTIVE STATISTICS;PET BY GROUPS
Groups N Mean Std. Deviation Std. Error Mean
PET Experimental 30 34.03 5.288 .965 Control 30 32.20 5.511 1.006
TABLE 4
INDEPENDENT SAMPLES TEST;PETTEST BY GROUPS
Levene's Test for Equality of
Variances t-test for Equality of Means
F Sig. T df Sig. (2-tailed)
Mean Difference
Std. Error Difference
95% Confidence Interval of the Difference
Lower Upper
Equal variances
assumed .004 .948 1.315 58 .194 1.833 1.394 -.958 4.625 Equal variances not
assumed 1.315 57.901 .194 1.833 1.394 -.958 4.625
Note. The negative lower bound of 95 % confidence interval of -.958 indicated that the difference between the two groups’ means on the PET might have been zero. That is to say, the above mentioned conclusion as no significant difference between the two groups’ general language proficiency was
correctly made.
The assumption of homogeneity of variances was met (F = .004, p = .948) (Table 4). This is why the first row of Table 4 (Equal variances assumed) was reported.
B. Testing the Null Hypothesis
The null-hypothesis posed in this study was analyzed using a one-way ANCOVA with respect to (a) one independent variable which represents the two groups, i.e. experimental and control, participating in this study; (b) one dependent variable, the results of the posttest of collocation, which was administered at the end of the treatment; and finally, (c) one covariate, i.e. pretest of collocation, which was measured at the outset of the study.
The aim of ANCOVA was to compare the experimental and control groups’ mean scores on the posttest of collocation while controlling for the possible effects of their entry collocation knowledge as measured through the pretest (covariate). Before discussing the results of ANCOVA it should be mentioned that the assumptions of homogeneity of variances of the groups, homogeneity of regression slopes, and linear relationship between the dependent variable and the covariate were met. As displayed in Table 5, the results of the Levene’s test were non-significant (F (1, 58) = 1.77, p = .188) indicating that there was not any non-significant difference between the two groups’ variances; hence homogeneity of variances assumption was met.
TABLE 5
LEVENE'S TEST OF EQUALITY OF ERROR VARIANCES
F df1 df2 Sig. 1.777 1 58 .188
The results of the Linearity Test (Table 7) (F (1, 46) = 81.31, p = .000) also indicated that the null-hypothesis that the assumption of linearity, the relationship between the dependent variable and the covariate was non-linear, was rejected. In other words, there was a linear relationship between the pretest and posttest of collocation.
TABLE 6
LINEARITY TABLE;PRETEST AND POSTTEST OF COLLOCATION
Sum of Squares df Mean Square F Sig.
Posttest * Pretest
Between Groups
(Combined) 1416.683 20 70.834 5.152 .000 Linearity 1117.951 1 1117.951 81.318 .000 Deviation from Linearity 298.732 19 15.723 1.144 .350
Within Groups 536.167 39 13.748
Total 1952.850 59
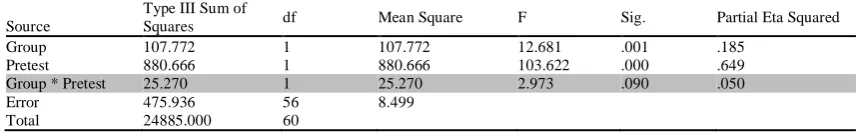
And finally, the assumption of homogeneity of regression slopes which was probed through the non-significant interaction between the independent variable and the covariate was also met. As displayed in Table 7, there was a non-significant interaction between groups and the pretest of collocation (F (1, 56) = 2.97, p = .090, Partial η2 = .050 representing a weak effect size).
TABLE 7
TESTS OF BETWEEN-SUBJECTS EFFECTS;TESTING HOMOGENEITY OF REGRESSION SLOPES
Source
Type III Sum of
Squares df Mean Square F Sig. Partial Eta Squared
Group 107.772 1 107.772 12.681 .001 .185
Pretest 880.666 1 880.666 103.622 .000 .649
Group * Pretest 25.270 1 25.270 2.973 .090 .050
Error 475.936 56 8.499
Total 24885.000 60
TABLE 8
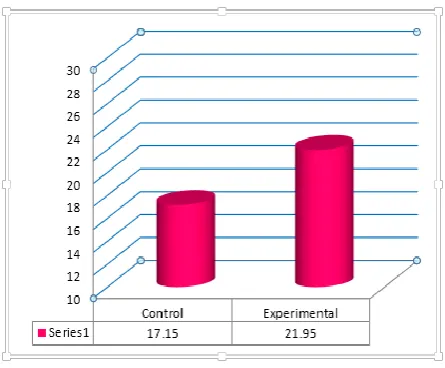
DESCRIPTIVE STATISTICS;POSTTEST OF COLLOCATION BY GROUPS BY PRETEST
Group Mean Std. Error
95% Confidence Interval Lower Bound Upper Bound Control 17.150a .546 16.057 18.244 Experimental 21.950a .546 20.856 23.043
a. The mean values were recalculated after removing the effects of the pretest
As Table 9 shows, the results of ANCOVA (F (1, 57) = 37.94, p = .000, Partial η2 = .400 representing a large effect size) indicate that the experimental group significantly outperformed the control group on the posttest of collocation after controlling for the effects of the pretest. Thus the null-hypothesis was rejected.
TABLE 9
TESTS OF BETWEEN-SUBJECTS EFFECTS;POSTTEST OF COLLOCATION BY GROUPS BY PRETEST
Source
Type III Sum of
Squares df Mean Square F Sig. Partial Eta Squared
Pretest 868.827 1 868.827 98.808 .000 .634
Group 333.692 1 333.692 37.949 .000 .400
Error 501.206 57 8.793
Total 24885.000 60
The below figure also shows the significant difference between the performances of the study groups on the posttest of collocations.
Figure . Study Groups’ Performance on the Posttest of Collocation
Findings of the present study revealed that teaching collocations with the aid of projected visuals had a significant effect on learners’ knowledge of collocations. The present finding is in line with Hill’s (1990) words stating that “pictures not only bring images of reality, but can also function as a fun element in the class” (p. 1) and that pictures are virtually helpful not only in vocabulary learning, but also in teaching other language components. Wright (1992) also investigated the use of pictures in five different language areas and claimed that employing pictures in teaching vocabulary, collocations, idioms, structure, and functions could be very effective. However, McCarty (1990) argued that pictures may not be appropriate for demonstrating the meaning of all words, and Thornberry (2004) also states that illustrating abstract concepts are not always easy through visuals.
V. CONCLUSION,IMPLICATIONS, AND SUGGESTIONS
The results of data analysis revealed that the experimental group outperformed the control group; consequently, the application of the projected visuals as teaching aids seems to be significantly effective in improving learner’s achievement of collocations. In other words, visuals could be used as an effective technique to attract the students’ motivation in learning collocations and perhaps other language components, as well as enabling them to learn and recall them more easily.
The following suggestions for further investigations have also been offered:
1. The participants of this study were all at intermediate level. Similar research could be carried out at other proficiency levels to find out whether this variable, general proficiency, has any significant effect on the outcome of the study.
2. The present study investigated the application of projected visuals on the development of the second language collocations. Future studies may be required to investigate the impact of visual aids on the learners’ knowledge of lexical items or other language skills or components.
3. And finally, the age and gender of the participants were not taken into consideration in this study. A similar research could be replicated in which the influence of these two variables is also investigated.
REFERENCES
[1] Aghbar, A.A. (1990). Fixed expressions in written texts: Implications for assessing writing sophistication. Paper presented at a Meeting of the English Association of Pennsylvania State System Universities, October, 1990.
[2] Bahns, J., & Eldaw, M. (1993). Should we teach EFL students collocations? System, 21(1), 101-114.
[3] Benson, M. (1985). Collocations and idioms. In R. Ilson (Ed.), Dictionaries, lexicography and language learning (pp. 61-68). Oxford: Pergamon Press Ltd.
[4] Cowie, A. P. (1994). The treatment of collocations and idioms in learners’ dictionaries. Applied Linguistics, 2(3),223-235. [5] Forquera, D. (2006). Goodbye foreign flavour: The hows and whys of teaching collocation. Paper presented at the Second
National Meeting of Teacher Training Colleges. Retrieved June 2015from http://www.danielaforquera /docs/Hanodut.pdf. [6] Hill, D. A. (1990). Visual Impact: Creative language learning through pictures. Essex: Longman Group UK Limited.
[7] Hill, J. (2000). Revising priorities: From grammatical failure to collocation success. In M. Lewis (Ed.), Teaching collocation:
Further developments in the lexical approach (pp. 47- 69). London, U.K.: Language Teaching Publications.
[8] Hsu, J. (2007). Lexical Collocations and Their Relation to the Online Writing of Taiwanese College English Majors and Non-English Majors. Electronic Journal of Foreign Language Teaching, 4 (2), 192-209.
[9] Hsu, J-Y., & Chiu, C.-Y. (2008). Lexical collocations and their relation to speaking proficiency of college EFL learners in Taiwan. Asian EFL Journal, Retrieved July 2015, from http://www.asian-efl-journal.com/March 08_jth.php.
[10] Koren, S. (1997). Quality versus convenience: Comparison of modern dictionaries from the researcher's, teacher's and learner's points of view. TESL-EJ, 2(3), 1-16.
[11] Lewis, M. (1997). Implementing the lexical approach. Putting theory into practice. Hove: Language Teaching Publications. [12] McCarthy, M. (1990). Vocabulary. Oxford: Oxford University Press.
[13] McCarthy, M., & O’Dell, F. (2005). English collocations in use. Cambridge: Cambridge University Press.
[14] Millar, N. (2005). The Processing Demands on Non-Native-Like Learner Collocations on Native Speakers. Retrieved June 2015from http://www.lancs.ac.uk/ postgrad/millarn/Files/ Background%20to%20study.pdf.
[15] Namvar, F. (2012). The relationship between language proficiency and use of collocation by Iranian EFL students. The
Southeast Asian Journal of English Language Studies, 18(3), 41– 2.
[16] Nation, I. S. P. (2001). Learning Vocabulary in Another Language. Cambridge, UK: Cambridge University Press. [17] Nesselhauf, N. (2003). Collocations in a Learner Corpus. Amsterdam, Netherlands: John Benjamins.
[18] Schmitt, N. (2000). Vocabulary in language teaching. Cambridge, UK: Cambridge University Press.
[19] Taiwo, R. (2004). Helping ESL Learners to Minimize Collocation Errors. The Internet TESL Journal, 10 (4). doi:10.1076/call.16.1.83.15528.
[20] Thornberry, S. (2004). How to teach vocabulary. Longman: Pearson Education Ltd.
[21] Walsh, M. (2005). Collocation and the learner of English. Retrieved July 2015 from
http://www.cels.bham.ac.uk/resources/essays/WalshLexis.pdf.
[22] Wouden, T.V. (1997). Negative contexts: Collection, polarity, and multiple negations. New York: Routledge. [23] Wright, A. (1992). Pictures for Language Learning. Cambridge: Cambridge University Press.
Zohre Asgari Rad is MA Graduate in TEFL at Islamic Azad University. She got her B.A. in English Literature from Isfahan University, Iran. She has been a high school teacher and an instructor at some English institutes in Tehran, Iran. Her areas of interest include SLA, Curriculum Evaluation, and Methodology.