EXAMINATION OF THE BRCA1-DEPENDENT DNA REPAIR PATHWAY IN BASAL-LIKE BREAST CANCERS
Hann-Hsiang Chao
A dissertation submitted to the faculty of the University of North Carolina at Chapel Hill in partial fulfillment of the requirements for the degree of Doctor of
Philosophy in the Curriculum in Genetics and Molecular Biology
Chapel Hill 2012
ABSTRACT
HANN-HSIANG CHAO: Examination of the BRCA1-Dependent DNA Repair Pathway in Basal-like Breast Cancer
(Under the direction of Dr. Charles Perou)
Human breast cancer is a diverse disease, exhibiting variety in morphology, natural history, and therapeutic response. Multiple studies have shown that breast tumors can be segregated into distinct subtypes, characterized by similarities in the genes they express. One subtype, called basal-like breast tumors (BBT), represents 10-20% of breast cancer diagnoses and is typically associated with poor outcomes. Our work has shown that BBT occurs with significantly higher frequency in women with germline mutations in breast cancer 1 (BRCA1). Given the link between BRCA1-germline mutations and BBT, we proposed to determine whether the
BRCA1-dependent DNA repair pathway is deficient during sporadic BBT formation. Our initial step was to identify BBT specific regions of aberration and
determine if they affected important genetic pathways. One region located on chromosome 5q contained multiple BRCA1-dependent repair pathway genes. These genes exhibited frequent co-associated loss with each other and with other cancer relevant genes. Exogenous disruption of these genes in normal breast epithelial cell lines increased sensitivity to DNA damage and impaired BRCA1 localization and function.
aberrations. These small-scale genomic changes (<5kb in some cases) are detectable using a high-resolution tiling array. We found these events were functional, relevant for survival, preferentially located in the promoter regions of cell cycle genes, and appear most frequently in BBT.
Lastly, we examined BBT-specific loss of the tumor suppressor INPP4B. We found that DNA, RNA, and protein expression of INPP4B are highly correlated with BBT and that it functions as an excellent marker of this subtype as well as predicting survival and response to therapy.
ACKNOWLEDGEMENTS
The work described herein was achieved with the help and encouragement of several people. I would like to thank my advisor, Charles Perou, for providing an ideal learning environment for my graduate training and teaching me the skills to independently design, perform, and critically analyze rigorous scientific
experiments.
I also would like to thank the members of my thesis committee: William Kaufmann, Kim Rathmell, Kristy Richards, and Melissa Troester. Each person has been instrumental in guiding my graduate training and providing their unique expertise and a wealth of scientific knowledge.
The members of the Perou Lab, both past and present, also greatly enriched my training, and made it a pleasure to come to lab every day. In particular, I want to thank Aaron Thorner, Xiaping He, and Katherine Hoadley for their instrumental assistance at key points of my training.
TABLE OF CONTENTS
LIST OF TABLES………… ... x
LIST OF FIGURES. ………xi
LIST OF ABBREVIATIONS ... xiii
CHAPTER ONE: INTRODUCTION……… ... 1
1.1 General Introduction ... 1
Background ... 1
Normal Breast Development ... 2
1.2 Breast Cancer Molecular Subtypes and Outcome ... 4
Overview ... 4
Estrogen Receptor-Positive Subtypes ... 4
Estrogen Receptor-Negative Subtypes ... 5
Basal-like Breast Tumors ... 6
1.3 Genetic Changes in Breast Cancer ... 8
Patterns of Genomic Instability in Breast Cancer Subtypes ... 8
Basal-like Breast Tumor Genomic Alterations ... 9
1.4 The Role of BRCA1 in Breast Cancer ... 12
BRCA1 Function and Association with Basal-like Breast cancer ...12
BRCA1 DNA Repair Pathway ...12
1.6 Figures and Legends ... 16
CHAPTER TWO: BASAL-LIKE BREAST CANCER DNA COPY NUMBER LOSSES IDENTIFY GENES INVOLVED IN GENOMIC INSTABILITY, RESPONSE TO THERAPY, AND PATIENT SURVIVAL ... 28
2.1 Introduction ... 28
2.2 Results and Discussion ... 31
Identifying Subtype-Specific Regions of Copy Number Aberration ...31
Increased Genomic Instability of Tumors Associated with Loss of Specific Regions/Genes ...33
Low Expression of Genes Residing in Basal-like Regions Correlates with Poor Survival and Predicts Therapeutic Response ...34
Knockdown of RAD17 +/- RAD50 Affects Sensitivity to Chemotherapeutics and BRCA1 Foci Formation ...35
Discussion ...37
Conclusions ...40
2.3 Materials and Methods ... 42
2.4 Acknowledgements ... 50
2.5 Figures and Legends ... 51
CHAPTER THREE: MICRO-SCALE GENOMIC COPY NUMBER ABERRATIONS .. AS ANOTHER MEANS OF MUTAGENESIS IN BREAST .. CANCER ... 81
3.1 Introduction ... 81
3.2 Results and Discussion ... 84
Copy Number Micro-aberrations are Present in Breast Tumor Subtypes ...84
Copy Number Status Correlated with Expression ...86
Genomic Micro-amplification Causes Exon Skipping ...87
Micro-aberration Frequency Associated with Poorer Survival ...88
Cell Cycle Genes are Frequently Micro-aberrant ...89
Discussion ...89
Conclusions ...93
3.3 Materials and Methods ... 94
3.4 Acknowledgements ... 97
3.5 Figures and Legends ... 98
CHAPTER FOUR: INPP4B IS A PUTATIVE IDENTIFYING AND PROGNOSTIC .MARKER OF BASAL-LIKE BREAST TUMORS ... 127
4.1 Introduction ... 127
4.2 Results ... 131
4.3 Discussion and Ongoing Studies ... 134
4.4 Materials and Methods ... 138
4.5 Figures and Legends ... 140
CHAPTER FIVE: DISCUSSION ... 158
5.1 Summary of Findings ... 158
Basal-like Breast Cancer DNA Copy Number Losses Identify Genes Involved in Genomic Instability, Response to Therapy and Patient Survival ... 159
Micro-scale Genomic Copy Number Aberrations as Another Means of Mutagenesis in Breast Cancer ... 160
INPP4B is a Putative Identifying and Prognostic Marker of Basal-like Breast Tumors ... 160
5.2 Clinical Relevance ... 162
Breast Cancer Burden in the United States and North Carolina ... 162
Improving Ability to Differentiate Basal-like Breast Cancer ... 164
5.3 Long-term Directions ... 165
Identify Other Subtype-specific Markers with New Datasets and Tools ... 165
Continued Analysis of Basal-like Specific Targets ... 166
Identify Importance of Other Subtype-specific Regions of Aberration ... 167
5.4 Concluding Remarks ... 168
LIST OF TABLES
Table 2.1: Frequency of copy number alterations data for the UNC-Norway
combined dataset. ... 63
Table 2.2: Frequency of copy number alterations data for the Jonsson dataset. ... 65
Table 2.3: Comparison of Jonsson et al. copy number based classifications versus intrinsic subtypes. ... 67
Table 2.4: Examination of possible correlations between the specific CNA and overall genomic instability. ... 69
Supplementary Table 2.1: List of the subtype-specific regions of aberration after ……… multiple hypothesis correction, organized by subtype. ... 75
Table 3.1: Copy number micro-aberrations by subtype. ... 112
Table 3.2: RB1 Copy Number Status on 49 samples from the tiling array and 109k platforms. ... 114
Table 3.3: Percentage of genes exhibiting each class of micro-aberration with concordant gene expression. ... 116
Table 3.4: Listing of frequently micro-aberrant genes and pathway enrichment. .. 118
Supplementary Table 3.1: Gene list and tiling array coverage and analysis ………. windows ... 120
Supplementary Table 3.2: SWITCHdna segment size distribution. ... 125
Table 4.1: INPP4B IHC Score by Subtype... 150
Table 4.2: INPP4B Copy Number State by IHC Score. ... 152
Table 4.3: SPECS TMA INPP4B IHC Staining by Subtype... 154
LIST OF FIGURES
Figure 1.1: Normal, human mammary gland stained for identifying markers. ... 16
Figure 1.2: Hierarchical clustering of human breast tumors. ... 18
Figure 1.3: Kaplan-Meier plot depicting overall survival for each subtype. ... 20
Figure 1.4: Genomic landscapes of each breast cancer subtype. ... 22
Figure 1.5: PARP inhibitor ABT-888 sensitivity in basal-like cell lines. ... 24
Figure 1.6: Expression of genes in the BRCA1/DNA repair pathway in basal-like .breast cancer. ... 26
Figure 2.1: Copy number frequency plots from SWITCHdna show regions of aberrations shared by members of the same subtype. ... 51
Figure 2.2: Numerous genes in the UNC-Norway dataset have low gene .expression associated with DNA copy number loss. ... 53
Figure 2.3: ANOVA boxplots for individual genes that are commonly lost in Basal-like cancers according to intrinsic subtype determined using the UNC337 sample set. ... 55
Figure 2.4: Survival analysis according to expression of RAD17+RAD50 and INPP4B. ... 57
Figure 2.5: RNAi knockdown experiments in an immortalized HMEC (BABE cell line). ... 59
Figure 2.6: BRCA1-mediated DNA repair foci formation assay. ... 61
Supplementary Figure 2.1: Heatmap of copy number aberration landscape of ……… the UNC-NW tumor training sample set. ... 71
Supplementary Figure 2.2: RNAi knockdown experiments in a second ……….. immortalized HMEC (ME16C). ... 73
Figure 3.1: Selected examples of intra-genic micro-aberrations. ... 98
Figure 3.2: Aberrations and probe locations for the RB1 gene. ... 100
Figure 3.4: The presence of micro-aberrations can result in differential
expression by copy number status... 104
Figure 3.5: A micro-amplification in PTEN in the SUM149 cell line results in lack of exon expression from the site of the aberration onwards. ... 106
Figure 3.6: Frequency that genomic quadrants are affected by micro-aberrations. ... 108
Figure 3.7: Higher levels of micro-aberrations are associated with worse survival outcomes. ... 110
Figure 4.1: PI3K Pathway. ... 140
Figure 4.2: INPP4B IHC Staining Scoring Levels. ... 142
Figure 4.3: INPP4B Expression by INPP4B IHC Score. ... 144
Figure 4.4: INPP4B Expression by pCR Status. ... 146
LIST OF ABBREVIATIONS
aCGH: Array comparative genomic hybridization ANOVA: Analysis of variance
BRCA1: Breast cancer 1, early onset BRCA2: Breast cancer 2, early onset
CK: Cytokeratin
CNA: Copy number aberrations DNA: Deoxyribonucleic acid DSB: DNA Double-Strand break
DWD: Distance weighted discrimination ER: Estrogen receptor alpha
HD-94: High-density tiling array sample set
HER2: v-erb-b2 erythroblastic leukemia viral oncogene homolog 2
HR: Homologous recombination
hTERT: Human telomerase reverse transcriptase IC50: Inhibitory concentration 50%
INPP4B: Inositol polyphosphate-4-phosphatase, type II IHC: Immunohistochemistry
HME-CC: hTERT immortalized human mammary epithelial cell line ME16C: hTERT immortalized human mammary epithelial cell line
mRNA: Messenger RNA
NW: Norway samples OS: Overall survival
PARP: Poly (ADP-ribose) polymerase pCR: Pathologic complete response PI3K: Phosphoinositide 3-kinase PTEN: Phosphatase and tensin homolog RB1: Retinoblastoma 1
RFS: Relapse-free survival
RD: Residual disease
RNA: Ribonucleic acid
SAM: Significance analysis of microarrays SMA: Smooth muscle actin
SNP: Single nucleotide polymorphism
SWITCHdna: Sup Wald Identification of copy CHanges in dna TCGA: The Cancer Genome Atlas
T/FAC: Taxane, fluorouracil, anthracycline, cyclophosphamide TMA: Tissue microarray
UMD: UNC Microarray Database
UNC: University of North Carolina, USA samples UTR: Untranslated region
TP53: Tumor protein p53
CHAPTER ONE
INTRODUCTION
1.1 General Introduction
Background
One class of breast cancer in particular, the basal-like breast tumors (BBT), are currently devoid of targeted therapies due to a lack expression of the three current biomarkers for breast cancer that guide therapy, namely the estrogen receptor, progesterone receptor, and the growth factor receptor HER2/ERBB2. My research is focused on this subtype of breast cancer, specifically identifying regions of genomic instability within these tumors that may identify potential targets to develop for therapy. By expanding our understanding of the factors that lead to the progression of this disease, we hope to identify unique characteristics that can be exploited for both better disease prediction and patient treatment.
Normal Breast Development
In order to understand mammary carcinogenesis, one must first understand the normal development of mammary tissue. Normal human breast tissue is very diverse, with an architecture comprised of many different cell types, that also undergoes dramatic changes in shape, size, and function throughout a woman’s lifetime (Howard and Gusterson 2000; Russo and Russo 2004).This diversity in mammary cells and their constant state of change contributes to the development of different types of breast tumors.
The mammary gland first develops prenatally as rudimentary duct structures that have two layers of epithelial cells, the basement membrane and the stromal layer (Wiseman and Werb 2002). At birth, the infant breast consists of a primitive, blunt-ended, ductal system comprised of one or two inner layers of luminal
hormones, and undergoes differentiation and involution, eventually leaving small tubular structures surrounded by fibroblastic stroma (Anbazhagan et al. 1991).
With the onset of puberty, the rudimentary duct structures elongate and branch, resulting in the terminal duct lobular units, the site of future β-casein
(milk)-producing cells, or “alveolar buds" (Villadsen 2005).There is also a dramatic increase in stromal fat and fibroblastic tissue. Once adulthood is reached, the
mammary gland is comprised of a main lactiferous duct attached to the nipple that branches into 15-25 milk ducts, which further branch into many sub-segmental ducts. Different cell types, luminal and myoepithelial, constitute the gland and these can be distinguished morphologically and through histological stains (Figure 1.1). The gland is constantly influenced by hormones, with each ovulation promoting a small amount of additional budding.
With pregnancy, a massive increase in proliferation and formation of acini in the alveolar buds occurs (Villadsen et al. 2007). After birth, milk is secreted by the alveolar cells, which flows through the ducts to the nipple. Once lactation is
1.2 Breast Cancer Molecular Subtypes and Outcome
Overview
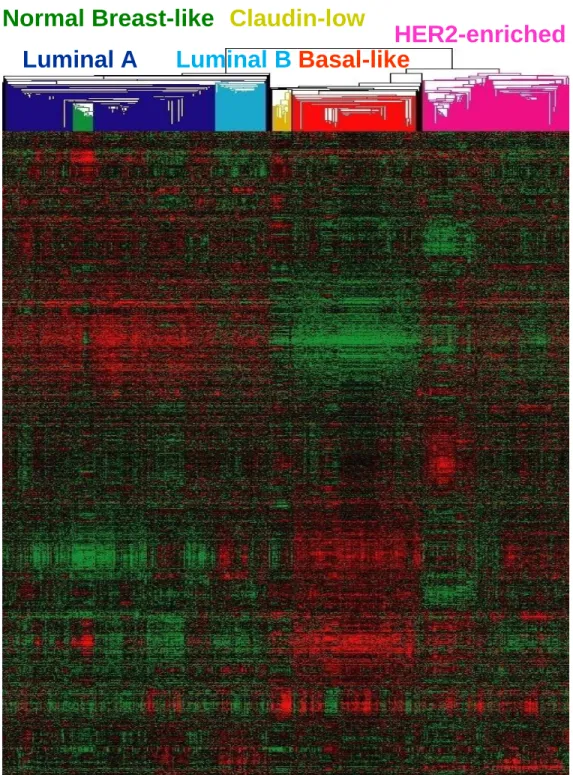
Breast cancer has been shown to be not a single disease, but instead is a very heterogeneous disease with a spectrum of distinct cellular origins, somatic changes, and etiologies. Over the years, clinical decision has expanded beyond factors such as stage, grade, and hormone receptor status to include the use of gene expression predictors as well (Fan et al. 2006). DNA microarray analyses have now shown repeatedly that breast cancer is composed of at least six distinct tumor subtypes, potentially arising from different cell lineages (Prat et al. ; Perou et al. 2000; Sorlie et al. 2001; Sorlie et al. 2003; Hu et al. 2006). These include luminal A, luminal B, normal breast-like, HER2-enriched, claudin-low, and basal-like subtypes. Each subtype has a unique gene expression profile that reflects the biology of the breast tumor and also predicts patient clinical outcomes (Figure 1.2 and Figure 1.3). Estrogen Receptor-Positive Subtypes
The majority of breast cancer patients (60-80%) present with
luminal A tumors through the “proliferation” signature (Perou et al. 1999; Whitfield et al. 2002), which is high in LumB tumors. The normal breast-like group also
clusters with the ER-positive subtype and has a gene expression signature similar to that of normal breast. This group is usually comprised of true normal breast
samples and a few tumors, and studies suggest that in most cases this classification is due to a high amount of contaminating normal breast tissue (Hu et al. 2006). Estrogen Receptor-Negative Subtypes
which make these “Triple-Negative” tumors; however, by expression they are a distinct subtype from basal-like breast tumors (Figure 1.2).
Basal-like Breast Tumors
In contrast to the luminal breast tumors are basal-like breast tumors, which are the focus of this work. BBT account for 10-20% of all breast cancers and are often clinically labeled “triple negative”. BBT clearly poses a significant challenge to the US health care system, as evidenced by the fact that if BBT were to be treated as a unique disease separate from other breast cancers, it would represent the fourth leading cause of cancer deaths among women (Carey et al. 2006). These tumors do not express ER-alpha, PR, and HER2, have limited treatment options, and patients typically experience poor outcomes (Sorlie et al. 2001; Sorlie et al. 2003; Nielsen et al. 2004; Paik et al. 2004). They often exhibit high expression of cytokeratins 5 and 17, cell surface markers expressed in normal mammary basal/myoepithelial cells, and a transcriptional signature similar to skin basal epithelial cells. It is believed however, that this tumor type is derived from luminal epithelium and not
which is the opposite of what is observed for luminal A tumors. Lack of
breastfeeding was another risk factor for basal-like breast cancer, suggesting there are protective effects of lactation (Carey et al. 2006). BBT also occurs with
1.3 Genetic Changes in Breast Cancer
Patterns of Genomic Instability in Breast Cancer Subtypes
A hallmark of many human cancers is genomic instability and cancer can be thought of as the result of aneuploidy. Specific patterns of copy number aberrations (CNA) can define genetic events associated with different breast cancer subtypes (Figure 1.4). Array comparative genome hybridization (aCGH) studies of tumor copy number states have demonstrated that tumors with similar gene expression
Basal-like Breast Tumor Genomic Alterations
Nowhere is the case of genomic instability-driven tumorigenesis more prevalent than in the Basal-like subtype, where the majority of its tumor genome exhibits aberrant copy number states (Ding et al. ; Russnes et al. ; Bergamaschi et al. 2006; Chin et al. 2006; Van Loo et al. 2010) (Figure 1.4a). Identifying the genes that contribute to this instability phenotype could be useful not only from a biological perspective, but also possibly as a clinical predictor of response. Previous studies (Loo et al. 2004; Bergamaschi 2006; Chin et al. 2006) have shown that BBT has greater genetic complexity compared to the other breast cancer subtypes (Figure 1.4).
tumors, but all affect the same pathway. This deficiency combined with ambient radiation damage or other mutagenic insults may induce BBT formation. BBT may be particularly prone to chromosomal instability, due to the fact that alterations in DNA repair genes/proteins likely contribute to its formation.
Despite the poor prognosis generally associated with BBTs, they are often initially responsive to chemotherapy treatments (Rouzier et al. 2005; Carey et al. 2007). Our explanation for this sensitivity is the proposed DNA repair deficiency in BBT caused by aberrations in BRCA1 and/or other DNA repair proteins, coupled with their loss of RB and TP53 function (Troester et al. 2006; Herschkowitz et al. 2008). In light of the association with BRCA1, this suggests a possible defect in double strand DNA break repair mechanisms, and some evidence of this is seen in the fact that basal-like tumor cell lines are more susceptible to DNA damaging agents as compared to normal human mammary epithelial cell lines (Figure 1.5).
Analyses using an Illumina SNP microarray platform identified numerous regions of copy number loss that were statistically correlated only with BBT, including 5q11-35, 13q12-34, 14q11-32, 15q11-26, 17q12-23, and the
basal-like subtype (Figure 1.6). It stands to reason that there could be gene-environment interactions in these candidate genes in the form of germline variants associated with susceptibility to BBT. It is our hypothesis that sporadic BBTs do not
necessarily have a defect in BRCA1 itself, but instead they may have a general defect in double strand DNA break repair caused by the sporadic loss of one or more DNA repair pathway genes.
1.4 The Role of BRCA1 in Breast Cancer
BRCA1 Function and Association with Basal-like Breast cancer
As previously mentioned, one clue in identifying BBT causative events was the discovery of an association between BBT and BRCA1 (Sorlie et al. 2003). BRCA1 is an ubiquitous tumor suppressor that has functions in the nucleus in transcription, gene silencing, chromatin remodeling, and several DNA repair mechanisms (Starita and Parvin 2003). It has been shown to be essential for normal development as BRCA1 knockout mice show early embryonic lethality (Brodie and Deng 2001). In addition, BRCA1 is thought to be a guardian of genomic stability because of its involvement in the cellular response pathway to DNA double-strand breaks (DSB) (Venkitaraman 2002). Mouse and human cells deficient for BRCA1 are sensitive to ionizing radiation (IR), indicating a role in DNA DSB repair (Deng and Wang 2003). Surprisingly, although human BRCA1 mutation carriers develop BBT around 80% of the time, the BRCA1 gene/protein is shown to be normal in the great majority of sporadic BBT (>90%) (Richardson et al. 2006) and there is also, at present, no proven correlation between BRCA1 methylation and BBT (Matros et al. 2005; Richardson et al. 2006; Turner et al. 2006). Overall, little conclusive data exists concerning BRCA1-pathway function in sporadic BBT. We hypothesized that defects in other members of the BRCA1-pathway, rather than disruption of BRCA1 itself, may contribute to sporadic BBT formation.
BRCA1 DNA Repair Pathway
RAP80, RAD50, RAD17, RAD51B, and RAD51C (Figure 1.6). RAP80 physically binds to BRCA1 and is required for the localization of BRCA1 to DNA-repair foci (Kim et al. 2007; Sobhian et al. 2007; Wang et al. 2007). RAD50 is part of a BRCA1-associated genome surveillance complex/BASC that is involved in BRCA1-dependent DNA repair (Zhong et al. 1999; Wang et al. 2000). RAD17 is phosphorylated by ATM/ATR in response to DNA damage (Rauen et al. 2000; Bao et al. 2001; Roos-Mattjus et al. 2002; Post et al. 2003). RAD51C is thought to be involved in homologous
recombination mediated repair pathway (HR) of double-strand breaks and is part of a complex of DNA repair proteins (Dosanjh et al. 1998; Miller et al. 2002; French et al. 2003). RAD51B, also known as RAD51L1, is also thought to be involved in HR (Takata et al. 2000; Miller et al. 2002). Furthermore, haplo-insufficiency of RAD51B has been shown to lead to centrosome fragmentation, aneuploidy, and
hypersensitivity to DNA-damaging agents (Takata et al. 2000; Miller et al. 2002; Date et al. 2006), of which the latter two are hallmarks of BBT.
Many studies have been performed focused on the link between BRCA1 and breast cancer, but a broader analysis of the BRCA1 pathway as a whole has
heretofore been lacking. A more far-reaching analysis looking at the component genes within the basal-like subtype may have the ability to uncover findings that have previously been masked either by examining all breast cancers as a
1.5 Research Introduction
This work will examine the contribution of the BRCA1-dependent DNA repair pathway and genomic instability to the initiation and progression of BBT, a breast cancer subtype with poor prognosis. My aim is to elucidate how the response to DNA damage contributes to the formation of some breast cancers and to investigate the role of BRCA1 pathway function in sporadic BBT. In addition, the data
generated will provide information that will aid in the systematic classification of this complex tumor subtype. More broadly, these studies may offer insight into how the interaction between environmental exposures and pre-existing genetic
alterations lead to disease.
Chapter 2 examines basal-like associated copy number events and cell-line functional studies that focus on disrupting two prominent members of the BRCA1-repair pathway in normal cell lines in order to imitate the basal-like tumor genetic environment, and generate a DNA damage sensitizing phenotype. Chapter 3
investigates a novel form of genomic instability that is associated with BBT and may be a hallmark of the defective mechanisms of DNA repair/genomic maintenance in this subtype. Lastly, in Chapter 4, INPP4B, a gene that is frequently and specifically lost in BBT and a key member of the PI3K signaling pathway is evaluated as a contributing factor involved in BBT formation.
There is currently a paucity of effective treatments for BBT, which is a
molecular causes of BBT could be obtained by the eventual generation of mouse models with the same dysregulation events we are investigating. Further characterization of the DNA repair functionality of BBT will increase our
1.6 Figures and Legends
Figure 1.1: Normal, human mammary gland stained for identifying markers.
Figure 1.2: Hierarchical clustering of human breast tumors.
Figure 1.2
Luminal A
Normal Breast-like
Basal-like
HER2-enriched
Luminal B
Figure 1.3: Kaplan-Meier plot depicting overall survival for each subtype.
Figure 1.4: Genomic landscapes of each breast cancer subtype.
Figure 1.5: PARP inhibitor ABT-888 sensitivity in basal-like cell lines.
Figure 1.6: Expression of genes in the BRCA1/DNA repair pathway in
basal-like breast cancer.
Victor J. Weigman*, Hann-Hsiang Chao*, Andrey A. Shabalin, Xiaping He, Joel S. Parker, Silje
CHAPTER TWO
BASAL-LIKE BREAST CANCER DNA COPY NUMBER LOSSES IDENTIFY GENES INVOLVED IN GENOMIC INSTABILITY, RESPONSE TO THERAPY, AND PATIENT
SURVIVAL
2.1 Introduction
Breast cancer is a heterogeneous disease with known expression defined tumor subtypes. DNA copy number studies have suggested that tumors within gene expression subtypes share similar DNA Copy Number Aberrations (CNA) and that CNA can be used to further sub-divide expression classes. To gain further insights into the etiologies of the intrinsic subtypes, we classified tumors according to gene expression subtype and next identified subtype-associated CNA using a novel
method called SWITCHdna, using a training set of 180 tumors and a validation set of 359 tumors. Fisher’s Exact tests, Chi-square approximations, and Wilcoxon rank-sum tests were performed to evaluate differences in CNA by subtype. To assess the functional significance of loss of a specific chromosomal region, individual genes were knocked down by shRNA and drug sensitivity and DNA repair foci assays performed. Most tumor subtypes exhibited specific CNA. The Basal-like subtype was the most distinct with common losses of the regions containing RB1, BRCA1, INPP4B, and the greatest overall genomic instability. One Basal-like subtype
for BRCA1-dependent DNA repair (RAD17, RAD50, and RAP80); these genes were predominantly lost as a pair, or all three simultaneously. Loss of two or three of these genes was associated with significantly increased genomic instability and poor patient survival. RNAi knockdown of RAD17, or RAD17/RAD50, in immortalized human mammary epithelial cell lines caused increased sensitivity to a PARP inhibitor and carboplatin, and inhibited BRCA1 foci formation in response to DNA damage. These data suggest a possible genetic cause for genomic instability in Basal-like breast cancers and a biological rationale for the use of DNA repair inhibitor related therapeutics in this breast cancer subtype.
Previous gene expression profiling studies of human breast tumors have shaped our understanding that breast cancer is not one disease, but is in fact many biologically separate diseases. A classification of tumors by expression profiling into five distinct groups (Luminal A, Luminal B, HER2-enriched, Basal-like, and Claudin-low subtypes) has added prognostic and predictive value to the existing repertoire of biomarkers for breast cancer (Prat et al. ; Perou et al. 2000; Sorlie et al. 2001; Sorlie et al. 2003; Hu et al. 2006; Parker et al. 2009). For many cancers, improper maintenance of genome stability is a major cause of tumorigenesis and thus, the characterization of the tumor genomic DNA landscape is an important avenue of investigation (Pinkel and Albertson 2005). Array comparative genome
sub-divide expression classes (Russnes et al.). In breast cancers, genomic
2.2 Results and Discussion
Identifying Subtype-Specific Regions of Copy Number Aberration
To identify CNA that might be causative of Basal-like breast cancers, we assembled a dataset of 180 tumors with Agilent gene expression microarrays and Illumina 109,000 SNP marker DNA copy number microarrays (UNC-NW). We classified each tumor into one of five previously defined expression subtypes using the published intrinsic subtypes (i.e. PAM50) and Claudin-low subtype predictors (Prat et al. ; Parker et al. 2009). To identify regions of copy number gain/loss, we developed a new segmenting method called “SWITCHdna” (Sup Wald Identification of copy CHanges in dna). Specifics of the SWITCHdna method can be found at https://genome.unc.edu/pubsup/SWITCHdna/.
We next searched for CNA occurring specifically within each subtype (Figure 2.1A-F, black shading). The Basal-like subtype had the most subtype-specific events (Figure 2.1A, G) including the previously described amplicon at 10p containing MAP3K8, ZEB1, and FAM107B (Ding et al. ; Adelaide et al. 2007; Bergamaschi et al. 2008), 16q loss (Haverty et al. 2008), deletion of 5q11-35 (Bergamaschi et al. 2006), and deletion of 4q. This last region contains INPP4B, which has recently been
identified as a potential tumor suppressor involved in the inhibition of PI3K signaling (Gewinner et al. 2009) and that is selectively lost in Basal-like/Triple-negative breast cancers (Fedele et al.).
frequently loss of RB1/13q14.2 (~80%) (Table 2.1E), which are genes/regions that have all been previously shown to be associated with Basal-like Breast Cancers.
In order to validate these subtype-specific findings observed in the UNC+NW dataset, we classified the samples in Jonsson et al. (Jonsson et al.) according to PAM50 and Claudin-low subtype predictors and performed similar supervised analyses using their BAC-based DNA copy number data; very similar associations between CNA and subtypes were observed (Table 2.2). Jonsson et al. identified 6 unique tumor subtypes based upon CNA landscapes, which we determined were highly correlated with our expression defined intrinsic subtypes (p-value < 0.001, Table 2.3); importantly, there was high overlap between our Basal-like subtype and their Basal-Complex phenotype, both of which showed the frequent loss of 5q11-35 and amplification of 10p.
Increased Genomic Instability of Tumors Associated with Loss of Specific Regions/Genes
To objectively assess “genomic instability”, we calculated a loss/normal/gain value for every gene using the SWITCHdna assigned copy number states, and
more segments. The subtypes that had greater numbers of gene aberrations were also the same ones that had more SWITCHdna segments of shorter average length (Table 2.1C). Thus, the increased number of aberrant gene-based events in the copy number unstable subtypes was due to more frequent aberrations in the genome, rather than as a large number of genes gained or lost by a few large-in-size aberration events.
Tumors with loss of PTEN/10q23.31, RB1/13q14.2, or TP53/17p13.1, or amplification of the 10p region were also found to have high rates of total gene-based CNA compared to tumors without loss of these genes (Table 2.4). Loss of 5q11-35 was also associated with the highest numbers of CNA, with the greatest instability seen when all three DNA repair genes were lost.
Low Expression of Genes Residing in Basal-like Regions Correlates with Poor Survival and Predicts Therapeutic Response
To determine if these DNA loss events also impacted gene function, we determined whether the mRNA levels of candidate genes contained within these regions correlated with DNA loss. The expression of 10 genes selected based on their associations with the basal-like subtype, or breast cancer in general, was evaluated. Most of these genes showed significantly lower mRNA expression when the genomic DNA was lost including RAD17, RAD50, RAP80, MSH3, RB1, PTEN,
and RAD50, Figure 2.1H), and it also showed reduced mRNA expression when lost and low expression within Basal-like tumors in general (Figure 2.2, 2.3E). In addition, the mRNA expression levels of RAD17, RAD50, MSH3, RAP80, INPP4B, and PTEN were lowest in the Basal-like subtype (Figure 2.3, UNC337 expression dataset (Prat et al.)); thus loss of 5q11-35 likely affects multiple aspects of DNA repair.
Using patient survival data from two additional data sets containing gene expression data (UNC337 (Prat et al.) and NKI295 (van de Vijver et al. 2002)), Kaplan-Meier analysis showed that the low average expression of RAD17+RAD50 was associated with worse outcomes compared to high expression (Figure 2.4A). A similar trend was observed with INPP4B, mirroring previous observations (Figure 2.4B) (Gewinner et al. 2009). RAD17+RAD50 expression was also examined for treatment effects using the Hess et al. dataset, which examined T/FAC neoadjuvant chemotherapy responsiveness across 130 breast cancer patients (Hess et al. 2006). Low expression of RAD17+RAD50 was correlated with pathological complete response (pCR) (ANOVA p-value <0.0001). This finding may be due to the
association between low expression of RAD17+RAD50 and Basal-like tumors, as Basal-like tumors have also been shown to have high neoadjuvant chemotherapy pCR rates (Rouzier et al. 2005; Carey et al. 2007).
Knockdown of RAD17 +/- RAD50 Affects Sensitivity to Chemotherapeutics and BRCA1 Foci Formation
already been linked to BRCA1 loss like carboplatin/cisplatin (Chang et al. ; Silver et al.) and PARP inhibitors (Huang et al. 2003; Donawho et al. 2007). RAD17 was stably knocked down with shRNA in the HME-CC cell line (an hTERT immortalized Human Mammary Epithelial Cell) (Troester et al. 2004) and knockdown was
confirmed by Western blotting (Figure 2.5A). HME-CC cells with RAD17 knockdown exhibited increased sensitivity to ABT-888 (PARPi) and carboplatin (Figure 2.5C). No difference in paclitaxel sensitivity was observed, which was used as a non-DNA damaging agent control. A RAD50 knockdown line did not exhibit any change in sensitivity to ABT-888 and had a paradoxical increase in resistance to carboplatin. We next emulated the most common in vivo co-occurring loss by generating a double knockdown of RAD17 and RAD50, which showed the greatest increased sensitivity to ABT-888 and carboplatin (Figure 2.5C). Similar results were observed when this experiment was repeated in ME16C cells, a second hTERT-immortalized human mammary epithelial cell line (Supplementary Figure 2.2).
In order to assess the effects of RAD17/RAD50 loss on BRCA1-dependent DNA repair, we performed a DNA repair foci formation assay on the control and RAD17+RAD50 double knockdown line. Using anti-BRCA1 protein
impair BRCA1 function, and could contribute to increased sensitivity to DNA damaging agents.
Discussion
The presence of distinct breast cancer expression subtypes suggests different underlying genetic events may be driving each subtype. To address this hypothesis, we used 180 diverse tumors and performed supervised analyses of their tumor DNA copy number landscape and identified subtype-specific copy number events. Many studies have identified numerous regions of gain and loss in human breast tumors (Jonsson et al. ; Bergamaschi et al. 2006; Chin et al. 2006; Fridlyand et al. 2006; Haverty et al. 2008); however, most did not specifically search for regions uniquely associated with specific intrinsic subtypes. Some previous attempts were made to identify basal-like specific CNA (Bergamaschi et al. 2006; Adelaide et al. 2007) and we observed a number of the same findings. We take these previous findings as validation of our identified regions, and we build and expand upon these here, along with the addition of functional studies.
Overall, we identified many subtype-specific CNA and validated these findings on a second, independent dataset. Here we have focused on the Basal-like subtype, which showed by far the greatest number of subtype specific CNA and were the most genomically unstable as determined by the sheer number of CNA, a feature which has been observed in the past (Chin et al. 2006). Basal-like tumors also showed consistent loss of 4q (which harbors INPP4B and FBXW7), and 5q11-35, which contains many DNA repair genes. Basal-like tumors are known to be
carriers, if and when they develop breast cancer, develop Basal-like tumors (Foulkes et al. 2003; Sorlie et al. 2003; Arnes et al. 2005); however, in most sporadic Basal-like tumors, the BRCA1 gene appears normal in sequence (Richardson et al. 2006). The loss of 5q11-35 may provide an alternative means to impair BRCA1-pathway function and explain why despite many Basal-like patients having normal BRCA1 gene/protein, high levels of genomic instability and a “BRCAness” phenotype are observed in Basal-like tumors. Previous evidence indicates a link between genes involved in BRCA1 DNA damage control and genes that are deleted and
downregulated in Basal-like cancers, lending further credence to our hypothesis (Natrajan et al.).
In order to expand our understanding of the relationship between the Basal-like subtype and impaired BRCA1-pathway function, we pursued functional studies by RNAi mediated knockdown of two members of the pathway, RAD17 and RAD50, in order to emulate the genomic losses observed in tumors. Besides being members of the BRCA1-pathway, others have highlighted these genes for their possible Basal-like association, but without functional studies (Bergamaschi et al. 2006;
Johannsdottir et al. 2006). We show here that genetic ablation of these genes results in impaired DNA repair and increased drug sensitivity, and furthermore, deletion of RAD17 and RAD50 in yeast has also been shown to result in increased sensitivity to DNA-damaging agents including platinum drugs
By building upon the discovery of the subtype association and the deletion phenotypes in yeast, we propose a role in DNA repair function for the 5q11-35 region. The drug sensitivity assays show the importance of these genes in DNA damage sensitivity and the foci formation experiments show that their function is mediated through BRCA1. Additionally, from the combination of our genomic analyses and functional data, it is our hypothesis that the somatic loss of RAD17, RAD50 and/or RAP80 leads to impaired BRCA1-pathway function, impaired homologous recombination mediated DNA repair, and thus, contributes to overall genomic instability.
the genome and that the combinatorial loss of 2-3 of these regions is what results in the genomic instability phenotype seen in Basal-like breast cancers. In this paper, we examine DNA losses, but do note that it is possible that loss of these same genes could also occur via methylation, altered microRNA regulation, and/or somatic mutation, although the latter has yet to be found when searching current somatic mutation databases for RAD17/RAD50/RAP80. Preliminary sequence analysis of RAD17 and RAD50 (data not shown), as well as evaluation of previous breast cancer sequencing efforts (Sjoblom et al. 2006) and the COSMIC database (Bamford et al. 2004), revealed few, if any, somatic variants/mutations in these two genes, which is consistent with the finding that loss of any one gene is rarely seen; thus, if loss of two or more genes is the target of this CNA, then somatic mutation of any one gene would not impart a selective tumorigenic advantage. Therefore, these data suggest that the target of 5q11-35 loss is two or more genes in this region, with loss of RAD17 and RAD50 likely contributing to genomic instability.
Conclusions
The gene expression-defined intrinsic subtypes of breast cancer are mirrored by DNA copy number changes. The Basal-like subtype is the most distinct in the copy number landscape world, and these subtype associated CNA have clinical implications. If 5q11-35 loss results in impaired homologous recombination
inhibitors and cis/carboplatin. Loss of RAD17+RAD50 (mRNA and/or genomic DNA) may thus be a biomarker of chemotherapy responsiveness, which is supported by our finding of an association for predicting a likelihood of achieving a pathological complete response. We hypothesize that the loss of these DNA repair genes and the 5q11-35 region, contributes to genomic instability and mutability, ultimately causing high proliferation rates and aggressive behaviors. Our integrated studies of gene expression and genomic DNA copy number have identified important
pathway-based determinants of Basal-like cancers and a possible therapeutic biomarker.
2.3 Materials and Methods
Breast Cancer Patient Datasets
Three patient datasets were used in this study, each of which contained gene expression and DNA copy number microarray data. We combined 2 sets into a single training set (n=180 with expression and copy number) so that we could have
increased statistical power to detect subtype-specific CNA. The combined training set included one set of breast tumors from the United States (“UNC”) (n=77) and another set of tumors from Norway (“NW”) (n=103). The third data set (“Jonsson”) was used as a validation/testing set (n=359)(Jonsson et al.). All samples were collected using IRB-approved protocols and all patients signed informed consent forms. Tumors in the training set were assayed for gene expression patterns using Agilent DNA microarrays. In total, the UNC gene expression cohort contained 337 human breast tumors (UNC337), taken from Prat et al. 2010 (Prat et al.). Log2 ratio
data was taken from the UNC Microarray Database (UMD), filtering for a lowess normalized intensity value of 10 or above for each channel, and 70% good data, and then used for further analyses. Data is available from Gene Expression Omnibus under series GSE10893
(http://www.ncbi.nlm.nih.gov/geo/query/acc.cgi?token=tdodziqaacgembc&acc=GS E10893). Sample information including clinical data, subtype, source, GEO Sample ID and overlap with copy number information, can be found in the UMD
Infinium Human-1 109K BeadChip (Illumina, San Diego, CA, USA) and results are described here.
The Norway (NW) data set consists of 103 previously published breast tumors assayed on custom Agilent Microarrays for gene expression (GSE3985), and for copy number changes also using Infinium Human-1 109K BeadChip (Naume et al. 2007; Nordgard et al. 2008) (also listed under GEO GSE10893). The Jonsson dataset consists of 359 breast tumors assayed using custom produced
oligonucleotide microarrays for gene expression, BAC microarrays for copy number, and which has been previously published (Jonsson et al.) in GEO series GSE22133. Clinical and gene expression data was also used from an additional dataset, the Netherlands Cancer Institute breast cancer dataset (NKI-295, n=295) (van de Vijver et al. 2002).
Classifying tumors for expression-based subtype classification
The Lowess normalized R/G Log2 ratio data from the UNC337, NW103 and
Jonsson-359, were used and median centered independently within each data set, prior to collapsing (via averaging) from probes to HGNC gene symbols. Datasets were then limited to the gene symbols shared across them. After column
standardization of both datasets (samples at N(0,1)), Distance Weighted
Assessment of tumor genomic DNA copy number changes
77 UNC and 103 NW samples had blood/normal and tumor DNA pairs each assayed using the Infinium Human-1 109K BeadChip (Illumina, San Diego, CA, USA), with an average resolution of 1 probe per 26kb (median of 1 probe per 13kb). Tumor content for each sample was assessed by histology to be greater than 50% tumor tissue. Additionally, tumor cellularity was also assessed genomically by the ASCAT (Van Loo et al. 2010) and genoCNA (Sun et al. 2009) algorithms. Each sample was labeled, hybridized, scanned and analyzed according to the
manufacturer’s protocol (Gunderson et al. 2005). To account for germline specific copy number polymorphisms, a pool of 118 blood-drawn DNA samples was compiled and used as Illumina’s standard clustering reference through the BeadStudio software, which estimates allele-specific intensity boundaries.
Genotype reports and LogR values were extracted with reference to dbSNP's (build 125) forward allele orientation using BeadStudio (v3.1, Illumina, San Diego, CA, USA). Sample information is in Additional Data File 1 and LogR (A+B signal) values can be found on GEO under series GSE10893, platform GPL8139.
Identification of CNA with SWITCHdna
To determine regions of copy number aberration (CNA), we developed a new analysis method that is a modification of the SupWald method (Andrews 1993; Bai 1998), where we created an R suite of functions called “SWITCHdna”, to identify breakpoints in aCGH data. Statistical problems in aCGH analysis are the detection of transition points (positions where DNA copy numbers change) along with
number of transition points (K) is performed sequentially. First, we test for the presence of at least one transition point (versus none) across the entire
chromosome. If the test shows no significant deviation from the null model (or no change points) we accept K=0. Otherwise, we find the change point that maximizes the F statistic and continue and test for the presence of the two change points (versus one) and so on. We accepted a change point when the minimum of two criteria were met: 1) size of region on either side of the breakpoint was larger than
(number of observations (in our case, array probes) which would cover
user-defined range) and 2) the F statistic of each segment was the maximum value possible and above the user-specified threshold. Following detection of the transition points, a segment average value and corresponding z-score, are determined along with the number of observations used.
A significance filter was applied to the raw SWITCHdna-identified segments in order to reduce noise and increase the probability of identifying biologically relevant regions. To determine this significance cutoff, we created 100 permuted datasets from our LogR ratio values, which had values shuffled within the space of each chromosome. SWITCHdna was then run on each of these permuted datasets to gather information about random segment statistics. We found that a z-score of 3 or greater, and intensity cutoff of 0.1 was sufficient to select for values with a
familywise error rate of 5% (data not shown). All subsequent plots and tables were produced after applying this significance filter to our data. Plotting functions
SWITCHdna is provided as a source script in R(R Development Core Team 2009) and available for download at: https://genome.unc.edu/pubsup/SWITCHdna/. Determining subtype-specific CNA
Using the cnaGENE function of SWITCHdna, the segment output file was converted into an indicator matrix, where for each sample, each gene’s copy state was represented as -1 = loss, 0 = no change, 1 = gain. This happens first on a segment basis, with individual gene data then being taken from the segment value; specifically SWITCHdna first identifies the gain/loss segments of a sample, the cnaGENE function filters segments by providing thresholds for Z score and Intensity levels (that can be determined through permuting probe loci and rerunning
SWITCH). When a segment passes filtering, all genes that fall completely within that segment are assigned a gain/loss status as appropriate to the sign of the segment. For genes that may be split by a segment, we assigned a value of unchanged=0, because it was split and thus, giving 2 possible values; the split genes were a minority of the genes and this only affected <0.5% of genes across all samples. For each subtype, the counts of gains and losses were compared versus all other samples in order to identify subtype-specific CNA. A Fisher’s Exact test was
RNAi Cell Line experiments
Stable RNAi knockdown lines were generated from hTERT-immortalized, human mammary epithelial cell lines (HME-CC and ME16C) cultured as described in Troester et al (Troester et al. 2006). Genes were targeted with shRNA constructs for RAD17 (Oligoengine) and RAD50 (Origene) (RAD17 – UGCCAUACCUUGCUCUACU, GUGGAAAGACAACGACCUU; RAD50: TI308519 –
CTTCAGACAGGATTCTTGAACTGGACCAG, CTCAACTGTGGCATCATTGCCTTGGATGA) and control lines were concurrently made using a non effective construct (Origene –
TR30003, Oligoengine – VEC-PRT-0006). 10g of each vector was transfected into Phoenix 293T cells using Lipofectamine 2000 (Invitrogen) as per manufacturer’s instructions to produce retrovirus. Viral supernatant was collected and applied to the cell line with 75ug of polybrene. Stable populations were selected by culturing in 400mg/mL geneticin for the RAD17 knockdown line and its control and 1mg/mL puromycin for the RAD50 knockdown line and control.
Western Blot Analysis
detected using SuperSignal West Pico Chemiluminescent Substrate (Pierce, Rockford, IL, USA).
Cell Cytotoxicity Assays
Sensitivity to drugs was assessed by a modified mitochondrial dye-conversion assay (Cell Titer 96, Promega #G4100, Madison, WI, USA) as described (Troester et al. 2004; Hoadley et al. 2007). Carboplatin and paclitaxel were
purchased from UNC Hospital Pharmacy (Chapel Hill, NC, USA). ABT-888 was generously provided by the Center for Integrative Chemical Biology and Drug Discovery (CICBDD) and the University Cancer Research Fund at the University of North Carolina. 72h inhibitory concentrations that caused a 50% reduction in MTT (3-[4,5-dimethylthiazol-2-yl]-2,5-diphenyl tetrazolium bromide) dye conversion (IC50) were determined using nonlinear regression (Van Ewijk and Hoekstra 1993). BRCA1 Foci Formation Assay
HME-CC cells were seeded into 4-chamber well slides at an initial
concentration of 50,000 cells per well, allowed to adhere, then irradiated with 2.5 Gy of ionizing radiation with 20 minute recovery, or treated with 200 M ABT-888 for 24h, or left untreated. After treatment, cells were fixed with 4%
paraformaldehyde, permeabilized with 0.2% Triton X-100 solution, then
performed using a MetaMorph 7.0 (Molecular Devices) analysis module with foci being scored as areas of 2-5 pixel width with 70 gray levels above local background intensity. At least 5 fields of view were scored, per sample, per treatment category. Survival Analysis
A mean expression value for RAD17+RAD50, and INPP4B, for each patient tumor in the UNC337 and NKI295 (van de Vijver et al. 2002) datasets was
2.4 Acknowledgements
This work was supported by funds from the NCI Breast SPORE program (P50-CA58223), RO1-CA138255, T32-GM008719, F30-ES018038, R03-CA132143, P50-CA125183, the Breast Cancer Research Foundation, the EIF-Lee Jeans
2.5 Figures and Legends
Figure 2.1: Copy number frequency plots from SWITCHdna show regions of
aberrations shared by members of the same subtype.
Grey shading indicates regions of change with the y-axis representing frequency of aberration at each site within each subtype. Regions in black were statistically associated with a particular subtype and remained significant after Benjamini-Hochberg correction. Regions below the center (negative values) represent losses, and areas above the center (positive values) indicate gains. A) Basal-like, B)
Claudin-low, C) HER2-enriched, D) Luminal A, E) Luminal B, and F) Normal-like. G) Expanded view of the Basal-like copy number landscape. INPP4B, MAP3K8,
Figure 2.2: Numerous genes in the UNC-Norway dataset have low gene
expression associated with DNA copy number loss.
Figure 2.3: ANOVA boxplots for individual genes that are commonly lost in
Basal-like cancers according to intrinsic subtype determined using the
UNC337 sample set.
Figure 2.4: Survival analysis according to expression of RAD17+RAD50 and
INPP4B.
Figure 2.5: RNAi knockdown experiments in an immortalized HMEC (BABE
cell line).
Western blot analysis showing reduction of RAD17 and RAD50 protein expression in HME-CC A) single, or B) double RNAi knockdown lines. (KD, knockdown line; C, vector control line). Tubulin staining was performed as a loading control. C) Estimated IC50 with 95% CI for ABT-888, Carboplatin, and Paclitaxel based on mitochondrial dye-conversion assay. Results are based on the average of two experiments per condition, each done in triplicate, with knockdown-control pairs with significant differences in IC50 are designated with a *.
Figure 2.6: BRCA1-mediated DNA repair foci formation assay.
A) Representative images of BRCA1 foci formation in RAD17-RAD50 Double
Knockdown cells and control cells after treatment with 2.5 Gy of ionizing irradiation and 20 minute recovery (Ionizing Radiation), or no treatment (Untreated). B) Representative images of BRCA1 foci formation in RAD17-RAD50 Double Knockdown cells and control cells with 200 M ABT-888 (ABT-888), or no treatment (Untreated). Green channel - BRCA1, Red channel – Geminin, Blue Channel - DAPI images. All images were taken with a 63x objective and post
processed to 300% of its original size. Automated BRCA1 foci counting results from each cell line for C) ionizing radiation and D) ABT-888 treatment. Error bars
represent 95% confidence intervals (* p<.05 of knockdown relative to control). p-values were calculated from t-tests comparing foci counts in treated Double
Table 2.1: Frequency of copy number alterations data for the UNC-Norway
combined dataset.
Data is shown for selected A) deletions, B) amplifications, C) average number of changes, D) % Tumor Cellularity, and E) co-occurrences. Values are presented in ‘Count (%)’ format. Specific counts are given for individual deletions or
co-deletions, with each sample only classified into one category. C) Counts for average gains/losses for each subtype. Total number of aberrations is the sum of all
Table 2.2: Frequency of copy number alterations data for the Jonsson dataset.
Data is shown for selected A) deletions, B) amplifications, C) average number of changes, and D) co-occurrences. Values are presented in ‘Count (%)’ format. Specific counts are given for individual deletions or co-deletions, with each sample only classified into one category. C) Counts for average gains/losses for each subtype. Total number of aberrations is the sum of all individual gene gains and losses. Average segment number and length were calculated from the SWITCHdna generated segments for each sample within each subtype. D) Rates of
co-occurrence of 5q cluster loss with other gene alterations are shown (N refers to the number of total samples with 5q loss). Fisher’s Exact tests or Chi-square
Table 2.3: Comparison of Jonsson et al. copy number based classifications
versus intrinsic subtypes.
Table 2.4: Examination of possible correlations between the specific CNA and
overall genomic instability.
The average numbers of CNA for gains, losses, or both, are shown for the entire dataset and within sets of tumors with a given copy number alteration (5q,
Supplementary Figure 2.1: Heatmap of copy number aberration landscape of
the UNC-NW tumor training sample set.
Supplementary Figure 2.2: RNAi knockdown experiments in a second
immortalized HMEC (ME16C).
Supplementary Table 2.1: List of the subtype-specific regions of aberration
Supplementary Table 2.1
Chromosome Start Position
Stop Position
Cytoband Gain/Loss
Basal
1 41717036 43943775 1p34.2 GAIN
1 43945805 44960161 1p34.1 GAIN
1 46541957 46555032 1p33 GAIN
4 1234177 1683843 4p16.3 LOSS
4 3220565 5553626 4p16.2 LOSS
4 5577784 10295484 4p16.1 LOSS
4 10979549 15266111 4p15.33 LOSS
4 15313739 17632477 4p15.32 LOSS
4 19864333 22430289 4p15.31 LOSS
4 23402742 26636101 4p15.2 LOSS
4 30331135 30753569 4p15.1 LOSS
4 37121738 38804810 4p14 LOSS
4 41057559 42353879 4p13 LOSS
4 69085500 69570979 4q13.2 LOSS
4 71492582 75938920 4q13.3 LOSS
4 76623381 79684447 4q21.1 LOSS
4 79691766 80079606 4q21.21 LOSS
4 114219937 114355024 4q26 LOSS
4 143168636 143603331 4q31.21 LOSS
4 151218876 154929678 4q31.3 LOSS
4 155375138 160500747 4q32.1 LOSS
4 162524501 164492534 4q32.2 LOSS
4 164612456 170167997 4q32.3 LOSS
4 170251982 170915637 4q33 LOSS
4 174326479 176135905 4q34.1 LOSS
4 176791083 177486490 4q34.2 LOSS
5 49730236 50173926 5q11.1 LOSS
5 52119531 58183162 5q11.2 LOSS
5 58300629 62108926 5q12.1 LOSS
5 63292034 63701397 5q12.2 LOSS
5 63838208 66501179 5q12.3 LOSS
5 66513872 67633403 5q13.1 LOSS
5 68425638 72913540 5q13.2 LOSS
5 73958991 76396789 5q13.3 LOSS
5 76408288 81082828 5q14.1 LOSS
Chromosome Start Position
Stop Position
Cytoband Gain/Loss
5 92250850 96544700 5q15 LOSS
5 98132900 102642260 5q21.1 LOSS
5 102912456 102926389 5q21.2 LOSS
5 106744250 109231328 5q21.3 LOSS
5 109877429 111137815 5q22.1 LOSS
5 111507433 112958878 5q22.2 LOSS
5 113725565 115180304 5q22.3 LOSS
5 115193714 121517156 5q23.1 LOSS
5 121675719 127022221 5q23.2 LOSS
5 127447382 129549383 5q23.3 LOSS
5 130522776 135427403 5q31.1 LOSS
5 135493104 138988200 5q31.2 LOSS
5 139008130 142795270 5q31.3 LOSS
5 143171919 147191453 5q32 LOSS
5 147238467 151765017 5q33.1 LOSS
5 152850499 154326721 5q33.2 LOSS
5 155686345 159845035 5q33.3 LOSS
5 159922707 167623739 5q34 LOSS
5 167651670 171366482 5q35.1 LOSS
5 172591744 174888201 5q35.2 LOSS
5 176660805 180009206 5q35.3 LOSS
6 13729714 14088212 6p23 GAIN
6 42772314 43039595 6p21.1 GAIN
9 831690 1047552 9p24.3 GAIN
9 12683435 13935586 9p23 GAIN
9 14071847 14900353 9p22.3 GAIN
9 122980237 124410900 9q33.2 LOSS
10 170643 1769670 10p15.3 GAIN
10 3099740 3205003 10p15.2 GAIN
10 3811260 6662244 10p15.1 GAIN
10 7244255 12332593 10p14 GAIN
10 12431738 17283687 10p13 GAIN
10 17311250 19896508 10p12.33 GAIN
10 20145174 20609292 10p12.32 GAIN
10 21110098 22746531 10p12.31 GAIN
10 22863772 24876778 10p12.2 GAIN
10 24604620 28074753 10p12.1 GAIN
10 28141103 31360860 10p11.23 GAIN
Chromosome Start Position
Stop Position
Cytoband Gain/Loss
12 44599181 47397048 12q13.11 LOSS
12 47446248 48387464 12q13.12 LOSS
12 48421630 53099317 12q13.13 LOSS
12 53136012 55168448 12q13.2 LOSS
12 55201993 55269875 12q13.3 LOSS
12 56621627 57600529 12q14.1 LOSS
13 104916365 104941384 13q33.2 GAIN
13 106620319 107317084 13q33.3 GAIN
13 109973420 114110898 13q34 GAIN
14 21961377 23608756 14q11.2 LOSS
14 23609961 31698685 14q12 LOSS
14 31868274 34078694 14q13.1 LOSS
14 34100051 35410919 14q13.2 LOSS
14 35837522 37090214 14q13.3 LOSS
14 37128947 38971371 14q21.1 LOSS
14 49113809 52311409 14q22.1 LOSS
14 52311662 54325595 14q22.2 LOSS
14 54378476 55837783 14q22.3 LOSS
14 57736586 58085299 14q23.1 LOSS
14 69312342 69568836 14q24.2 LOSS
14 92049878 92765306 14q32.12 LOSS
14 92773649 95250286 14q32.13 LOSS
14 95740950 100105884 14q32.2 LOSS
15 28193434 29022600 15q13.2 LOSS
15 29020705 31945591 15q13.3 LOSS
15 31945721 37862331 15q14 LOSS
15 37880223 38115089 15q15.1 LOSS
15 49136093 51017946 15q21.2 LOSS
15 51593230 55368004 15q21.3 LOSS
15 56490060 57176541 15q22.1 LOSS
15 57184612 61461128 15q22.2 LOSS
15 61583863 61913200 15q22.31 LOSS
15 65899096 66370691 15q23 LOSS
15 75011134 75564998 15q24.3 LOSS
19 39664720 39962225 19q13.11 GAIN
22 37740208 38258806 22q13.1 GAIN
Her2
Chromosome Start Position
Stop Position
Cytoband Gain/Loss
Luminal A
16 45393460 45522699 16q11.2 LOSS
16 45546775 51138307 16q12.1 LOSS
16 51646446 54466783 16q12.2 LOSS
16 54782803 56638303 16q13 LOSS
16 56705000 65205296 16q21 LOSS
16 65206155 69392572 16q22.1 LOSS
16 69398793 73198518 16q22.3 LOSS
16 73739922 78192112 16q23.1 LOSS
16 79132355 80549399 16q23.2 LOSS
16 80588753 82633263 16q23.3 LOSS
16 82644872 85172804 16q24.1 LOSS
16 85920445 87225756 16q24.2 LOSS
16 87232502 87749670 16q24.3 LOSS
Luminal B
5 58300629 59320301 5q12.1 GAIN
5 68425638 71536822 5q13.2 GAIN
5 101597589 102642260 5q21.1 GAIN
5 102912456 102926389 5q21.2 GAIN
5 125787000 126200608 5q23.2 GAIN
5 128458341 128477620 5q23.3 GAIN
6 116369389 117096650 6q22.1 LOSS
6 117109043 117359993 6q22.2 LOSS
10 118946990 119027085 10q25.3 LOSS
10 119032598 121691235 10q26.11 LOSS
10 122206456 122883255 10q26.12 LOSS
10 123223889 124739898 10q26.13 LOSS
11 49383103 49393881 11p11.12 LOSS
11 76710709 85146692 11q14.1 LOSS
11 85633463 87710586 11q14.2 LOSS
11 87881006 92269284 11q14.3 LOSS
11 92342437 95765250 11q21 LOSS
11 104262627 109547776 11q22.3 LOSS
11 110631916 112776199 11q23.1 LOSS
11 112785528 114880322 11q23.2 LOSS
11 116803699 119605859 11q23.3 LOSS
13 27611014 27767472 13q12.2 LOSS
Chromosome Start Position
Stop Position
Cytoband Gain/Loss
20 40134806 41603948 20q13.11 GAIN
20 41621022 45719023 20q13.12 GAIN
20 45719063 49181611 20q13.13 GAIN
20 49438571 52269898 20q13.2 GAIN
CHAPTER THREE
MICRO-SCALE GENOMIC COPY NUMBER ABERRATIONS AS ANOTHER MEANS OF MUTAGENESIS IN BREAST CANCER
3.1 Introduction
In breast cancers, the Basal-like subtype has high levels of genomic instability relative to other breast cancer subtypes with many basal-like-specific regions of aberration. There is evidence that this genomic instability extends to smaller scale genomic aberrations as well, as shown by a previously described micro-event in the PTEN gene in the Basal-like SUM149 breast cancer cell line. We sought to identify if small regions of genomic change exist, by using a high density, gene centric comparative genomic hybridization (CGH) array on both cell lines and primary tumors. A custom Agilent tiling array for CGH (244,000 probes, 200bp tiling resolution) was created to identify small regions of genomic change and was
incidence of these events. These micro-aberrations sometimes altered expression of the involved gene as suggested by data from microarray and mRNA-seq studies. We confirmed the presence of the PTEN micro-amplification in SUM149 and by mRNA-seq showed that this resulted in loss of expression of all exons downstream of this event. Micro-aberrations disproportionately affected the 5’ regions of the affected genes, including the promoter region, and a high frequency of micro-aberrations was associated with poor survival outcomes. Using a high probe density, gene-centric aCGH microarray, we present evidence of small-scale genomic aberrations that contribute to gene inactivation, and thus, genomic instability and tumor formation through a mechanism not detected using conventional copy number analyses.
A hallmark of many human cancers is genomic instability, and cancer itself can be thought of as the result of altered ploidy (Shen). The importance of studying the cancer genome cannot be understated as genomic alterations have been linked to cancer causation both broadly and in specific subgroups of patients (Rowley 1973; Seshadri et al. 1989; Seshadri et al. 1993; Sakakura et al. 1999; Pinkel and Albertson 2005). Alterations on a genomic level are likely to cause associated changes in gene expression (Tran et al. ; Jarvinen et al. 2008). Previous global gene expression profiling studies of breast carcinoma samples have identified at least five distinct subtypes of breast cancer (Perou et al. 1999; Perou et al. 2000; Sorlie et al. 2001; Sorlie et al. 2003; Hu et al. 2006) and specific patterns of copy number