Energy, added sugar, and saturated
fat contributions of taxed beverages
and foods in Mexico
Carolina Batis, PhD,(1) Lilia S Pedraza,MSc,(2) Tania G Sánchez-Pimienta, MSc,(3)
Tania C Aburto, MSc,(2) Juan A Rivera-Dommarco,PhD.(3)
(1) Cátedra Conacyt, Centro de Investigación en Nutrición y Salud, Instituto Nacional de Salud Pública. Cuernavaca, Morelos, México. (2) Department of Nutrition, Gillings School of Global Public Health, University of North Carolina. Chapel Hill, NC, USA.
(3) Centro de Investigación en Nutrición y Salud, Instituto Nacional de Salud Pública. Cuernavaca, Morelos, México.
Received on: January 24, 2017 • Accepted on: May 15, 2017
Corresponding author: PhD. Juan A Rivera-Dommarco. Av. Universidad 655, col. Santa María Ahuacatitlán. 62100, Cuernavaca, Morelos, Mexico. E-mail:[email protected]
Batis C, Pedraza LS, Sánchez-Pimienta TG, Aburto TC, Rivera-Dommarco JA. Energy, added sugar, and saturated fat contributions of
taxed beverages and foods in Mexico. Salud Publica Mex 2017;59: 512-517.
https://doi.org/10.21149/8517
Abstract
Objective. To estimate the dietary contribution of taxed
beverages and foods. Materials and methods. Using 24-hour diet recall data from the Ensanut 2012 (n=10 096), we estimated the contribution of the items which were taxed in 2014 to the total energy, added sugar, and saturated fat intakes in the entire sample and by sociodemographic characteristics. Results. The contributions for energy, added sugar, and saturated fat were found to be 5.5, 38.1, and 0.4%, respectively, for the taxed beverages, and 14.4, 23.8, and 21.4%, respectively, for the taxed foods. Children and adolescents (vs. adults), medium and high socioeconomic status (vs. low), urban area (vs. rural), and North and Center region (vs. South) had higher energy contribution of taxed beverages and foods. The energy contribution was similar between males and females.
Conclusions. These taxes covered an important
propor-tion of Mexicans’ diet and therefore have the potential to improve it meaningfully.
Keywords: taxes; energy; nutritive sweeteners; saturated fatty acids; Mexico
Batis C, Pedraza LS, Sánchez-Pimienta TG, Aburto TC, Rivera-Dommarco JA.
Contribución de energía, azúcar añadido y grasa saturada de las bebidas y alimentos con impuesto en México. Salud Publica Mex 2017;59:512-517.
https://doi.org/10.21149/8517
Resumen
Objetivo. Estimar la contribución dietética de las bebidas
y alimentos con impuesto. Material y métodos. Con el recordatorio de 24-horas de la Ensanut 2012 (n=10 096), estimamos la contribución de los productos con impues-to en 2014 al consumo impues-total de energía, azúcar añadido y grasa saturada en toda la muestra y por sociodemográficos.
Resultados. La contribución de energía, azúcar añadido
y grasa saturada fue 5.5, 38.1 y 0.4%, respectivamente, para bebidas con impuesto y 14.4, 23.8 y 21.4%, respectivamente, para alimentos con impuesto. Los niños y adolescentes (vs. adultos), nivel socioeconómico medio y alto (vs. bajo), área urbana (vs. rural), y región Norte y Centro (vs. Sur) tuvieron una contribución de energía mayor de bebidas y alimentos con impuesto. La contribución fue similar entre hombres y mujeres. Conclusión. Estos impuestos cubren una propor-ción importante de la dieta mexicana y por lo tanto tienen el potencial de mejorarla de manera relevante.
O
wing to the high prevalence in Mexico of over-weight or obese people, as well as people with diabetes,1-3 the Mexican government levied a new taxfrom January 2014 on sugar-sweetened beverages (SSBs) and nonessential energy-dense foods.4 The SSBs tax is
$1 Mexican peso/liter (~10% of the total price), and ap-plies to all non-dairy, non-alcoholic beverages (including beverage concentrates and powders) with added sugar. The nonessential energy-dense food tax is 8% and ap-plicable to foods such as chips and snacks, candies and sweets, chocolate, pudding, peanut and hazelnut but-ters, ice cream and ice pops, and cereal-based products with added sugar. To be taxed, products must have an energy density of ≥275 kcal/100 g.5
Analyses of household purchases found that after the tax was introduced, purchase of SSBs decreased 6% in 20146 and 9.7% in 20157 and purchase of
nones-sential energy-dense foods decreased 5%8 in 2014 and
7% in 2015.9 To better understand the impact of these
results, it is necessary to know the energy and nutrient contribution of the taxable items to the Mexican diet. We, therefore, aimed to estimate the energy, added sugar, and saturated fat contributions of these taxed items. For this purpose, we used 24-h diet recall data from the Mexican National Survey of Health and Nutrition (Ensanut) 2012.
We analyzed energy, sugar and fat as these are the key nutrients that have been considered in other poli-cies as well (labeling, marketing, and food availability in schools). We analyzed added sugar instead of total sugar, and saturated fat instead of total fat because of the recommendation to limit the intake of these nutrients in specific.10 Sodium is another key nutrient that is targeted
by several policies and recommendations. However, given the difficulty in estimating total sodium intake from 24-h recall data we did not analyze it.
Materials and methods
Ensanut 2012 was a cross-sectional, multistage, probabi-listic survey representative of the Mexican population.11
It was carried out between October 2011 and May 2012. Informed consent was obtained from each participant or from the participant’s parent/guardian. The Ethics Com-mittee of the Mexican National Institute of Public Health reviewed and approved the survey protocol. Data on dietary intake were collected via 24-h diet recall in a random subsample (~11%) of Ensanut 2012 respondents. We included non-pregnant, non-lactating females and all males ≥1 y old, and excluded 125 participants with extreme energy intake (outside ±3 standard deviation of the log of the energy intake/energy requirements ratio). Our analytical sample was 10 096 subjects [2 113
preschool-aged children (1-4 y); 2 753 school-aged children (5-11 y); 2 056 adolescents (12-19 y); and 3 174 adults (≥20 y)]. This sample had specific weights to as-sure the representativeness of the Mexican population. Trained interviewers conducted 24-h diet recall in person using a multiple five-pass probing method.12,13
The interviewers recorded the types and amounts of all food items the participants had consumed in the preceding 24-h period. Respondents, most prominently those <15 y, were assisted by the person who cooked and prepared their meals in the household.
Based on tax law,5 updated resolutions,14-16 and
personal communications with the Secretariat of Finance and Public Credit’s personnel to clarify remaining ques-tions, we identified the items reported in the 24-h diet recall that were taxed. For many industrialized juices, the description in the food composition table was not detailed enough for us to identify whether they were taxable (e.g., some brands have added sugars and oth-ers do not, and the description was only “orange juice, industrialized” without brand specification). In those cases, classification was defined based on the most com-mon ingredients for individual juice flavors according to a detailed brand-product-level list from The Nielsen Company’s Mexico Consumer Panel Services, the da-taset previously used for tax-related evaluations.6,8 We
classified items in taxed beverages and taxed foods and in subcategories of each group.
The food composition table compiled to analyze Ensanut’s 24-h diet recall does not include added sugar; this nutrient was estimated as described by Sá nchez-Pimienta and colleagues.17 Briefly, for all foods without
sugar or where all sugar is intrinsic (fruits, unprocessed cereals, legumes, etc.) their added sugar value was zero; for foods where all sugar is added (sodas, confection-ary, sweeteners, processed meats, and cereals, etc.) their added sugar value is equal to their total sugar. For all other foods that have a mix of intrinsic or added sugar a portion of the total sugar was considered as added; this portion was estimated based on lactose content, or based on similar foods that do not have added sugars (e.g., comparing the sugar content of 100% juice vs. industrialized juice).
Potosí, Sinaloa, Zacatecas; North: Baja California, Baja California Sur, Coahuila, Chihuahua, Durango, Nuevo León, Sonora, Tamaulipas; and South: Campeche, Chi-apas, Guerrero, Hidalgo, Oaxaca, Puebla, Quintana Roo, Tabasco, Tlaxcala, Veracruz, Yucatán.
For the entire sample, we estimated the mean intake of energy, added sugar, and saturated fat (kcal) from the total diet and from the taxed beverages, taxed foods, and subcategories of each. Then, based on these mean intakes, we calculated the percentage of contribution to total energy, added sugar, and saturated fat intake (% kcal) from the taxed items. Energy intake estimations were also calculated for taxed beverages and taxed foods by sociodemographic characteristics. In all analyses, we accounted for the complex sample design of Ensanut.
Results
The general characteristics of the sample are shown in table I; the majority of the Mexican population lived in urban areas (73%) and in the Central region (49%).
In the entire sample (table II), taxed beverages had a mean contribution of 5.5% for energy, 38.1% for added sugar, and 0.4% for saturated fat. Industrialized carbonated beverages were the top contributor for en-ergy and added sugar among the different categories of taxed beverages. Taxed foods had a mean contribution of 14.4% for energy, 23.8% for added sugar, and 21.4% for saturated fat; bakery-made sweet bread was the top contributor for energy and saturated fat.
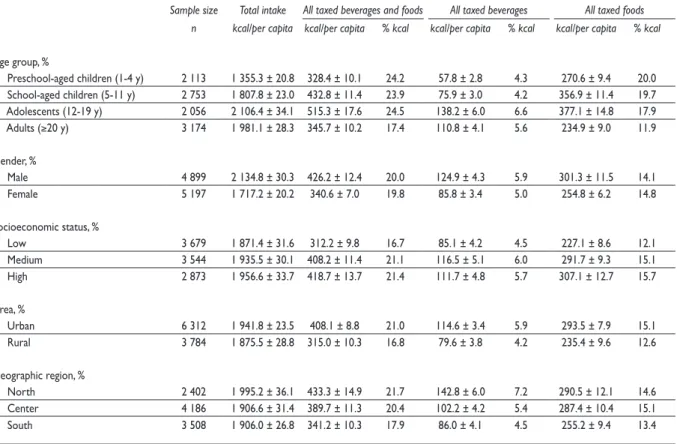
Taxed beverages had a mean energy contribution of ~4% among preschool- and school-aged children, 6.6% among adolescents, and 5.6% among adults (table III). Taxed foods had a mean energy contribution of ~20% among preschool- and school-aged children, 17.9% among adolescents, and 11.9% among adults. Taxed beverages and foods combined had a mean energy con-tribution that was similar between males and females (20.0 vs. 19.8%); it was lower among those with low SES compared to medium and high SES (16.7 vs. ~21%); it was lower in rural compared to urban areas (16.8 vs. 21.0%); and it was lower in the South compared to the North and Center (17.9 vs. ~21%). The energy contribu-tion of taxed beverages reached 7.2% in the North.
Discussion
Our analysis revealed that the energy contribution in the Mexican diet in 2012, before the tax was introduced, was 5.5 and 14.4%, respectively, for the beverages and foods that were later-on taxed. Together, the subject items of both taxes accounted for 19.9% of total energy, 61.8% of added sugar, and 21.8% of saturated fat intakes.
In-dustrialized carbonated beverages were the top energy and added sugar contributor among taxed beverages and bakery-made sweet bread was top for energy and saturated fat among taxed foods. Adolescents had the highest consumption proportion of the taxed beverages and children (1-11 y) were highest for the taxed foods. Low SES, rural areas, and South region had a lower consumption proportion of taxed foods and beverages combined.
It is important to consider that the tax does not cover all SSBs that Mexicans consume. A previous analysis of Ensanut 2012 found that energy contribution of all SSBs, not only including industrialized ones but also homemade coffee or tea with sugar and aguas frescas
(sweetened and blended multi-ingredient beverages), was 9.8% kcal.18 Fortunately, the tax covers
industrial-ized carbonated beverages, which are the most widely consumed SSBs,19 and those with the highest added
sugar content,17 in Mexico. Table I
SociodemographiccharacteriSticS
ofthe mexicanpopulation. méxico, october
2011 to may 2012
Value
Sample size, n 10 096
Age group, %
Preschool-aged children (1-4 y) 7.6 ± 0.3 School-aged children (5-11 y) 16.1 ± 0.5 Adolescents (12-19 y) 14.5 ± 0.4 Adults (≥20 y) 61.8 ± 0.7
Gender, %
Male 49.5 ± 0.9
Female 50.5 ± 0.9
Socioeconomic status, %
Low 30.4 ± 0.9
Medium 32.0 ± 0.9
High 37.6 ± 1.0
Area, %
Urban 73.0 ± 0.7
Rural 27.0 ± 0.7
Geographic region, %
North 19.8 ± 0.6
Center 48.6 ± 0.9
Also of note, sweet bread made in small-scale busi-nesses* is exempted from paying the tax; therefore, the total contribution of taxed bakery-made sweet bread presented is an over estimation. Unfortunately, data is not available to estimate the proportion of sweet bread made in small-businesses.
The largest difference that we found in the energy contribution of taxed items between sociodemographic characteristics was for taxed foods when comparing dif-ferent age groups. The energy contribution was eight to five percentage points larger among children and ado-lescents compared to adults. This age difference might
reflect that younger age groups have an enhanced food preference for this type of sweet and savory snacks, that marketing is targeted towards this age group, and/or that the availability of these foods is high at the schools and their surroundings.
We also found that the energy contribution of both taxed beverages and foods was lower for the low SES, rural areas and South region. However, the differences comparing to higher SES, urban areas and North and Center region were of only two to four percentage points. Meaning that the intake in these disadvantaged populations is also considerable, even if it is slightly lower. These results are worrisome, considering that Colchero and colleagues reported that the price of taxed beverages and foods increased less in rural areas,20 and
hence the effect of the tax on consumption in rural areas could be attenuated as has been already identified in the case of taxed beverages.21
The limitations of this study are those related to the measurement error expected in self-reported dietary data,22 as well as limitations in the of foods and beverages
available in the food composition table that hinders exact classification of items as taxed or untaxed. Moreover, the content of added sugar was not available in the food
* The law definition of small-scale businesses has changed from year to year (annual income of <$2 million pesos in 2014, <$100 000 pesos in 2015, and <$300 000 pesos in 2016). The exemption is for both producers and retailers. However, even when a small retailer such as a “corner store” is exempt from the tax, the items sold in this store could have a higher price because the tax was already paid by the producer. Likewise, the exemption applies to all taxed beverages and foods (not only sweet bread); but it might affect particularly bakery-made sweet bread, which among all taxed beverages and foods is the main item generally producible in small-scale businesses.
Table II
meantotalintakeandcontributionoftaxedfoodgroupSforenergy, addedSugar,
andSaturatedfatamongthe mexicanpopulation (≥1 yexcludingpregnantandlactating
women) (n=10 096). méxico, october 2011 to may 2012
Energy Added sugar Saturated fat
kcal/per capita % kcal kcal/per capita % kcal kcal/per capita % kcal
Total intake 1 923.9 ± 18.9 237.7 ± 3.9 221.4 ± 3.2
All taxed beverages and foods 383.0 ± 7.1 19.9 147.0 ± 3.3 61.8 48.2 ± 1.2 21.8 All taxed beverages 105.1 ± 2.7 5.5 90.4 ± 2.6 38.1 0.8 ± 0.1 0.4 Industrialized carbonated beverages* 77.2 ± 2.5 4.0 77.1 ± 2.5 32.5 0.0 ± 0.0 0.0 Industrialized non-carbonated beverages‡ 27.9 ± 1.3 1.5 13.3 ± 0.8 5.6 0.8 ± 0.1 0.4
All taxed foods 277.9 ± 6.3 14.4 56.5 ± 2.1 23.8 47.4 ± 1.2 21.4 Salty snacks§ 48.7 ± 2.8 2.5 0.7 ± 0.1 0.3 9.5 ± 0.6 4.3
Packaged cereal-based sweets# 81.7 ± 4.1 4.2 19.1 ± 1.0 8.0 11.8 ± 0.7 5.3
Bakery-made sweet bread& 99.1 ± 3.8 5.2 11.4 ± 0.4 4.8 20.5 ± 0.8 9.2
Non-cereal-based sweets≠ 31.1 ± 2.7 1.6 20.6 ± 1.8 8.7 5.3 ± 0.4 2.4
Ready-to-eat cereal∞ 17.3 ± 1.0 0.9 4.8 ± 0.3 2.0 0.4 ± 0.0 0.2
* Cola and non-cola sodas
‡ Nectars, sports drinks, industrialized tea/coffee, flavored waters, energy drinks, flavored yogurt drinks, and powders to prepare flavored waters § Processed peanuts and seeds, potato chips, corn chips, flour chips, fried pork skin, and popcorn
# Packaged pastries, sweet bread, cakes, cookies, and cereal bars & Unpackaged sweet bread
composition table; hence, our estimation is only an ap-proximation. Another limitation is that the survey was conducted between October 2011 and May 2012, hence we did not capture the intake during all the seasons. This limitation is particularly important for taxed beverages, as previous analyses have found that their consumption increases during the summer.6 Despite these limitations,
the 24-hour recall data from Ensanut 2012 is the best source of dietary information available representative of the Mexican population. Ensanut 2012 also has a Food Frequency Questionnaire,23 but 24-hours recalls
are considered more valid.24
In sum, the taxes introduced in 2014 targeted items that account for a considerable portion of Mexicans’ energy, added sugar and saturated fat intake (20, 62, and 22% respectively). Therefore, these taxes have the potential to beneficially influence the quality of the Mexican population’s diet. For example, the 7.6% reduc-tion in taxed beverages that was previously reported in 2014 and 20156,7could be translated to a decrease of eight
kcal/day of total energy and seven kcal/day of added sugar; whereas the 5.1% reduction in taxed foods that was previously reported in 20148 could be translated into
a decrease of 14 kcal/day of total energy intake, three kcal/day of added sugar, and two kcal/day of saturated fat. All the above assuming there are no substitutions. Although these effects might seem small, the taxes are only 8-10%, and simulation studies have found that these changes can substantially decrease morbidity and mortality from diabetes and cardiovascular disease in Mexico.25 Additionally, it should also be considered
that the effect of the tax is larger in some groups of the population, such as low SES.6-8
Funding
Support was primarily provided by Bloomberg Phi-lanthropies with additional support from the National Institute of Public Health and the National Institutes of Health (R01DK108148). Funders were not involved in
Table III
meantotalenergyintakeandcontributionoftaxedfoodgroupStoenergyintakeamongthe
mexicanpopulation, bySociodemographiccharacteriSticS. méxico, october 2011 to may 2012
Sample size Total intake All taxed beverages and foods All taxed beverages All taxed foods n kcal/per capita kcal/per capita % kcal kcal/per capita % kcal kcal/per capita % kcal
Age group, %
Preschool-aged children (1-4 y) 2 113 1 355.3 ± 20.8 328.4 ± 10.1 24.2 57.8 ± 2.8 4.3 270.6 ± 9.4 20.0 School-aged children (5-11 y) 2 753 1 807.8 ± 23.0 432.8 ± 11.4 23.9 75.9 ± 3.0 4.2 356.9 ± 11.4 19.7 Adolescents (12-19 y) 2 056 2 106.4 ± 34.1 515.3 ± 17.6 24.5 138.2 ± 6.0 6.6 377.1 ± 14.8 17.9 Adults (≥20 y) 3 174 1 981.1 ± 28.3 345.7 ± 10.2 17.4 110.8 ± 4.1 5.6 234.9 ± 9.0 11.9
Gender, %
Male 4 899 2 134.8 ± 30.3 426.2 ± 12.4 20.0 124.9 ± 4.3 5.9 301.3 ± 11.5 14.1 Female 5 197 1 717.2 ± 20.2 340.6 ± 7.0 19.8 85.8 ± 3.4 5.0 254.8 ± 6.2 14.8
Socioeconomic status, %
Low 3 679 1 871.4 ± 31.6 312.2 ± 9.8 16.7 85.1 ± 4.2 4.5 227.1 ± 8.6 12.1 Medium 3 544 1 935.5 ± 30.1 408.2 ± 11.4 21.1 116.5 ± 5.1 6.0 291.7 ± 9.3 15.1 High 2 873 1 956.6 ± 33.7 418.7 ± 13.7 21.4 111.7 ± 4.8 5.7 307.1 ± 12.7 15.7
Area, %
Urban 6 312 1 941.8 ± 23.5 408.1 ± 8.8 21.0 114.6 ± 3.4 5.9 293.5 ± 7.9 15.1 Rural 3 784 1 875.5 ± 28.8 315.0 ± 10.3 16.8 79.6 ± 3.8 4.2 235.4 ± 9.6 12.6
Geographic region, %
the study design; the collection, analysis, or interpreta-tion of data; the writing of this paper; or the decision to submit this paper for publication.
Acknowledgments
The authors thank Teresa Shamah and her team for coordinating Ensanut 2012 data collection.
Declaración de conflicto de intereses. Los autores declararon no tener conflicto de intereses.
References
1. Barquera S, Campos-Nonato I, Hernández-Barrera L. Prevalencia de obesidad en adultos mexicanos, 2000-2012. Salud Publica Mex 2013;55(1):151-160. https://doi.org/10.21149/spm.v55s2.5111 2. Rivera JA, González de Cossío T, Pedraza LS, Aburto TC, Sánchez TG, Martorell R. Childhood and adolescent overweight and obesity in Latin America: a systematic review. Lancet Diabetes Endocrinol 2014;2(4):321-332. https://doi.org/10.1016/S2213-8587(13)70173-6
3. Hernández-Ávila M, Gutiérrez JP, Reynoso-Noverón N. Diabetes mel-litus en México. El estado de la epidemia. Salud Publica Mex 2013;55(suppl 2):s129-s136. https://doi.org/10.21149/spm.v55s2.5108
4. Secretaría de Salud. Estrategia Nacional para la Prevención y el Control del Sobrepeso, la Obesidad y la Diabetes. Ciudad de México: SSa, 2013. 5. Congreso de los Estados Unidos Mexicanos. Decreto por el que se reforman, adicionan y derogan diversas disposiciones de la Ley del Impuesto al Valor Agregado; de la Ley del Impuesto Especial sobre Producción y Servicios; de la Ley Federal de Derechos, se expide la Ley del Impuesto sobre la Renta, y se abrogan la Ley del Impuesto Empresarial a Tasa Única, y la Ley del Impuesto a los Depósitos en Efectivo. México: Diario Oficial de la Federación, 11 de diciembre de 2013. [accessed on December 11, 2016]. 6. Colchero MA, Popkin BM, Rivera JA, Ng SW. Beverage purchases from stores in Mexico under the excise tax on sugar sweetened beverages: ob-servational study. BMJ 2016;352:h6704. https://doi.org/10.1136/bmj.h6704 7. Cochero MA, Rivera-Dommarco J, Popkin BM, Ng SW. In Mexico, evidence of sustained consumer response two years after implementing a sugar-sweetened beverage tax. Health Aff 2017;36(3):564-571. https://doi. org/10.1377/hlthaff.2016.1231
8. Batis C, Rivera JA, Popkin BM, Taillie LS. First-year evaluation of Mexico’s tax on nonessential energy-dense foods: an observational study. PLOS Med 2016;13(7):e1002057. https://doi.org/10.1371/journal.pmed.1002057 9. Taillie LS, Rivera JA, Popkin BM, Batis C. Do high vs. low purchasers respond differently to a nonessential energy-dense food tax? Two-year evaluation of Mexico’s 8% nonessential food tax. Prev Med. 2017. https:// doi.org/10.1016/j.ypmed.2017.07.009
10. Joint WHO/FAO Expert consultation on Diet Nutrition and the Pre-vention of Chronic Diseases. Diet, nutrition and the prePre-vention of chronic diseases: report of a joint WHO/FAO expert consultation. Geneva, Switzerland: WHO, 2002.
11. Romero-Martínez M, Shamah-Levy T, Franco-Núñez A, Villalpando S, Cuevas-Nasu L, Gutiérrez JP, et al. Encuesta Nacional de Salud y Nutrición 2012: diseño y cobertura. Salud Publica Mex 2013;55(suppl 2):s332-s340. https://doi.org/10.21149/spm.v55s2.5132
12. Conway JM, Ingwersen LA, Vinyard BT, Moshfegh AJ. Effectiveness of the US Department of Agriculture 5-step multiple-pass method in assessing food intake in obese and nonobese women. Am J Clin Nutr 2003;77(5):1171-1178.
13. Lopez-Olmedo N, Carriquiry AL, Rodriguez-Ramirez S, Ramirez-Silva I, Espinosa-Montero J, Hernandez-Barrera L, et al. Usual intake of added sugars and saturated fats is high while dietary fiber is low in the Mexican population. J Nutr 2016;146(9):1856S-1865S. https://doi.org/10.3945/ jn.115.218214
14. Secretaría de Hacienda y Crédito Público. Resolución Miscelánea Fiscal para 2014. Alimentos de consumo básico. México: Diario Oficial de la Federación, 2013.
15. Secretaría de Hacienda y Crédito Público. Segunda resolución de modificaciones a la resolución miscelánea fiscal para 2014. Alimentos de consumo básico. México: Diario Oficial de la Federación, 2014. 16. Secretaría de Hacienda y Crédito Público. Oficio 600-04-07-2014- 4289. Se dan a conocer los criterios normativos aprobados durante el segundo trimestre de 2014. México: Diario Oficial de la Federación, 2014 [accessed on July 4,]. Available at: http://www.sat.gob.mx/informacion_fis-cal/normatividad/Documents/criterios_ normativos_2egtrimestre2014.pdf 17. Sánchez-Pimienta TG, Batis C, Lutter CK, Rivera JA. Sugar-sweetened beverages are the main sources of added sugar intake in the Mexican population. J Nutr 2016;146(9):1888s-1896s. https://doi.org/10.3945/ jn.115.220301
18. Aburto TC, Pedraza LS, Sanchez-Pimienta TG, Batis C, Rivera JA. Discretionary foods have a high contribution and fruit, vegetables, and legumes have a low contribution to the total energy intake of the Mexican population. J Nutr 2016;146(9):1881s-1887s. https://doi.org/10.3945/ jn.115.219121
19. Stern D, Piernas C, Barquera S, Rivera JA, Popkin BM. Caloric beverages were major sources of energy among children and adults in Mexico, 1999-2012. J Nutr 2014;144(6):949s956. https://doi.org/10.3945/ jn.114.190652
20. Colchero M, Zavala J, Batis C, Shamah-Levy T, Rivera-Dommarco J. Cambios en los precios de bebidas y alimentos con impuesto en áreas rurales y semirrurales de México. Salud Publica Mex 2017;59(2):137-146. https://doi.org/10.21149/7994
21. Colchero MA, Molina M, Guerrero-López CM. After Mexico Imple-mented a tax, purchases of sugar-sweetened beverages decreased and of water increased: difference by place of residence, household composition, and income level. J Nutr. 2017;147(8):1552-7.
22. Thompson FE, Subar AF. Dieary assessment methodology. In: Coulston AM, Boushey CJ, Ferruzzi MG, (eds). Nutrition in the prevention and treatment of disease. 3th ed. London: Academic Press, 2013. https://doi. org/10.1016/B978-0-12-391884-0.00001-9
23. Ramírez-Silva I, Jiménez-Aguilar A, Valenzuela-Bravo D, Martinez-Tapia B, Rodríguez-Ramírez S, Gaona-Pineda EB, et al. Methodology for estimat-ing dietary data from the semi-quantitative food frequency questionnaire of the Mexican National Health and Nutrition Survey 2012. Salud Publica Mex. 2016; 58(6):629-38. http://dx.doi.org/10.21149/spm.v58i6.7974 24. Denova-Gutiérrez E, Ramírez-Silva I, Rodríguez-Ramírez S, Jiménez-Aguilar A, Shamah-Levy T, Rivera-Dommarco JA. Validity of a food frequency questionnaire to assess food intake in Mexican adolescent and adult population. Salud Publica Mex. 2016;58(6):617-28. http://dx.doi. org/10.21149/spm.v58i6.7862