Antibody binding to CD4 induces Rac GTPase activation and
alters T cell migration
Y. Maurice Morillon II#*, Elizabeth Chase Lessey-Morillon#†, Matthew Clark*, Rui Zhang*, Bo
Wang*, Keith Burridge†,‡,§, and Roland Tisch*,‡
*Department of Microbiology & Immunology, University of North Carolina at Chapel Hill School of
Medicine, Chapel Hill, NC 27599 USA
†Department of Cell Biology and Physiology, University of North Carolina at Chapel Hill School of
Medicine, Chapel Hill, NC 27599 USA
‡Lineberger Comprehensive Cancer Center, University of North Carolina at Chapel Hill School of
Medicine, Chapel Hill, NC 27599 USA
§McAllister Heart Institute, University of North Carolina at Chapel Hill School of Medicine, Chapel
Hill, NC 27599 USA
# These authors contributed equally to this work.
Abstract
The use of nondepleting Ab specific for CD4 and CD8 is an effective strategy to tolerize CD4+ and CD8+ T cells in a tissue-specific manner. We reported that coreceptor therapy reverses diabetes in new onset NOD mice. A striking feature of coreceptor-induced remission is the purging of T cells from the pancreatic lymph nodes (PLN) and islets of NOD mice. Evidence indicates that Ab binding to the coreceptors promotes T cell egress from these tissues. The current study examined how coreceptor therapy affects the migration of CD4+ T cells residing in the PLN of NOD mice. αCD4 Ab treatment resulted in an increased frequency of PLN but not splenic CD4+ T cells that exhibited a polarized morphology consistent with a migratory phenotype. Furthermore, PLN CD4+ T cells isolated from αCD4 versus control Ab-treated animals displayed increased in vitro chemotaxis to chemoattractants such as sphingosine-1-phosphate and CXCL12. Notably, the latter was dependent on activation of the small Rho GTPases Rac1 and Rac2. Rac1 and Rac2 activation was increased in Ab-bound CD4+ T cells from the PLN but not the spleen, and knockdown of Rac expression blocked the heightened reactivity of Ab-bound PLN CD4+ T cells to CXCL12. Interestingly, Rac1 and Rac2 activation was independent of Rac guanine nucleotide exchange factors known to regulate T cell activity. Therefore, Ab binding to CD4 initiates a novel pathway that involves inflammation-dependent activation of Rac, and establishment of altered T cell migratory properties.
HHS Public Access
Author manuscript
J Immunol
. Author manuscript; available in PMC 2017 November 01.Published in final edited form as:
J Immunol. 2016 November 1; 197(9): 3504–3511. doi:10.4049/jimmunol.1501600.
A
uthor Man
uscr
ipt
A
uthor Man
uscr
ipt
A
uthor Man
uscr
ipt
A
uthor Man
uscr
Keywords
Autoimmunity; T cells; Cell trafficking
INTRODUCTION
Type 1 diabetes (T1D) is a T cell-mediated autoimmune disease in which the insulin-secreting β cells of the islets of Langerhans are destroyed. Diabetogenic CD4+ and CD8+ T cells are stimulated by β cell-antigen laden APC in the draining pancreatic lymph nodes (PLN), and then traffick to the islets to mediate inflammation and ultimately β cell destruction (1-4). To date, most immunotherapies have focused on targeting T cells as a means to prevent and/or treat T1D (5-11). We and others have applied Ab specific for CD4 and CD8 to manipulate coreceptor molecule signaling and the activity of pathogenic CD4+ and CD8+ T cells, as well as Foxp3-expressing regulatory CD4+ T cells (12-17). Binding of CD4 and CD8 to MHC-peptide complexes results in activation of the Src kinase p56lck (Lck) and downstream signaling events that directly impact TCR signaling, as well as modulate T cell activation either positively or negatively in a TCR-independent manner (18). Ab blockade of CD4 or CD8 for instance, induces a hyporesponsive phenotype by
increasing the threshold for T cell activation (19, 20). Recently, we reported that a short course of nondepleting αCD4 and αCD8 Ab induces rapid remission in new onset diabetic NOD mice (14). Once established, remission is indefinite and normal immunity unperturbed in treated NOD mice. Strikingly, induction of remission by coreceptor therapy is marked by a significant decrease in T cell cellularity in both the PLN and islets, but not in noninflamed tissue such as the spleen. This “purging” is independent of apoptosis induction, suggesting a novel scenario in which the trafficking properties of PLN and islet resident T cells are altered by Ab binding to CD4 and CD8. The latter is consistent with earlier findings demonstrating that binding of HIV gp120 to CD4 affects human T cell chemotaxis in vitro (21). Furthermore IL-16, a CD4 binding ligand, promotes trafficking of β cell-specific type 1 effectors to the pancreas of NOD mice (22).
T cells in general are highly migratory (23), continually cycling between lymphatics and blood (24), and entering sites of inflammation (25, 26). Migration is an active process requiring polarization of T cells and interactions that include chemokines and adhesion molecules (27-31). T cell polarization is characterized by rearrangement of the actin cytoskeleton to form a leading edge in the direction of migration, with a retracting tail at the posterior of the cell (32). The small Rho GTPases Rac1, Rac2, RhoA and Cdc42 play a key role in regulating actin cytoskeleton reorganization induced by TCR and/or chemokine receptor (CKR) signaling (33, 34). Rho GTPases are tightly controlled and the transition from an inactive GDP-bound to an active GTP-bound state is regulated by various guanine nucleotide exchange factors (GEF) (35, 36).
Rac regulates T cell migration by inducing a branch actin network termed the lamellipodia at the leading edge, which becomes clustered with CKR such as CCR2, CCR5, and CXCR4 (37, 38). Clustering of adhesion molecules to the poles, such as LFA-1, which slow circulating T cells and facilitate transendothelial migration from blood to lymphatics and
A
uthor Man
uscr
ipt
A
uthor Man
uscr
ipt
A
uthor Man
uscr
ipt
A
uthor Man
uscr
vice versa, as well as promote T cell scanning of APC (32, 39, 40). Rac activation influences various aspects of T cell migration including entry and egress of lymphoid tissues, and entry into target tissues (31). The different outcomes of Rac activation in T cells is contextual, and partly attributed to the identity of the activating RacGEF, which include the Vav, Tiam, and Dock families (33, 41-45). Dock2 promotes T cell homing to lymph nodes (46), whereas Tiam1-mediated Rac activation is associated with T cell adhesion and transendothelial migration (43). Furthermore, the recruitment of a given RacGEF and induction of downstream effectors of Rac are dependent on the nature of the stimulus. For instance distinct RacGEF and Rac effectors are activated by TCR and particular CKR (34, 47).
In the current study, the effects of αCD4 Ab binding on the migratory properties of T cells in the PLN of NOD mice were investigated. We show for the first time that αCD4 Ab alters CD4+ T cell migration due to inflammation-dependent activation of Rac. These findings establish a novel pathway by which CD4 regulates T cell function and migration, which is independent and distinct from the classical TCR signaling cascade.
MATERIALS AND METHODS
Mice and treatments
NOD/LtJ and NOD.Cg-Tg(TcraBDC2.5)1Doi Tg(TcrbBDC2.5)2Doi/DoiJ (NOD.BDC) mice were bred and maintained in specific pathogen-free facilities at the University of North Carolina at Chapel Hill (UNC-CH). All animal experiments were approved by the UNC-CH Institutional Animal Care and Use Committee.
12 wk-old nondiabetic NOD female mice were used for all experiments. Animals received a single i.p. injection of 600 μg of the αCD4 clone YTS177.9 or 2A3, a rat IgG2a isotype control (BioXCell). In some experiments NOD mice were injected i.p. with 75 mg/kg of Ly294002 (LC Laboratories) 6 h prior to Ab treatment, and then daily for 3 d. Alternatively, NOD mice received 3 mg/kg of NSC237666 (Santa Cruz Biotechnology) i.p. 2 h prior to Ab treatment, and then every 12 h for 3 d. For calcineurin inhibition, NOD mice were injected i.p. with 1 mg/kg of FK506 (Abcam) 6 h prior to Ab treatment, and then daily for 5 d.
Primary cell isolation
Spleen and PLN suspensions were prepared by mechanical dissociation, RBC lysed with ACK buffer, and single cells filtered through a 40 μM nylon cell strainer (Corning). Peripheral blood lymphocytes were isolated from 25 μl of blood using Lympholyte M (Cedarlane) per manufacturers’ instructions. CD4+ T cell enrichment was performed on an Automacs Separator using a CD4 T cell isolation kit according to the manufacturer’s specifications (Miltenyi).
Ab
Ab used for FACS and confocal microscopy were purchased from eBiosciences, Abcam, Cell Signaling, Santa Cruz Biotechnology and R&D Systems. Ab specific for CD3 (145-2C11), LFA-1 (M17/4), CD4 (RM4-4), CD8 (53-6.7), CD62L (MEL-14), CXCR4 (L276F12; rat IgG2b), S1PR1 (713412; rat IgG2a), rat IgG2a (RTK2758), and rat IgG2b
A
uthor Man
uscr
ipt
A
uthor Man
uscr
ipt
A
uthor Man
uscr
ipt
A
uthor Man
uscr
(RTK4530) were used for FACS. Ab specific for Rac1 (O.T.127), Rac2 (goat polyclonal), Lck (rabbit polyclonal), Lck pTyr505 (rabbit polyclonal), Lck pTyr394 (rabbit polyclonal), and AKT pSer473 (rabbit polyclonal) were employed for immunoblotting.
The YTS177.9 hybridoma was a gift from Dr. Waldmann (Oxford, UK); YTS177 Ab was purified via ammonium sulfate precipitation from culture supernatants.
Flow cytometry and microscopy
For flow cytometry, single cell suspensions were stained on ice with Ab in PBS+2% FBS with 1 mM EDTA. Dead cells were excluded by Live/Dead Fixable Yellow stain (Life Technologies). Where appropriate, cells were fixed with 1.5% paraformaldehyde in PBS +2% FBS. Flow cytometric data was acquired at the UNC-CH Flow Cytometry Facility using a Cyan cytometer (DakoCytomation), and analyzed with Summit (DakoCytomation) or FlowJo (Tree Star Inc) software.
For microscopy, tissues were homogenized directly in 1.5% paraformaldehyde in PBS+2% FBS, and stained with anti-CD3 (145-2C11), anti-LFA-1 (M17/4), and Alexa
488-conjugated phalloidin (Life Technologies). Confocal microscopy data was acquired at the UNC-CH Microscopy Services Laboratory using the Olympus FV500 Confocal Laser Scanning microscope. Image analysis was completed using either Image J software (NIH).
Adoptive transfer and measurement of T cell entry into lymphoid tissues
Donor NOD.BDC mice were injected i.p with 600 μg of YTS177 or 2A3 or 100 μg of
αCD11α (M17/4; BioXCell) and αCD49d (Clone PS2; BioXCell), and 12 h later BDC CD4+ T cells purified from the spleen via magnetic beads (Miltenyibiotech). BDC CD4+ T cells from 2A3 (0.5 μM) or YTS177 and αCD11α/αCD49d (5.0 μM) were differentially labeled with CellTrace Violet (CTV; Sigma), and co-transferred (YTS177/2A3; αCD11α +αCD49d/2A3; 2A3/2A3) at a 1:1 ratio into 10 wk-old NOD female mice. 12 hr post-transfer, labeled T cells were identified via flow cytometry in the PLN and spleen of NOD recipients.
In vitro migration assay
Cell migration assays were performed in transwell plates (Corning) of 6.5-mm diameter with 5-μm pore filters. The upper transwell plate was either left uncoated or coated with 10 μg/ml collagen IV, or a primary mouse endothelial cell (EC) monolayer. Pulmonary EC were isolated from 1 wk-old NOD mice as described (48), and grown in EGM-2 Bullet Kit (Lonza). T cells (5×10⁵) suspended in Aim V medium (Life Technologies) were rested for 1 h and then cultured in the upper chamber. Migration to the lower chamber in response to murine sphingosine-1-phosphate (S1P; Sigma) or CXCL12 (Sigma) at 37°C and 5% CO2 was measured after 4 h by flow cytometry, and enumerated using AccuCheck counting beads (Life Technologies).
Preparation of GST-PBD and GST-RhoAG17A and pulldown assay
pGEX GST-PBD and pGEX GST-RhoAG17A fusion proteins were prepared from lysates from Bl21 E. coli cells induced with 100 μM IPTG for 16 h at 24°C. For GST-PBD,
A
uthor Man
uscr
ipt
A
uthor Man
uscr
ipt
A
uthor Man
uscr
ipt
A
uthor Man
uscr
bacterial cells were lysed in 20 mM Tris pH 7.8, 1% Triton X-100, 10 mM MgCl2 1 mM DTT, 1mM PMSF, and 10 μg/ml aprotinin and leupeptin. For GST-RhoAG17A, bacterial cells were lysed in 20 mM HEPES pH 7.8, 150 mM NaCl, 10 mM MgCl2, 1mM PMSF, and 10 μg/ml aprotinin and leupeptin. Recombinant proteins were isolated with glutathione-Sepharose 4B beads (GE Healthcare) at 4°C for 4 h. The beads were sedimented and washed 3 times in 20 mM HEPES, pH 7.5, 150 mM NaCl, and 1 mM DTT.
Rac activation assays were performed as described (49). Briefly, T cells were lysed in 300 μL of 10 mM MgCl2, 500 mM NaCl, 50 mM Tris, pH 7.8, 1% Triton X-100, 0.1% SDS, 0.5% deoxycholate, 1mM PMSF, and 10 μg/ml aprotinin and leupeptin. Lysates were cleared at 14,000g at 4°C for 3 min and incubated with ≥ 20 μg of GST-PBD for 20 min at 4°C. Beads were then washed 3 times in 50 mM Tris, pH 7.4, 10 mM MgCl2, 150 mM NaCl, 1% Triton X-100, 1mM PMSF, and 10 μg/ml aprotinin and leupeptin. Active GEF were assayed by binding to GST-RhoAG17A as described (50) with the following changes. T cells were lysed in 150 mM NaCl, 20 mM HEPES, pH 7.6, 10 mM MgCl2, 1% Triton X-100 1mM PMSF, and 10 μg/ml aprotinin and leupeptin, and incubated with GST-RhoAG17A beads for 1 h at 4°C, and washed in the same lysis buffer. Samples were then analyzed by Western blot.
Enrichment of phospho-tyrosine containing proteins
Cells were lysed in preheated gel sample buffer containing 200 mM Tris pH 6.8, 20% glycerol, 4% SDS and 5% 2-ME, and boiled for 5 min and DNA sheared. Samples were then diluted with 20 volumes of 20 mM Tris, pH 7.5, 150 mM NaCl, 1% Triton X-100 and 1% deoxycholate, 10 μg/ml othrovanidate, 1mM PMSF, and 10 μg/ml aprotinin and leupeptin, 2 μg of αphospho-tyrosine Ab (PY-20) for 2 h at 4°C. Protein G-Sepharose was then added and samples rotated for 2 h at 4°C. Beads were washed in dilution buffer and analyzed by Western blot.
Western blotting
Samples were run on SDS-PAGE gels and transferred to polyvinylidene fluoride membranes (Millipore). Membranes were blocked and incubated with primary Ab followed by goat
αmouse or goat αrat secondary Ab conjugated with horseradish peroxidase. Blots were developed with a chemiluminescent HRP substrate, and visualized on x-ray film or ChemiDoc™ MP System (BioRad) and corresponding software. For quantification, blots were scanned and the intensity values determined using Image J software (NIH) and protein levels normalized to control protein levels.
Quantitative real-time PCR
PLN CD4+ T cells were isolated via MACS CD4 negative selection (Miltyni), RNA prepared using the QIAshredder and RNeasy PLUS columns (Qiagen), and cDNA synthesized using SuperScript III (Life Technologies) according to manufacturers’ recommendations. cDNA was amplified via a Maxima SYBR green master mix (Thermo-Fisher) and an ABI Prism 7500 (Applied Biosystems). Ct values were calculated by the ΔΔCt method and ABI Sequence Detection System software.
A
uthor Man
uscr
ipt
A
uthor Man
uscr
ipt
A
uthor Man
uscr
ipt
A
uthor Man
uscr
Lentivirus vector knockdown of Rac1 and Rac2
Lentivirus vectors were produced by the UNC-CH Lenti-shRNA Core Facility using methods described (51). Vectors were constructed with shRNA sequences identified in the UNC shRNA library specific for 5 regions of Rac1 (NM_009007), Rac2 (NM_00908), or β -globulin (control). For lentivirus vector transduction, PLN-derived T cells were cultured in either Aim V or RPMI plus 10% FBS and stimulated with 1 μg/ml αCD3 (145-2C11), 2 μg/ml αCD28 (37.51), and 100 U/ml IL-2 (Peprotech) for 24 h. Lentivirus vector particles (>5×10⁴ IU) were added to the cultures for 24 h, after which T cells were washed, and cultured for 72 h with 5 μg/ml puromycin. Transduction efficiency was determined to be >75%. Live cells were isolated via gradient centrifugation utilizing Lympholyte M.
Statistics
Data represent mean ± SEM. Statistical comparisons of differences between sample means used the two-tailed Student’s t test and was calculated using Prism (Version 6.0; GraphPad).
RESULTS
αCD4 induced purging of PLN is associated with increased T cell polarization
Reversal of diabetes in NOD mice by αCD4 (YTS177) and αCD8 (YTS105) Ab is marked by purging of CD4+ and CD8+ T cells from the PLN and pancreas 6 d post-treatment, which is independent of apoptosis induction (14). To define the short-term effects of coreceptor therapy on CD4+ T cells, 12 wk-old pre-diabetic NOD mice were treated with YTS177 or the isotype control 2A3, and T cells assessed via flow cytometry. At 24 h post-YTS177 treatment PLN and splenic CD4+ T cells exhibited an ~4-fold reduction in surface CD4 expression (Fig. 1A, Supplementary Fig. 1). Surface levels of CD62L and LFA-1 (CD11α) were also significantly reduced by YTS177 binding (Fig. 1A, Supplementary Fig. 1). Furthermore, YTS177 induced up to a 2-fold reduction in PLN CD4+ T cell numbers over 24 h (Fig. 1B). In contrast, the number of splenic CD4+ T cells was increased in YTS177 versus 2A3-teated animals within this time period (Fig. 1B). In addition, YTS177 induced a 25% increase in T cells in peripheral blood 72 h post-Ab treatment (Fig. 1C).
YTS177-mediated T cell purging may be due to blockade of TCR signaling, which influences T cell trafficking properties. Indeed, YTS177 binding of CD4 in vivo resulted in increased phosphorylation of pTyr505, the inhibitory isoform of Lck (Supplementary Fig. 2A). Accordingly, NOD mice were treated with the calcineurin inhibitor FK506. Blocking downstream TCR signaling alone did not decrease PLN CD4+ T cell numbers, nor was YTS177-induced purging of PLN CD4+ T cells altered, although an increase in splenic CD4+ T cells was observed (Fig. 1D). Therefore, blockade of TCR signaling is insufficient to promote and/or prevent PLN T cell purging, suggesting that additional events induced by YTS177 binding are necessary.
In support of the latter, morphological analysis via confocal microscopy after YTS177 treatment showed an ~2-fold increase in polarized T cells in the PLN but not the spleen (Fig. 1E). These T cells displayed an oblong morphology with F-actin and LFA-1 localized to the cellular poles, typical of a T cell migratory phenotype (Fig. 1F). Together these results
A
uthor Man
uscr
ipt
A
uthor Man
uscr
ipt
A
uthor Man
uscr
ipt
A
uthor Man
uscr
demonstrate that PLN T cell purging is induced shortly after Ab binding to CD4, which is independent of TCR signaling and reflected by a phenotype consistent with T cell migration.
Ab binding of CD4 has no effect on PLN entry by CD4+ T cells
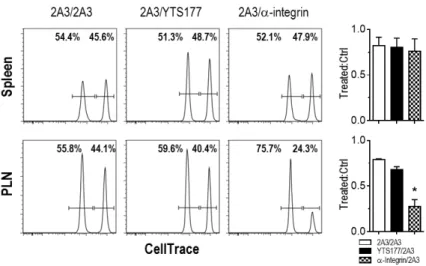
One possible explanation for the decreased PLN CD4+ T cells is that YTS177 binding blocked trafficking of CD4+ T cells into the PLN, while tissue egress was unaffected. For instance LFA-1 (CD11α) and CD62L expression, which was reduced on CD4+ T cells by YTS177 binding (Fig. 1A) are required for efficient T cell entry into lymphoid tissue. NOD.BDC mice transgenic for the diabetogenic BDC2.5 TCR were treated with either YTS177 or 2A3. YTS177 and 2A3-treated BDC CD4+ T cells were isolated from the spleen 12 h later, differentially labeled with CTV, and then co-transferred at an equal ratio into NOD recipients. Included were splenic BDC CD4+ T cells isolated from NOD.BDC mice injected with αCD11α and αCD49d Ab, which block lymph node entry by T cells (52). As expected trafficking of αCD11α/αCD49d Ab-bound BDC CD4+ T cells into the PLN, but not the spleen, was significantly reduced (e.g. ~4-fold) relative 2A3-treated cells (Fig. 2). In contrast, the ratio of YTS177- versus 2A3-treated BDC CD4+ T cells was reduced only minimally in the PLN; whereas trafficking to the spleen was unaffected by YTS177 (Fig. 2). These results indicate that YTS177 binding has no significant effect on CD4+ T cell entry into the PLN.
Ab binding of CD4 enhances CD4+ T cell migration in vitro
The above results suggested that PLN purging by YTS177 binding was due to altered T cell migratory properties resulting in tissue egress. Migration of T cells from lymph nodes into blood (Fig. 1C) is controlled at least in part by circulating cues regulating tissue egress, such as S1P. Accordingly, CD4+ T cells were isolated from the PLN of NOD mice 24 h post-treatment with YTS177 or 2A3, and chemotaxis towards S1P across a 5 μm transwell measured. The frequency of YTS177-bound PLN CD4+ T cells migrating in response to S1P was increased up to 3-fold compared to PLN CD4+ T cells from 2A3-treated NOD mice (Fig. 3A). Notably, YTS177 also enhanced PLN CD4+ T cell migration towards the CXCR4 ligand CXCL12 up to 2-fold, relative to PLN CD4+ T cells from control NOD mice (Fig. 3B).
PLN CD4+ T cells from YTS177-treated NOD mice also exhibited similar enhanced S1P migration under progressively more stringent barrier conditions. S1P-mediated chemotaxis of PLN CD4+ T cells from YTS177- versus 2A3-treated NOD mice was increased 2.5-fold in transwells coated with collagen (Fig. 3C). An analogous 2.5-fold increase in S1P migration was seen for YTS177-bound PLN CD4+ T cells when a monolayer of endothelial cells was cultured on the surface of the transwells (Fig. 3D). Importantly, under the
conditions tested, chemotaxis of CD8+ T cells which were included was unaffected, demonstrating that enhanced migration was due to intrinsic effects of YTS177 binding to CD4 (Fig. 3C,D). Furthermore, in vivo YTS177 binding did not increase mRNA or surface protein expression of S1P1 receptor (r) and CXCR4 in PLN (or splenic) CD4+ T cells (Fig. 3E,F). Taken together, these results indicate that YTS177 binding enhances CD4+ T cell migration in response to different chemotactic cues.
A
uthor Man
uscr
ipt
A
uthor Man
uscr
ipt
A
uthor Man
uscr
ipt
A
uthor Man
uscr
Signaling downstream of CD4 engagement results in tissue-specific Rac activation
The small RhoGTPases Rac1 and Rac2 regulate actin cytoskeletal reorganization and migration of T cells. With this in mind, a role for Rac1 and/or Rac2 signaling downstream of CD4 engagement was investigated. NOD mice were treated with YTS177 or 2A3, T cells isolated from the PLN at various times, and activated Rac1 and Rac2 isolated from lysates via pull-down and analyzed by immunoblot. The level of active Rac1 and Rac2 was normalized to total levels for the two respective GTPases. YTS177 induced a temporal increase in both Rac1 and Rac2 activation relative to 2A3 controls in PLN T cells (Fig. 4A). Rac1 activation was detected by 1 h post-YTS177 treatment, and peaked by 6 h, resulting in an ~3-fold increase versus the 2A3 control (Fig. 4A). A similar temporal profile was seen for Rac2 activation in YTS177-bound PLN T cells; at 6 h, activation of Rac2 was ~8-fold greater relative to the 2A3 control (Fig. 4A). Notably, no increase in either Rac1 or Rac2 activation was detected in splenic T cells isolated 6 h post-YTS177 treatment (Fig. 4B).
To determine if increased T cell migration (Fig. 3) was dependent on Rac activation, PLN T cells were transduced in vitro with lentiviral vectors encoding Rac1- and Rac2-specific shRNA, and migration in response to CXCL12 assessed. Protein expression of both Rac1 and Rac2 was significantly knocked-down in T cells transduced with Rac1- and Rac2-specific shRNA, respectively, and selected with puromycin (Supplementary Fig. 2B). As expected, non-transduced T cells, and T cells transduced with a control shRNA specific for
β-globulin, displayed a significant increase in CXCL12 migration following YTS177 versus 2A3 binding in vitro (Fig. 4C). In contrast, YTS177 failed to increase CXCL12 migration for T cells transduced with Rac1- or Rac2-specific shRNA alone, or with the respective shRNA combined (Fig. 4C).
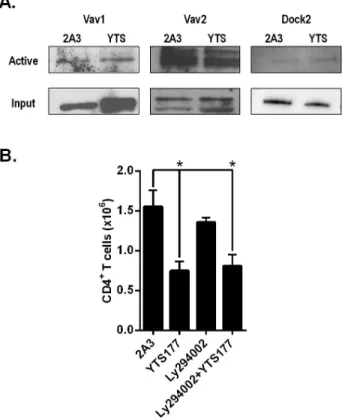
Next an effort was made to identify the upstream GEF activating Rac1 and Rac2, and better define the signaling pathway induced by CD4 engagement. Initially, all activated RacGEF were isolated from PLN T cells by a Rac.G15A pulldown, and analyzed via immunoblot. No increase in activation of the known T cell RacGEF Vav1, Vav2, and Dock2 was detected in PLN T cells from YTS177 treated NOD mice (Fig. 5A). PI3K signaling in T cells is associated with activation of the RacGEF Vav1, Dock2, and Tiam1. YTS-mediated egress of PLN CD4+ T cells was unaffected by treating NOD mice with the PI3K inhibitor Ly294002 (Fig. 5B), despite efficient PI3K inhibition marked by reduced steady state phosphorylation of AKT (Supplementary Fig. 2C). The latter finding is consistent with results obtained after active RacGEF pulldown (Fig. 5A). Taken together, these data provide evidence that the enhanced migratory phenotype induced by CD4 engagement is dependent on tissue-specific Rac1 and Rac2 activation, which in turn is regulated by a RacGEF independent of some the known T cell RacGEF.
DISCUSSION
A striking feature of the β cell-specific tolerance induced by coreceptor therapy is the purging of PLN and islet T cells in NOD mice. Our findings indicate that T cell purging is the result of modified trafficking properties established by αCD4 Ab binding that is dependent on activation of Rac1 and Rac2, leading to altered tissue retention and egress.
A
uthor Man
uscr
ipt
A
uthor Man
uscr
ipt
A
uthor Man
uscr
ipt
A
uthor Man
uscr
The rate of T cell entry and egress contribute to the size of the resident T cell pool in lymphoid tissue. Therefore YTS177-induced purging of PLN CD4+ T cells may be due to blockade of T cell entry coupled with continued egress, and/or enhanced T cell egress. YTS177-bound BDC CD4+ T cells, however, entered and accumulated in the PLN similar to control treated T cells (Fig. 2). On the other hand, entry of transferred BDC CD4+ T cells bound by αCD11α and αCD49d into the PLN was markedly reduced (Fig. 2), consistent with the lymph node blockade induced by αCD11α and αCD49d shown by the Cyster group (52). These results suggest that CD4+ T cell entry into the PLN is not impacted, although minor perturbations cannot be ruled out. Efforts to determine if T cell egress is accelerated by YTS177 have been complicated by the rapid and robust nature of PLN T cell egress under “homeostasis” in NOD mice. For instance, complete blockade of T cell entry via αCD11α and αCD49d treatment, so that ongoing egress can be directly measured (52), resulted in >10-fold reduction in CD4+ (and CD8+) T cell numbers by 24 h in the PLN of NOD mice (Supplementary Fig. 3C). PLN purging by αCD11α and αCD49d was in fact more effective than YTS177, which reduced CD4+ T cells by ~2-fold after 24 h (Fig. 1B). This difference may be due to ongoing T cell entry (Fig. 2) that offsets, to a certain degree, T cell egress following YTS177 treatment. To better define the kinetics of egress following YTS177 treatment, comparisons were drawn between YTS177 plus αCD11α and αCD49d versus αCD11α and αCD49d-alone. However not surprisingly, in view of the robustness of CD11α and CD49d Ab-blockade, no marked difference was seen in PLN T cell purging among the respective groups (Supplementary Fig. 3D). A direct effect of YTS177 on PLN T cell egress still needs to be established. Nevertheless, our findings clearly demonstrate that YTS177 influences the dynamics of PLN T cell migration.
YTS177 treatment resulted in a variety of in vivo changes in PLN T cells which included a polarized morphology, downregulation of adhesion molecules, and enhanced reactivity to chemoattractants (Figs. 1,3). The increase in the frequency of polarized PLN T cells was explained by activation of Rac1 and Rac2 (Fig. 4), which are key regulators of cytoskeletal reorganization needed for T cell migration. Downregulation of LFA-1 would also be expected to enhance T cell egress from the PLN by reducing ICAM binding. For example, LFA-1 deficient T cells exhibit accelerated lymph node egress (53), and LFA-1 blockade promotes exit of naïve T cells from the lymph nodes into blood (54). Supporting these and our own observations is a report showing that LFA-1-mediated adhesion is decreased by in vitro αCD4 Ab binding to T cells (55). Chemotaxis assays provided direct evidence that YTS177 enhanced PLN T cell migration. Migration in response to S1P under increasingly stringent barrier conditions, as well as CXCL12 chemotaxis were elevated 2-3-fold by YTS177 binding in vivo (Fig. 3) and in vitro (Fig. 4C). Neither S1P1r nor CXCR4 expression was increased (Fig. 3), suggesting that CD4 signaling enhances migration independent of modulating the level of CKR expression, which is consistent with enhanced clustering seen in polarized T cells. Whether the activity of other CKR is similarly affected by YTS177 needs to be determined. CD4 binding ligands such as HIV gp120 and IL-16 have been reported to modulate CD4+ T cell migration (21, 22). However, in contrast to YTS177, CD4 binding by HIV-1 gp120 blocks S1P chemotaxis, whereas IL-16 desensitizes CXCR4 activity and blocks CXCL12 chemotaxis (56, 57). These findings suggest that distinct effects on T cell migration are established depending on the nature of CD4
A
uthor Man
uscr
ipt
A
uthor Man
uscr
ipt
A
uthor Man
uscr
ipt
A
uthor Man
uscr
engagement. Also whether CD4 binding occurs under homeostasis versus ongoing
inflammation is also expected to determine how T cell migratory properties are influenced. Indeed, T cell purging by YTS177 in NOD mice was also detected in other lymph nodes, such as the brachial lymph nodes, which exhibit levels of IFNγ expression and in turn ongoing inflammation that are comparable to PLN (Supplementary Fig. 3A,B).
It is well established that TCR and CKR signaling induces Rac activation that leads to T cell polarization and migration. Our data demonstrate for the first time that CD4 signaling also activates the Rac pathway (Fig. 4). HIV-1 has been shown to activate Rac1 to facilitate membrane fusion events during infection, but this is attributed to binding of CCR5 and CXCR4, and not CD4 (21). Rac activation by PLN CD4+ T cells was an early event, detected within 1 h of YTS177 treatment (Fig. 4A). Noteworthy is that significant T cell purging was detected within 24 h post YTS177 injection (Fig. 1B), when high levels of Rac1 and Rac2 activation were detected (Fig. 4A). Importantly, Rac1 and Rac2 activation was necessary for enhanced T cell migration; YTS177 failed to increase CXCL12 chemotaxis after knockdown of Rac1 and/or Rac2 protein expression (Fig. 4C). Interestingly, knockdown of Rac1 and/or Rac2 had no marked effect on the capacity of control 2A3-treated T cells (e.g. untransduced, β-globulin transduced) to migrate in response to CXCL12 (Fig. 4C). This may reflect activation of other RhoGTPases due to the in vitro preparation of the respective CD4+ T cell pools, which in turn enabled CXCL12 chemotaxis in a Rac1/2-independent manner. Similarly, it is possible that additional RhoGTPases also regulate events induced following Ab binding of CD4. The novelty of CD4-mediated Rac activation was further highlighted in analyses of candidate RacGEF. Pulldown of all activated RacGEF and inhibition of relevant upstream signaling effectors showed that RacGEF known to be associated with TCR signaling and/or T cell migration (e.g. Vav1, Vav2, Dock2, Tiam1) were not activated following YTS177 binding (Fig. 5). This result argues for a scenario in which CD4 engages an “atypical T cell” RacGEF for Rac1 and Rac2 activation. Our data also suggest that activation of the Rac pathway is independent of CD4-mediated Lck signaling since YTS177 induced an increase in the inhibitory Lck isoform in vivo (Supplementary Fig. 2A).
Of particular interest was that activation of Rac1 and Rac2 correlated with ongoing
inflammation. YTS177-induced Rac activation was detected in CD4+ T cells in the PLN but not the spleen (Fig. 4); the former being a site of established inflammation. We propose that prior T cell activation and/or local inflammatory mediators “pre-sensitize” resident T cells, and upon YTS177 binding to CD4, distinct signals (e.g. Rac activation) are elicited that influence migratory properties. Not all effects of YTS177 were inflammation-dependent; T cell expression of LFA-1 and CD62L for instance was reduced for both PLN and splenic CD4+ T cells (Fig. 1A, Supplementary Fig. 1B,C). Here, it is thought that these systemic effects combined with inflammatory induced “pre-sensitization” are needed to effectively alter T cell migration. Ongoing efforts indicate that coreceptor therapy suppresses
proinflammatory cytokine production by islet and PLN resident T cells. Consequently, the local inflammatory milieu is dampened, including expression of various chemokines such as CXCL12, which function as retention cues (58). Lack of signals required for local retention coupled with altered migratory properties permit enhanced T cell egress. Of keen interest is
A
uthor Man
uscr
ipt
A
uthor Man
uscr
ipt
A
uthor Man
uscr
ipt
A
uthor Man
uscr
how inflammation “reprograms” T cell responsiveness to coreceptor signal transduction, leading to migration.
In summary, our data supports a model where Ab-mediated CD4 engagement of T cells found in an inflammatory milieu elicits signaling independent of the TCR, resulting in Rac1 and Rac2 activation. Rac1 and Rac2 act as molecular switches regulating migration, and promoting T cell tissue egress in the absence of retention cues. The ability to control Rac activation and migration provides a unique approach to manipulate T cell-mediated autoimmunity and other pathological inflammatory responses.
Supplementary Material
Refer to Web version on PubMed Central for supplementary material.
Acknowledgments
This study was supported by funding from the National Institutes of Health to R.T. (1R01DK100256), K.B. (HL114388, GM029860), and the pre-doctoral training grants for ECLM from the NIH (T32 HL069768) and the American Heart Association (12PRE11780065). The UNC Flow Cytometry Core Facility is supported in part by P30 CA016086 Cancer Center Core Support Grant to the UNC Lineberger Comprehensive Cancer Center.
Abbreviations
CKR chemokine receptor
CTV CellTrace Violet
EC endothelial cell
GEF guanine nucleotide exchange factor
PLN pancreatic lymph node
S1P sphingosine-1-phosphate
T1D Type 1 diabetes
REFERENCES
1. Bluestone JA, Herold K, Eisenbarth G. Genetics, pathogenesis and clinical interventions in type 1 diabetes. Nature. 2010; 464:1293–1300. [PubMed: 20432533]
2. Signore A, Pozzilli P, Gale EA, Andreani D, Beverley PC. The natural history of lymphocyte subsets infiltrating the pancreas of NOD mice. Diabetologia. 1989; 32:282–289. [PubMed: 2666213] 3. Tisch R, McDevitt H. Insulin-dependent diabetes mellitus. Cell. 1996; 85:291–297. [PubMed:
8616883]
4. Yagi H, Matsumoto M, Kunimoto K, Kawaguchi J, Makino S, Harada M. Analysis of the roles of CD4+ and CD8+ T cells in autoimmune diabetes of NOD mice using transfer to NOD athymic nude mice. Eur J Immunol. 1992; 22:2387–2393. [PubMed: 1516628]
5. Maurice Morillon Y 2nd, Martin A, Gojanovich G, Wang B, Tisch R. Reestablishing T Cell Tolerance by Antibody-Based Therapy in Type 1 Diabetes. Arch Immunol Ther Exp (Warsz). 2015 6. Staeva TP, Chatenoud L, Insel R, Atkinson MA. Recent lessons learned from prevention and
recent-onset type 1 diabetes immunotherapy trials. Diabetes. 2013; 62:9–17. [PubMed: 23258904]
A
uthor Man
uscr
ipt
A
uthor Man
uscr
ipt
A
uthor Man
uscr
ipt
A
uthor Man
uscr
7. Perruche S, Zhang P, Liu Y, Saas P, Bluestone JA, Chen W. CD3-specific antibody-induced immune tolerance involves transforming growth factor-beta from phagocytes digesting apoptotic T cells. Nat Med. 2008; 14:528–535. [PubMed: 18438416]
8. Chatenoud L, Bluestone JA. CD3-specific antibodies: a portal to the treatment of autoimmunity. Nat Rev Immunol. 2007; 7:622–632. [PubMed: 17641665]
9. Belghith M, Bluestone JA, Barriot S, Megret J, Bach JF, Chatenoud L. TGF-beta-dependent mechanisms mediate restoration of self-tolerance induced by antibodies to CD3 in overt autoimmune diabetes. Nat Med. 2003; 9:1202–1208. [PubMed: 12937416]
10. Herold KC, Hagopian W, Auger JA, Poumian-Ruiz E, Taylor L, Donaldson D, Gitelman SE, Harlan DM, Xu D, Zivin RA, Bluestone JA. Anti-CD3 monoclonal antibody in new-onset type 1 diabetes mellitus. N Engl J Med. 2002; 346:1692–1698. [PubMed: 12037148]
11. Cooke A, Phillips JM, Parish NM. Tolerogenic strategies to halt or prevent type 1 diabetes. Nat Immunol. 2001; 2:810–815. [PubMed: 11526391]
12. Fehervari Z, Cooke A, Brett S, Turner J. Perturbation of naive TCR transgenic T cell functional responses and upstream activation events by anti-CD4 monoclonal antibodies. Eur J Immunol. 2002; 32:333–340. [PubMed: 11807772]
13. Graca L, Le Moine A, Cobbold SP, Waldmann H. Antibody-induced transplantation tolerance: the role of dominant regulation. Immunol Res. 2003; 28:181–191. [PubMed: 14713713]
14. Yi Z, Diz R, Martin AJ, Morillon YM, Kline DE, Li L, Wang B, Tisch R. Long-term remission of diabetes in NOD mice is induced by nondepleting anti-CD4 and anti-CD8 antibodies. Diabetes. 2012; 61:2871–2880. [PubMed: 22751694]
15. Davies JD, Leong LY, Mellor A, Cobbold SP, Waldmann H. T cell suppression in transplantation tolerance through linked recognition. J Immunol. 1996; 156:3602–3607. [PubMed: 8621893] 16. Phillips JM, Parish NM, Raine T, Bland C, Sawyer Y, De La Pena H, Cooke A. Type 1 diabetes
development requires both CD4+ and CD8+ T cells and can be reversed by non-depleting antibodies targeting both T cell populations. Rev Diabet Stud. 2009; 6:97–103. [PubMed: 19806239]
17. Waldmann H, Adams E, Cobbold S. Reprogramming the immune system: co-receptor blockade as a paradigm for harnessing tolerance mechanisms. Immunol Rev. 2008; 223:361–370. [PubMed: 18613847]
18. Julius M, Maroun CR, Haughn L. Distinct roles for CD4 and CD8 as co-receptors in antigen receptor signalling. Immunol Today. 1993; 14:177–183. [PubMed: 8499078]
19. Chirmule N, Avots A, LakshmiTamma SM, Pahwa S, Serfling E. CD4-mediated signals induce T cell dysfunction in vivo. J Immunol. 1999; 163:644–649. [PubMed: 10395653]
20. Pullar CE, Morris PJ, Wood KJ. Altered proximal T-cell receptor signalling events in mouse CD4+ T cells in the presence of anti-CD4 monoclonal antibodies: evidence for reduced phosphorylation of Zap-70 and LAT. Scand J Immunol. 2003; 57:333–341. [PubMed: 12662296]
21. Pontow SE, Heyden NV, Wei S, Ratner L. Actin cytoskeletal reorganizations and coreceptor-mediated activation of rac during human immunodeficiency virus-induced cell fusion. J Virol. 2004; 78:7138–7147. [PubMed: 15194790]
22. Meagher C, Beilke J, Arreaza G, Mi QS, Chen W, Salojin K, Horst N, Cruikshank WW, Delovitch TL. Neutralization of interleukin-16 protects nonobese diabetic mice from autoimmune type 1 diabetes by a CCL4-dependent mechanism. Diabetes. 2010; 59:2862–2871. [PubMed: 20693344] 23. Jacobelli J, Chmura SA, Buxton DB, Davis MM, Krummel MF. A single class II myosin
modulates T cell motility and stopping, but not synapse formation. Nat Immunol. 2004; 5:531– 538. [PubMed: 15064761]
24. Gowans JL, Knight EJ. The Route of Re-Circulation of Lymphocytes in the Rat. Proc R Soc Lond B Biol Sci. 1964; 159:257–282. [PubMed: 14114163]
25. Dustin ML, Bromley SK, Kan Z, Peterson DA, Unanue ER. Antigen receptor engagement delivers a stop signal to migrating T lymphocytes. Proc Natl Acad Sci U S A. 1997; 94:3909–3913. [PubMed: 9108078]
26. Thelen M. Dancing to the tune of chemokines. Nat Immunol. 2001; 2:129–134. [PubMed: 11175805]
A
uthor Man
uscr
ipt
A
uthor Man
uscr
ipt
A
uthor Man
uscr
ipt
A
uthor Man
uscr
27. Barreiro O, Yanez-Mo M, Serrador JM, Montoya MC, Vicente-Manzanares M, Tejedor R, Furthmayr H, Sanchez-Madrid F. Dynamic interaction of VCAM-1 and ICAM-1 with moesin and ezrin in a novel endothelial docking structure for adherent leukocytes. J Cell Biol. 2002;
157:1233–1245. [PubMed: 12082081]
28. Bromley SK, Mempel TR, Luster AD. Orchestrating the orchestrators: chemokines in control of T cell traffic. Nat Immunol. 2008; 9:970–980. [PubMed: 18711434]
29. Butcher EC, Picker LJ. Lymphocyte homing and homeostasis. Science. 1996; 272:60–66. [PubMed: 8600538]
30. McEver RP. Selectins: lectins that initiate cell adhesion under flow. Curr Opin Cell Biol. 2002; 14:581–586. [PubMed: 12231353]
31. von Andrian UH, Mackay CR. T-cell function and migration. Two sides of the same coin. N Engl J Med. 2000; 343:1020–1034. [PubMed: 11018170]
32. Samstag Y, Eibert SM, Klemke M, Wabnitz GH. Actin cytoskeletal dynamics in T lymphocyte activation and migration. J Leukoc Biol. 2003; 73:30–48. [PubMed: 12525560]
33. del Pozo MA, Vicente-Manzanares M, Tejedor R, Serrador JM, Sanchez-Madrid F. Rho GTPases control migration and polarization of adhesion molecules and cytoskeletal ERM components in T lymphocytes. Eur J Immunol. 1999; 29:3609–3620. [PubMed: 10556816]
34. Yu H, Leitenberg D, Li B, Flavell RA. Deficiency of small GTPase Rac2 affects T cell activation. J Exp Med. 2001; 194:915–926. [PubMed: 11581314]
35. Rossman KL, Der CJ, Sondek J. GEF means go: turning on RHO GTPases with guanine nucleotide-exchange factors. Nat Rev Mol Cell Biol. 2005; 6:167–180. [PubMed: 15688002] 36. Van Aelst L, D'Souza-Schorey C. Rho GTPases and signaling networks. Genes Dev. 1997;
11:2295–2322. [PubMed: 9308960]
37. Gomez-Mouton C, Abad JL, Mira E, Lacalle RA, Gallardo E, Jimenez-Baranda S, Illa I, Bernad A, Manes S, Martinez AC. Segregation of leading-edge and uropod components into specific lipid rafts during T cell polarization. Proc Natl Acad Sci U S A. 2001; 98:9642–9647. [PubMed: 11493690]
38. Nieto M, Frade JM, Sancho D, Mellado M, Martinez AC, Sanchez-Madrid F. Polarization of chemokine receptors to the leading edge during lymphocyte chemotaxis. J Exp Med. 1997; 186:153–158. [PubMed: 9207004]
39. del Pozo MA, Nieto M, Serrador JM, Sancho D, Vicente-Manzanares M, Martinez C, Sanchez-Madrid F. The two poles of the lymphocyte: specialized cell compartments for migration and recruitment. Cell Adhes Commun. 1998; 6:125–133. [PubMed: 9823463]
40. Friedl P, Zanker KS, Brocker EB. Cell migration strategies in 3-D extracellular matrix: differences in morphology, cell matrix interactions, and integrin function. Microsc Res Tech. 1998; 43:369– 378. [PubMed: 9858334]
41. Fischer RS, Quinlan MP. Identification of a novel mechanism of regulation of the adherens junction by E1A, Rac1, and cortical actin filaments that contributes to tumor progression. Cell Growth Differ. 1998; 9:905–918. [PubMed: 9831243]
42. Fukui Y, Hashimoto O, Sanui T, Oono T, Koga H, Abe M, Inayoshi A, Noda M, Oike M, Shirai T, Sasazuki T. Haematopoietic cell-specific CDM family protein DOCK2 is essential for lymphocyte migration. Nature. 2001; 412:826–831. [PubMed: 11518968]
43. Gerard A, van der Kammen RA, Janssen H, Ellenbroek SI, Collard JG. The Rac activator Tiam1 controls efficient T-cell trafficking and route of transendothelial migration. Blood. 2009; 113:6138–6147. [PubMed: 19139083]
44. Holsinger LJ, Graef IA, Swat W, Chi T, Bautista DM, Davidson L, Lewis RS, Alt FW, Crabtree GR. Defects in actin-cap formation in Vav-deficient mice implicate an actin requirement for lymphocyte signal transduction. Curr Biol. 1998; 8:563–572. [PubMed: 9601640]
45. Nombela-Arrieta C, Mempel TR, Soriano SF, Mazo I, Wymann MP, Hirsch E, Martinez AC, Fukui Y, von Andrian UH, Stein JV. A central role for DOCK2 during interstitial lymphocyte motility and sphingosine-1-phosphate-mediated egress. J Exp Med. 2007; 204:497–510. [PubMed: 17325199]
46. Nombela-Arrieta C, Lacalle RA, Montoya MC, Kunisaki Y, Megias D, Marques M, Carrera AC, Manes S, Fukui Y, Martinez AC, Stein JV. Differential requirements for DOCK2 and
A
uthor Man
uscr
ipt
A
uthor Man
uscr
ipt
A
uthor Man
uscr
ipt
A
uthor Man
uscr
phosphoinositide-3-kinase gamma during T and B lymphocyte homing. Immunity. 2004; 21:429– 441. [PubMed: 15357953]
47. Guo F, Cancelas JA, Hildeman D, Williams DA, Zheng Y. Rac GTPase isoforms Rac1 and Rac2 play a redundant and crucial role in T-cell development. Blood. 2008; 112:1767–1775. [PubMed: 18579797]
48. Sobczak M, Dargatz J, Chrzanowska-Wodnicka M. Isolation and culture of pulmonary endothelial cells from neonatal mice. J Vis Exp. 2010
49. Ren XD, Kiosses WB, Schwartz MA. Regulation of the small GTP-binding protein Rho by cell adhesion and the cytoskeleton. EMBO J. 1999; 18:578–585. [PubMed: 9927417]
50. Garcia-Mata R, Wennerberg K, Arthur WT, Noren NK, Ellerbroek SM, Burridge K. Analysis of activated GAPs and GEFs in cell lysates. Methods Enzymol. 2006; 406:425–437. [PubMed: 16472675]
51. Xu K, Ma H, McCown TJ, Verma IM, Kafri T. Generation of a stable cell line producing high-titer self-inactivating lentiviral vectors. Mol Ther. 2001; 3:97–104. [PubMed: 11162316]
52. Lo CG, Xu Y, Proia RL, Cyster JG. Cyclical modulation of sphingosine-1-phosphate receptor 1 surface expression during lymphocyte recirculation and relationship to lymphoid organ transit. J Exp Med. 2005; 201:291–301. [PubMed: 15657295]
53. Reichardt P, Patzak I, Jones K, Etemire E, Gunzer M, Hogg N. A role for LFA-1 in delaying T-lymphocyte egress from lymph nodes. EMBO J. 2013; 32:829–843. [PubMed: 23443048] 54. Reisman NM, Floyd TL, Wagener ME, Kirk AD, Larsen CP, Ford ML. LFA-1 blockade induces
effector and regulatory T-cell enrichment in lymph nodes and synergizes with CTLA-4Ig to inhibit effector function. Blood. 2011; 118:5851–5861. [PubMed: 21972294]
55. Trucy M, Barbat C, Fischer A, Mazerolles F. CD4 ligation induces activation of protein kinase C zeta and phosphoinositide-dependent-protein kinase-1, two kinases required for down-regulation of LFA-1-mediated adhesion. Cell Immunol. 2006; 244:33–42. [PubMed: 17408603]
56. Green DS, Center DM, Cruikshank WW. Human immunodeficiency virus type 1 gp120 reprogramming of CD4+ T-cell migration provides a mechanism for lymphadenopathy. J Virol. 2009; 83:5765–5772. [PubMed: 19297493]
57. Van Drenth C, Jenkins A, Ledwich L, Ryan TC, Mashikian MV, Brazer W, Center DM, Cruikshank WW. Desensitization of CXC chemokine receptor 4, mediated by IL-16/CD4, is independent of p56lck enzymatic activity. J Immunol. 2000; 165:6356–6363. [PubMed: 11086073]
58. Nakai A, Hayano Y, Furuta F, Noda M, Suzuki K. Control of lymphocyte egress from lymph nodes through beta2-adrenergic receptors. J Exp Med. 2014; 211:2583–2598. [PubMed: 25422496]
A
uthor Man
uscr
ipt
A
uthor Man
uscr
ipt
A
uthor Man
uscr
ipt
A
uthor Man
uscr
Figure 1. YTS177-induced T cell purging is associated with a polarized phenotype independent of TCR signaling
NOD mice were treated with YTS177 or 2A3, and CD3+ T cells analyzed. (A)
Representative flow cytometric histograms and average MFI for CD4, CD62L, and CD11α expression by gated CD3+ T cells in the PLN 24 h post-2A3 (thin line) and YTS177 (heavy line) treatment. The αCD4 clone RM4-4 used for staining is not blocked by YTS177 (n=4; *p<0.05, Student’s t test). (B) Temporal analysis of the number of CD3+CD4+ T cells isolated from the spleen and PLN of YTS177 and 2A3-treated animals (n=5; *p<10−2, Student’s t test). (C) CD3+ T cell numbers per μl of blood in NOD mice following Ab treatment (day 0: prior to treatment; n=10; *p≤0.05, Student’s t test). (D) CD4+ T cell numbers in the spleen and PLN 5 d post-Ab treatment ± FK506 injected daily (n=6; *p≤0.05, Student’s t test). (E) Polarized splenic and PLN CD3+ T cells were enumerated 48 h post-Ab treatment; at least 500 T cells were scored from each mouse (n=3-5) (*p≤0.05, Student’s t test). (F) Representative images of YTS177 treated/polarized and 2A3 treated/ nonpolarized T cells exhibiting localization of F-actin (green) and LFA-1 (red) (400X magnification with digital zoom). Data are representative of ≥ 3 experiments.
A
uthor Man
uscr
ipt
A
uthor Man
uscr
ipt
A
uthor Man
uscr
ipt
A
uthor Man
uscr
Figure 2. YTS177-bound CD4+ T cells traffick into the PLN
Representative flow cytometric profiles of BDC CD4+ T cells from NOD mouse donors treated with YTS177, αCD11α/CD49d or 2A3, and transferred into NOD recipients. The ratio of YTS177 or αCD11α/CD49d- versus 2A3-treated BDC CD4+ T cells found in the spleen and PLN of recipients (n=3; *p≤0.005, αintegrin/2A3 versus YTS177/2A3 or 2A3/2A3, Student’s t test) is provided. YTS177 and αCD11α/CD49d-treated BDC CD4+ T cells were labeled with a 10-fold increase of CTV (5 μM; right peak) relative to 2A3-treated cells (0.5 μM; left peak). Data are representative of 3 independent experiments.
A
uthor Man
uscr
ipt
A
uthor Man
uscr
ipt
A
uthor Man
uscr
ipt
A
uthor Man
uscr
Figure 3. CD4+ T cells exhibit increased chemotaxis after YTS177 treatment
NOD mice were treated with 600 μg YTS177 or 2A3, and 24 h later PLN and splenic T cells isolated. Percent chemotaxis of CD4+ T cells to (A) S1P (n=3; *p<10−4, one way-ANOVA), and (B) CXCL12 (n=3; *p=0.01, one way-ANOVA). Percentage of input CD4+ (n=6) or CD8+ (n=4) T cells migrating across 5 μm (C) collagen and (D) endothelial cell coated transwells in response to 10 μM S1P (*p<0.05, Student’s t test). (E,F) Fold difference of S1P1r (E) and CXCR4 (F) RNA expression measured by qRT-PCR by isolated splenic and PLN CD4+ T cells from YTS177- versus 2A3-treated NOD mice (n=5). Representative flow cytometric histograms for (E) S1P1r and (F) CXCR4 staining of PLN CD3+CD4+ gated cells isolated 6 h post-YTS177 (bottom histogram) and 2A3 (middle histogram) treatment. Staining with isotype control Ab is depicted in the top histograms for each panel.
A
uthor Man
uscr
ipt
A
uthor Man
uscr
ipt
A
uthor Man
uscr
ipt
A
uthor Man
uscr
Figure 4. Increased Rac1 and Rac2 activation in PLN but not splenic T cells after YTS177 treatment
(A, B) T cells were isolated from NOD mice treated with YTS177 or 2A3, and activation of Rac GTPase examined by RBD-GST pulldown and immunoblot. (A) Representative blot showing Rac1 (upper) and Rac2 (lower) activation in isolated T cells. (B) Representative immunoblot of active Rac1 and Rac2 in T cells isolated from the spleen and PLN 6 h post-treatment. (A, B) Representative blots of ≥2 independent experiments are shown. Right graphs show the means ± SEM of densitometry for immunoblots (*p≤0.05, Student’s t test). (C) Isolated CD4+ T cells were mock transduced (Untransduced) or transduced with lentiviral vectors encoding shRNA specific for Rac1, Rac2, or β-globulin (Control), and CXCL12 (100 ng/ml) chemotaxis measured (n=5). Data is representative of 2 independent experiments (*p≤0.05, Student’s t test).
A
uthor Man
uscr
ipt
A
uthor Man
uscr
ipt
A
uthor Man
uscr
ipt
A
uthor Man
uscr
Figure 5. Rac activation in PLN T cells by YTS177 is independent of known T cell GEF (A) Representative immunoblots of active GEF by GEF activation pulldown of T cells isolated 3 h post treatment from the PLN of NOD mice 3h following YTS177 or 2A3 treatment. (B) CD4+ T cell numbers in the PLN 5 d post 2A3, YTS177, Ly294002-alone or YTS177+Ly294002 treatments (n=6; *p≤0.05, Student’s t test).