A Sensitive Colorimetric Detection of Ascorbic
Acid in Pharmaceutical Products Based on
Formation of Anisotropic Silver Nanoparticles
M.R. Hormozi Nezhad
1;2;, M.A. Karimi
3and F. Shahheydari
3;4Abstract. A sensitive colorimetric method for the detection of ascorbic acid was proposed in this research based on the reduction of silver ions by ascorbic acid in the presence of citrate-stabilized silver seeds, additional trisodium citrate and a polymer such as polyvinylpyrrolidone. The color of the stable sol is controlled by varying the concentration of trisodium citrate (TSC), polyvinylpyrrolidone, silver nitrate and silver seeds. The reduction of Ag+ to triangle silver nanoparticles (Ag-NPs) by ascorbic acid in the
presence of trisodium citrate (TSC) and silver seeds produced two very intense surface plasmon resonance peaks of Ag-NPs. The plasmon absorbance of Ag-NPs allows the quantitative spectrophotometric detection of the ascorbic acid. The calibration curve derived from the changes in absorbance at = 427 nm was linear, with the concentration of ascorbic acid in the range of 6:010 6 to 8:010 5M. The method was
applied to the determination of ascorbic acid in pharmaceutical formulations with satisfactory results. Keywords: Triangular silver nanoparticles; Surface plasmon band; Ascorbic acid.
INTRODUCTION
Ascorbic acid is present in both animal and plant king-doms [1]. Among animal organs, the liver, leukocytes and anterior pituitary lobe have the highest concen-tration of ascorbic acid [1]. Ascorbic acid is a vital vitamin in the diet of humans and has been used for the prevention and treatment of the common cold, mental illness, infertility, cancer (because it has been identied as a radical scavenger in vivo) and AIDS [2]. Also, the deciency of this vitamin leads to many diseases like Scurvy (Scurvy is a disease resulting from a deciency of vitamin C) [3]. Therefore, the analysis of food products and pharmaceuticals containing this vitamin assumes signicance, and it is essential to develop a simple and rapid method for its determination in
1. Department of Chemistry, Sharif University of Technology, Tehran, P.O. Box 11155-9516, Iran.
2. Institute for Nanoscience and Nanotechnology (INST), Sharif University of Technology, Tehran, Iran.
3. Department of Chemistry & Nanoscience and Nanotechnol-ogy Research Laboratory (NNRL), Payame Noor University (PNU), Sirjan, Iran.
4. Education Organization in Kerman, Kerman, Iran. *. Corresponding author. E-mail: [email protected] Received 28 June 2010; accepted 25 September 2010
routine analysis. Though the literature is sated with dierent types of method for the analysis of various products, eorts continue in the search for even better methods.
Noble metal nanoparticles made of silver and gold have been the focus of research for many decades as a result of their interesting optical properties [4-6]. When silver and gold nanoparticles are dispersed in liquid media, these nanoparticles exhibit a strong UV-vis extinction band that is not present in the spectrum of the bulk metal. This extinction band results when the incident photon frequency is resonant with the collective excitation of the conduction electrons, and is known as the Surface Plasmon Resonance (SPR) [6,7]. The plasmon resonance absorption of silver and gold nanoparticles has molar extinction coecients ( 3 1011 M 1 cm 1) [8], which allow higher sensitivity in
optical detection methods than conventional reagents. Recently, gold and silver nanoparticles used as a colorimetric detection probe can provide an important method of detection, allowing the detection of ana-lytes to be carried out by the naked eye [9]. Due to the excellent plasmon absorption of noble metal nanoparticles (NPs), especially of gold and silver, re-cently colorimetric nanoprobes have been developed for
sensitive and selective detection of metal ions [10,11], proteins [12], glucose [13], neurotransmitters [14], phe-nolic compounds [15] thiol-containing amino acids [16] DNA [17] and pesticides [18].
Obviously, we can precisely control the wave-lengths at which gold and silver nanoparticles absorb and scatter light by controlling their shapes, dimen-sions and structures (e.g. solid versus hollow) [19]. In addition, it is possible to tailor the magnitude of absorption and scattering coecients by engineering their geometric parameters (e.g. shape, aspect ra-tios etc.) [20]. Since anisotropic shapes have greater plasmon resonance extinction coecients and multi-ple plasmon bands compared to nanospheres, it is of great importance to develop a method that can use anisotropic noble metal nanoparticles for chemical sensing [21].
In the present study, we use a rapid and straight-forward method for colorimetric detection of ascorbic acid, as a mild reducing agent for the generation of tri-angular silver nanoparticles, in the presence of citrate-stabilized silver seeds and polyvinylpyrrolidone [22].
The plasmon bands of the generated silver nanoparticles enable the quantitative analysis of the ascorbic acid in dierent pharmaceutical products.
EXPERIMENTAL Reagents and Apparatus
All chemicals were from commercial sources (Aldrich, Sigma and Merck) and were used without further pu-rication. Doubly distilled water was used throughout the experiments. Silver nitrate (AgNO3), sodium
boro-hydride (NaBH4), ascorbic acid, polyvinylpyrrolidone
(PVP, Mw = 40000) and trisodium citrate (TSC) were supplied by Merck. All solutions were used within 1 h after preparation, and the experiments were performed at ambient temperature (25 2C).
The UV-Vis absorbance spectra were recorded on a PerkinElmer (Lambda 25) spectrophotometer with the use of a 1.0 cm glass cell. The size of the Ag-NPs were characterized by Transmission Electron Microscopy (TEM) using a Zeiss transmission electron microscope operated at an accelerating voltage of 80 kV. The TEM sample was collected by sampling two drops of the solution and casting it onto a carbon-coated Cu-grid.
Preparation of the Silver Seeds
A 20 mL volume of aqueous solution containing AgNO3
(2:9 10 4M) and TSC (2:5 10 4 M) was prepared
and cooled in an ice-bath. To this aqueous solution, NaBH4 (0.1 M, 0.6 mL) was added drop-wise with
vigorous stirring. The solution became bright yellow
immediately. The seeds were then stored in the dark and aged for 2 hours prior to use [22].
Procedure for Determination of Ascorbic Acid In 25 ml volumetric asks, 10 ml of 0.5% PVP, 100 L of silver seeds, 150 L of TSC (2:5 10 2
M), and dierent concentrations of the ascorbic acid were combined. To this solution, AgNO3 (0.01 M,
5 50 L) was added slowly with vigorous stirring. Then, a portion of that solution was transferred within 2 min into a 1 cm spectrophotometric cell to record the absorbance.
Sample Preparation for Real Samples Analysis At least 10 tablets (vitamin C and multivitamins from Iran Daru Pakhsh) were weighed, ground to a ne powder and mixed. A sample equivalent to approxi-mately 200 mg of ascorbic acid was weighed accurately, transferred into a 250 mL calibrated ask and diluted to volume with water. The mixture was sonicated for 10 min to aid dissolution and then ltered. An appropriate volume of the ltrate was diluted further with water, so that the concentration of ascorbic acid in the nal solution was within the working range.
RESULTS AND DISCUSSION
The system in this study is a modied method of that previously reported by Kelly et al. [22] for the rapid production of silver nanoparticles of tunable colors, us-ing a polymeric stabilizer, such as polyvinylpyrrolidone (PVP) and trisodium citrate (TSC). In this approach, we used relatively monodisperse seed particles which were prepared by reduction of silver ions with NaBH4.
In the second step of this process, a milder reducing agent like ascorbic acid is used for reduction of silver ions on silver seeds because a slower growth process is required. The ascorbic acid and silver ions diuse to the surface of the seed particle where electron transfer takes place, resulting in the formation of a silver atom [22]. Upon addition of ascorbic acid, which acts as reducing agent, silver ions are reduced to silver nanoparticles and then the absorbance characteristic to the plasmon of the Ag-NPs is observed.
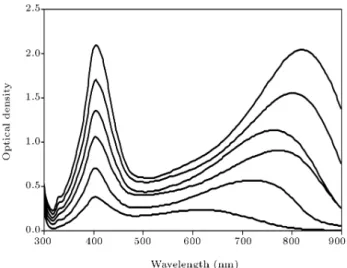
Figure 1 shows the absorption spectra of the Ag nanoparticles plasmon that is produced by the ascorbic acid against the reagent blank. The UV-vis spec-trum illustrates three peaks located at approximately 760 nm, 410 nm and 330 nm. These values may correspond to the in-plane dipole resonance, the out-of-plane dipole resonance and the out-of-out-of-plane quadrupole for triangular nanoplates [23,24], respectively. TEM analysis of the colloidal solution reveals that both tri-angular and spherical particle morphologies are present
Figure 1. Absorbance spectra of Ag-NPs formed by ascorbic acid under optimum conditions.
Figure 2. TEM images of colloidal nanoparticles prepared under optimum conditions.
(see Figure 2). Based on this peak appearance, a method was proposed for the detection of ascorbic acid. A series of experiments were conducted to establish the optimum analytical conditions for its detection. In this research, criteria for the optimum condition were:
i) Colloid stability.
ii) Maximum absorption intensity at plasmon wave-length.
iii) Reproducibility in colloid formation.
The eects of PVP, TSC and silver ion concentrations and seed volume were investigated to nd optimum conditions.
Eect of AgNO3 Concentration
The eect of AgNO3 concentration on the plasmon
absorbance intensity of the Ag-NPs and colloid sta-bility was investigated. As seen from Figure 3, the
Figure 3. Eect of silver ion concentration on the plasmon absorbances of the Ag-NPs; AgNO3 (2:0 10 5
to 1:2 10 4 M), PVP (2.0 g/L), Seed (100 L), TSC
(1:5 10 4 M) and ascorbic acid (2:0 10 4 M).
absorbance intensity was found to increase with in-creasing the concentration of AgNO3in the range of 2
10 5to 1:210 4M. A further increase in AgNO 3
con-centration caused a decrease in colloidal stability and the rapid formation of bulk silver precipitate. Thus, a concentration of 1 10 4 M was selected as the
opti-mum silver nitrate concentration for further studies.
Eect of Trisodium Citrate (TSC) Concentration
Ledwith et al. [22] reported that the color of silver nanoparticles produced by this method can be tuned simply by using dierent concentrations of TSC. Fig-ure 4 shows the changes of the Uv-visible spectrum and the color of the colloidal silver nanoparticles by dierent concentrations of TSC over the range of 5:0 10 6 3:0 10 4M. The results showed that plasmon
intensity and colloid stability were obtained by using 1:5 10 4 M of TSC. Thus, a 1:5 10 4 M of TSC
was selected for subsequent investigations.
Eect of Seed Volume
Seed volume must be carefully controlled to obtain stable green colloidal silver.
Figure 5 shows the inuence of seed volume on the Uv-visible spectrum of the colloidal silver nanoparticles in the range of 50-150 L seed. The plasmon peak intensity was found to increase with increasing the volume of seed up to 100 L. By further increasing seed volume, aggregation begins as the yellow sol rst turns a darker yellow, then violet and eventually grayish, after which the colloid breaks down and particles settle out. Therefore, 100 L of silver seed was selected as an optimum volume for determination of ascorbic acid.
Figure 4. Eect of TSC concentration on the plasmon absorbances and color of the colloidal silver nanoparticles; AgNO3 (1:0 10 4 M), TSC (5:0 10 6 3:0 10 4 M),
PVP (2.0 g/L), seed (100 L), and ascorbic acid (2:0 10 4 M).
Figure 5. Eect of seed volume on the absorption spectrum of colloidal silver nanoparticles; AgNO3
(1:0 10 4 M), TSC (1:5 10 4 M), PVP (2.0 g/L) and
seed (50-150 L).
Eect of PVP Concentration
The eects of PVP concentration on the plasmon absorbance intensity and colloidal stability of the silver nanoparticles were studied. It was observed that the addition of PVP within the interval of 1-3 g/L of PVP had no signicant eect on the plasmon absorbance and colloidal stability of the silver nanoparticles. A concen-tration of 2 g/L of PVP was chosen as the optimum.
Analytical Figures of Merit
The linear range, detection limit and reproducibility of the method were evaluated under the optimum
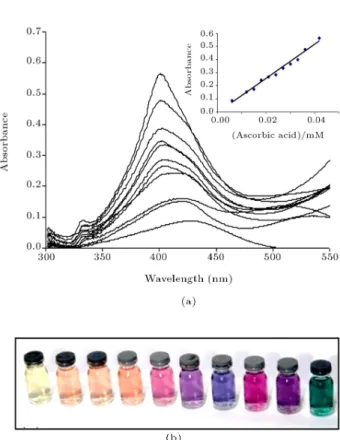
Figure 6. a) Absorbance spectra of Ag-NPs in the presence of dierent concentrations of ascorbic acid (the calibration curve for ascorbic acid is shown in the inset gure). b) Color images of the glass bottle containing Ag-NPs formed in the presence of dierent concentrations of ascorbic acid.
conditions described above. Figure 6 shows the spectra of the Ag-NPs formed upon treatment with dierent concentrations of ascorbic acid.
As the concentration of the ascorbic acid in-creases, the absorbance corresponding to the plasmon of the Ag-NPs is intensied. Under the specied exper-imental conditions, the calibration curve for ascorbic acid was linear from 3 10 6 5 10 5 M. The
de-tection limit (3Sb) [25], obtained for the determination
of ascorbic acid, was 8 10 7 M.
Application
The proposed method was successfully applied to the determination of ascorbic acid in pharmaceutical preparations. In order to assess the possible analytical applications of the proposed method, the eect of com-mon excipients used in pharmaceutical preparations was studied by analyzing synthetic sample solutions containing 5:0 10 5 M ascorbic acid and a 10-fold
excess of each excipient. The undissolved material, if any, was ltered before measurement. No interference was observed from any of the excipients like glucose, starch, sugar, dextrin, talc and calcium sulfate, be-cause, in real samples analyzed, binders and excipients cannot reduce silver ions at room temperature. So, this
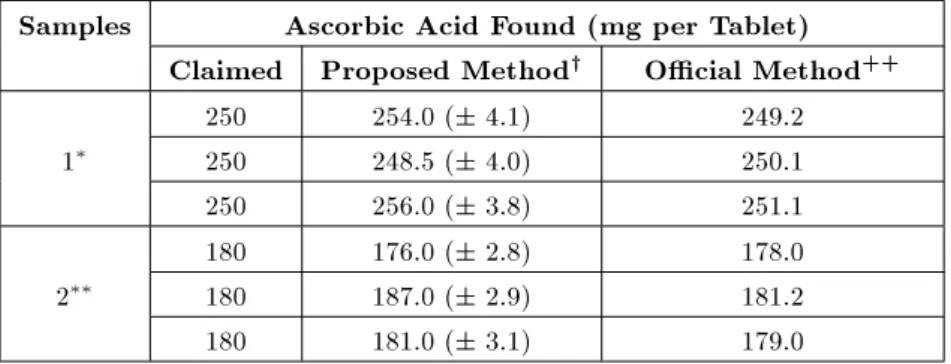
Table 1. Results of determination of ascorbic acid in tablet samples. Samples Ascorbic Acid Found (mg per Tablet)
Claimed Proposed Methody Ocial Method++
250 254.0 ( 4.1) 249.2 1 250 248.5 ( 4.0) 250.1
250 256.0 ( 3.8) 251.1 180 176.0 ( 2.8) 178.0 2 180 187.0 ( 2.9) 181.2
180 181.0 ( 3.1) 179.0
* Sample 1 was vitamin C tablet sample of Iran Daru Pakhsh,
** Sample 2 was eervescent vitamin C tablet sample of Sunlife Company, Germany, y Mean of three replicate,
++ British Pharmacopoeia method [26].
method is free from the interference of other reducing agents. As is clear from Table 1, the results of ascorbic acid analysis by the recommended procedure agree well with those obtained by the ocial method [26].
CONCLUSION
The salient features of the present study, using the seed mediation production of Ag-NPs by ascorbic acid, and an optical readout based on the absorbance of Ag nanoparticle plasmons, have excellent sensitivity. Therefore, the proposed method can be used as an al-ternative for determination of bulk samples and various pharmaceutical formulations in microgram quantities.
ACKNOWLEDGMENT
Financial support of this work by the Research Coun-cils of Sharif University of Technology and Sirjan Payame Noor University are greatly appreciated.
REFERENCES
1. Martin, Jr. D.W., Mayer, Jr. P.A. and Rodwell, V.W., Eds., Harper's Review of Biochemistry, 19th Ed., Lange, Los Altos, CA, p. 112 (1983).
2. Arrigoni, O. and Tullio, C.D. \Ascorbic acid: more than just an antioxidant", Biochim. Biophys. Acta, (11569), pp. 1-9 (2002).
3. Arya, S.P., Mahajan, M. and Jain, P. \Non-spectrophotometric methods for the determination of Vitamin C", Anal. Chim. Acta, 417(1), pp. 1-14 (2000).
4. El-Sayed, M.A. \Some interesting properties of metals conned in time and nanometer space of dierent shapes", Acc. Chem. Res., 34(4), pp. 257-264 (2001). 5. Templeton, A.C., Wuelng, W.P. and Murray, R.W.
\Monolayer-protected cluster molecules", Acc. Chem. Res., 33(1), pp. 27-36 (2000).
6. Sun, Y. and Xia, Y. \Gold and silver nanoparticles: a class of chromophores with colors tunable in the range from 400 to 750 nm", Analyst, 128(6), pp. 686-691 (2003).
7. McFarland, A.D. and Van Duyne, R.P. \Single silver nanoparticles as real-time optical sensors with zep-tomole sensitivity", Nano Lett., 3(8), pp. 1057-1062 (2003).
8. Jensen, T.R., Duval Malinsky, M., Haynes, C.L. and Van Duyne, R.P. \Nanosphere lithography: Tunable localized surface plasmon resonance spectra of silver nanoparticles", J. Phys. Chem. B, 104(45), pp. 10549-10556 (2000).
9. Li, H., Li, F., Hana, C., Cuia, Z., Xie, G. and Zhang, A. \Highly sensitive and selective tryptophan colorimetric sensor based on 4,4-bipyridine-functionalized silver nanoparticles", Sensor Actuat B-Chem, 145(1), pp. 194-199 (2010).
10. Slocik, J.M., Zabinski, J.S., Phillips, D.M. and Naik, R.R. \Colorimetric response of peptide-functionalized gold nanoparticles to metal ions", Small, 4(5), pp. 548-551 (2008).
11. Li, X., Wang, J., Suna, L. and Wang, Z. \Gold nanoparticle-based colorimetric assay for selective de-tection of aluminium cation on living cellular surfaces", Chem. Commun., 46(6), pp. 988-990 (2010).
12. Wei, H., Li, B., Li, J., Wang, E. and Dong, S. \Simple and sensitive aptamer-based colorimetric sensing of protein using unmodied gold nanoparticle probes", Chem. Commun., 36(37), pp. 3735-3737 (2007). 13. Jiang, Y., Zhao, H., Lin, Y., Zhu, N., Ma, Y. and Mao
L. \Colorimetric detection of glucose in rat brain using gold nanoparticles", Angew. Chem., Int. Ed., 49(28), pp. 4800-4804 (2010).
14. Baron, R., Zayats, M. and Willner, I. \Dopamine-, l-DOPA-\Dopamine-, Adrenaline-\Dopamine-, and Noradrenaline-induced growth of Au nanoparticles: Assays for the detection of neurotransmitters and of Tyrosinase activity", Anal. Chem., 77(6), pp. 1566-1571 (2005).
15. Hormozi Nezhad, M.R., Alimohammadi, M., Tashkhourian, J. and Razavian, S.M. \Optical detection of phenolic compounds based on the surface plasmon resonance band of Au nanoparticles", Spectrochimica Acta: Part A, 71(1), pp. 199-203 (2008).
16. Zhang, F.X., Han, L., Israel, L.B., Daras, J.G., Maye, M.M., Ly, N.K. and Zhong, C.J. \Colorimetric detection of thiol-containing amino acids using gold nanoparticles", Analyst, 127(4), pp. 462-465 (2002). 17. Thaxton, C.S. and Mirkin, C.A. in Nanobiotechnology,
C.M. Niemeyer and C.A. Mirkin, Eds., Wiley-VCH, Weinheim, pp. 288-307 (2004), and references cited therein.
18. Xiong, D. and Li, H. \Colorimetric detection of pesti-cides based on calixarene modied silver nanoparticles in water", Nanotechnology, 19(46), pp. 465-502 (2008). 19. Chen, J., Wiley, B., Li, Z., Campbell, D., Saeki, F., Cang, H., Au, L., Lee, J., Li, X. and Xia, Y. \Gold nanocages: Engineering the structure for biomedi-cal applications", Adv. Mater, 17(18), pp. 2255-2261 (2005).
20. Xia, Y. and Halas, N.J. \Shape-controlled synthesis and surface plasmonic properties of metallic nanostruc-tures", MRS Bulletin, 30, pp. 338-348 (2005). 21. Murphy, C.J., Gole, A.M., Hunyadi, S.E., Stone, J.W.,
Sisco, P.N., Alkilany, A., Kinard, B.E. and Hankins, P. \Shape-controlled synthesis and surface plasmonic properties of metallic nanostructures", Chem. Com-mun., 35(6), pp. 544-557 (2008).
22. Ledwith, D.M., Whelan, A.M. and Kelly, J.M. \A rapid, straight-forward method for controlling the morphology of stable silver nanoparticles", J. Mater. Chem., 17, pp. 2459-2564 (2007).
23. Jin, R.C., Cao, Y.W., Mirkin, C.A., Kelly, K.L., Schatz, G.C. and Zheng, J.G. \Photoinduced conver-sion of silver nanospheres to nanoprisms", Science, 294(5548), pp. 1901-1903 (2001).
24. Jin, R.C. Jin, Cao, Y.C., Hao, E.C., Metraux, G.S., Schatz, G.C. and Mirkin, C.A. \Controlling anisotropic nanoparticle growth through plasmon ex-citation", Nature, 425, pp. 487-490 (2003).
25. Miller, J.C., Miller, J.N., Statistics and Chemomet-rics for Analytical Chemistry, 4th Ed., Prentice Hall (2000).
26. British Pharmacopoeia, HMSO, London, pp. 733 (1980).
BIOGRAPHIES
Mohammad Reza Hormozi Nezhad is Assistant Professor of Analytical Chemistry in the Chemistry De-partment and an Associate Member of the Institute of Nanoscience and Nanotechnology at Sharif University of Technology in Iran. He earned a Ph.D. in Analytical Chemistry from Shiraz University, Iran, followed by a one year sabbatical period at the University of Alberta (Professor Jillian Buriak's group) and a post-doctoral degree at the Institute of Nanoscience and Nanotech-nology at Sharif University of TechNanotech-nology. His re-search interests include: Synthesis and Application of Colloidal Metallic and Semiconductor Nanoparticles in Analytical Chemistry.
Mohammad Ali Karimi is Associate Professor in the Department of Chemistry, and the Nanoscience and Nanotechnology Research Laboratory (NNRL) at Payame Noor University (PNU) in Sirjan. He earned a Ph.D. in Analytical Chemistry from Shiraz University, Iran. His research interests include: Application of Magnetic Nanoparticles in Solid Phase Extraction, Synthesis and Application of Metal Oxide Nanoparti-cles in Analytical Chemistry.
Fatemeh Shahheydari obtained her B.S. degree in Pure Chemistry from The University of Guilan, and her M.S. degree in Analytical Chemistry from Payame Noor University (PNU) in Sirjan, Iran.