11
Mitigation from a cross-sectoral perspective
Coordinating Lead Authors:
Terry Barker (UK) and Igor Bashmakov (Russia)
Lead Authors:
Awwad Alharthi (Saudi Arabia), Markus Amann (Austria), Luis Cifuentes (Chile), John Drexhage (Canada), Maosheng Duan (China), Ottmar Edenhofer (Germany), Brian Flannery (USA), Michael Grubb (UK), Monique Hoogwijk (Netherlands), Francis I. Ibitoye (Nigeria), Catrinus J. Jepma (Netherlands), William A. Pizer (USA), Kenji Yamaji (Japan)
Contributing Authors:
Shimon Awerbuch = (USA), Lenny Bernstein (USA), Andre Faaij (Netherlands), Hitoshi Hayami (Japan), Tom Heggedal (Norway), Snorre Kverndokk (Norway), John Latham (UK), Axel Michaelowa (Germany), David Popp (USA), Peter Read (New Zealand), Stefan P. Schleicher (Austria), Mike Smith (UK), Ferenc Toth (Hungary)
Review Editors:
David Hawkins (USA), Aviel Verbruggen (Belgium)
This chapter should be cited as:
Barker, T., I. Bashmakov, A. Alharthi, M. Amann, L. Cifuentes, J. Drexhage, M. Duan, O. Edenhofer, B. Flannery, M. Grubb, M. Hoogwijk, F. I. Ibitoye, C. J. Jepma, W.A. Pizer, K. Yamaji, 2007: Mitigation from a cross-sectoral perspective. In Climate Change 2007: Mitigation. Contribution of Working Group III to the Fourth Assessment Report of the Intergovernmental Panel on Climate Change [B. Metz, O.R. Davidson, P.R. Bosch, R. Dave, L.A. Meyer (eds)], Cambridge University Press, Cambridge, United Kingdom and New York, NY, USA.
Table of Contents
Executive Summary ... 621
11.1 Introduction ... 623
11.2 Technological options for cross-sectoral mitigation: description and characterization ... 623
11.2.1 Cross-sectoral technological options ... 623
11.2.2 Ocean fertilization and other geo-engineering options ... 624
11.3 Overall mitigation potential and costs, including portfolio analysis and cross-sectoral modelling ... 625
11.3.1 Integrated summary of sectoral emission potentials ... 626
11.3.2 Comparing bottom-up and top-down sectoral potentials for 2030 ... 635
11.3.3 Studies of interactions between energy supply and demand ... 637
11.3.4 Regional cross-sectoral effects of greenhouse gas mitigation policies to 2025 ... 637
11.3.5 Portfolio analysis of mitigation options ... 640
11.4 Macro-economic effects ... 642
11.4.1 Measures of economic costs ... 642
11.4.2 Policy analysis of the effects of the Kyoto Protocol ... 642
11.4.3 National and regional studies of responses to mitigation policies ... 643
11.4.4 Post-Kyoto studies ... 646
11.4.5 Differences between models ... 649
11.5 Technology and the costs of mitigation ... 650
11.5.1 Endogenous and exogenous technological development and diffusion ... 650
11.5.2 Effects of modelling sectoral technologies on estimated mitigation costs ... 652
11.5.3 The costs of mitigation with and without endogenous technological change ... 653
11.5.4 Modelling policies that induce technological change ... 658
11.6 From medium-term to long-term mitigation costs and potentials ... 658
11.6.1 Structural trends in the transition ... 659
11.6.2 Carbon prices by 2030 and after in global stabilization studies ... 659
11.6.3 Price levels required for deep mid-century emission reductions: the wider evidence ... 659
11.6.4 Complementary measures for deep emission reductions ... 661
11.6.5 Capital stock and inertia determinants of transitions in the second quarter of the century ... 662
11.6.6 Investment and incentive stability ... 663
11.6.7 Some generic features of long-term national studies ... 664
11.7 International spillover effects ... 664
11.7.1 The nature and importance of spillover ... 664
11.7.2 Carbon leakage ... 665
11.7.3 Spillover impact on sustainable development via the Kyoto mechanisms and compensation ... 666
11.7.4 Impact of mitigation action on competitiveness (trade, investment, labour, sector structure) ... 666
11.7.5 Effect of mitigation on energy prices ... 667
11.7.6 Technological spillover ... 668
11.8 Synergies and trade-offs with other policy areas ... 669
11.8.1 Interaction between GHG mitigation and air pollution control ... 669
11.8.2 Impacts of GHG mitigation on employment ... 676
11.8.3 Impacts of GHG mitigation on energy security ....676
11.8.4 Summary ... 676
11.9 Mitigation and adaptation - synergies and trade-offs ... 677
11.9.1 Sectoral mitigation action: links to climate change and adaptation ... 677
References ... 679
Unconventional options
The aim of geo-engineering options is to remove CO2 directly from the air, for example through ocean fertilization, or to block sunlight. However, little is known about effectiveness, costs or potential side-effects of the options. Blocking sunlight does not affect the expected escalation in atmospheric CO2 levels, but could reduce or eliminate the associated warming. Disconnecting CO2 concentration and global temperature in this
way could induce other effects, such as the further acidification
of the oceans (medium agreement, limited evidence).
Carbon prices and macro-economic costs of mitigation to 2030 Diverse evidence indicates that carbon prices in the range 20–50 US$/tCO2 (US$75–185/tC), reached globally by 2020– 2030 and sustained or increased thereafter, would deliver deep emission reductions by mid-century consistent with stabilization at around 550ppm CO2-eq (Category III levels, see Table 3.10) if implemented in a stable and predictable fashion. Such prices would deliver these emission savings by creating incentives large enough to switch ongoing investment in the world’s electricity systems to low-carbon options, to promote additional energy
efficiency, and to halt deforestation and reward afforestation.3 For purposes of comparison, it can be pointed out that prices in the EU ETS in 2005–2006 varied between 6 and 40 US$/tCO2. The emission reductions will be greater (or the price levels required for a given trajectory lower in the range indicated) to the extent that carbon prices are accompanied by expanding investment in technology RD&D and targeted market-building incentives (high agreement, much evidence).
Pathways towards 650ppm CO2-eq (Category IV levels; see Table 3.10) could be compatible with such price levels being deferred until after 2030. Studies by the International Energy Agency suggest that a mid-range pathway between Categories III and IV, which returns emissions to present levels by 2050, would require global carbon prices to rise to 25 US$/tCO2 by 2030 and be maintained at this level along with substantial investment in low-carbon energy technologies and supply (high agreement, much evidence).
Effects of the measures on GDP or GNP by 2030 vary accordingly (and depend on many other assumptions). For the 650ppm CO2-eq pathways requiring reductions of 20% global CO2 or less below baseline, those modelling studies that allow for induced technological change involve lower costs than the full range of studies reported in Chapter 3, depending on policy mix and incentives for the innovation and deployment of low-carbon technologies. Costs for more stringent targets of 550 ppm CO2-eq requiring 40% CO2 abatement or less show an
1 In Chapters 4 to 10, the emissions avoided as a result of the electricity saved in various mitigation options are attributed to the end-use sectors using average carbon content for power generation.
2 In ‘point-of-emission’ attribution, as adopted in Chapter 4, all emissions from power generation are attributed to the energy sector.
3 The forestry chapter also notes that a continuous rise in carbon prices poses a problem: forest sequestration might be deferred to increase profits given higher prices in the future. Seen from this perspective, a more rapid carbon price rise followed by a period of stable carbon prices could encourage more sequestration.
EXECUTIVE SUMMARY
Mitigation potentials and costs from sectoral studies
The economic potentials for GHG mitigation at different costs have been reviewed for 2030 on the basis of bottom-up
studies. The review confirms the Third Assessment Report (TAR) finding that there are substantial opportunities for
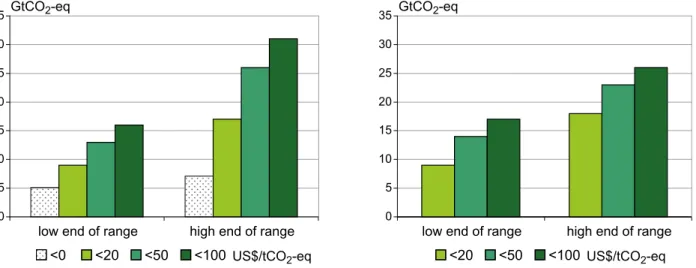
mitigation levels of about 6 GtCO2-eq involving net benefits
(costs less than 0), with a large share being located in the buildings sector. Additional potentials are 7 GtCO2-eq at a unit cost (carbon price) of less than 20 US$/tCO2-eq, with the total, low-cost, potential being in the range of 9 to 18 GtCO2-eq. The total range is estimated to be 13 to 26 GtCO2-eq, at a cost of less than 50 US$/tCO2-eq and 16 to 31 GtCO2-eq at a cost of less than 100 US$/tCO2-eq (370 US$/tC-eq). As reported in Chapter 3, these ranges are comparable with those suggested by the top-down models for these carbon prices by 2030, although there are differences in sectoral attribution (medium agreement, medium evidence).
No one sector or technology can address the entire mitigation
challenge. This suggests that a diversified portfolio is required
based on a variety of criteria. All the main sectors contribute to the total. In the lower-cost range, and measured according to end-use attribution,1 the potentials for electricity savings are largest in buildings and agriculture. When attribution is based on point of emission,2 energy supply makes the largest contribution (high agreement, much evidence).
These estimated ranges reflect some key sensitivities to
baseline fossil fuel prices (most studies use relatively low fossil fuel prices) and discount rates. The estimates are derived from the underlying literature, in which the assumptions adopted are not usually entirely comparable and where the coverage of countries, sectors and gases is limited.
Bioenergy
These estimates assume that bioenergy options will be important for many sectors by 2030, with substantial growth potential beyond, although no complete integrated studies are available for supply-demand balances. The usefulness of these options depends on the development of biomass capacity (energy crops) in balance with investments in agricultural practices, logistic capacity, and markets, together with the commercialization of second-generation biofuel production. Sustainable biomass production and use imply the resolution of issues relating to competition for land and food, water resources, biodiversity and socio-economic impact.
even more pronounced reduction in costs compared to the full range (high agreement, much evidence).
Mitigation costs depend critically on the baseline, the modelling approaches and the policy assumptions. Costs are lower with low-emission baselines and when the models allow technological change to accelerate as carbon prices rise.
Costs are reduced with the implementation of Kyoto flexibility
mechanisms over countries, gases and time. If revenues are raised from carbon taxes or emission schemes, costs are lowered if the revenues provide the opportunity to reform the tax system, or are used to encourage low-carbon technologies and remove barriers to mitigation (high agreement, much evidence). Innovation and costs
All studies make it clear that innovation is needed to deliver currently non-commercial technologies in the long term in order to stabilize greenhouse gas concentrations (high agreement, much evidence).
A major development since the TAR has been the inclusion in many top-down models of endogenous technological change. Using different approaches, modelling studies suggest that allowing for endogenous technological change reduces carbon prices as well as GDP costs, this in comparison with those studies that largely assumed that technological change was independent of mitigation policies and action. These reductions are substantial in some studies (medium agreement, limited evidence).
Attempts to balance emission reductions equally across sectors (without trading) are likely to be more costly than an
approach primarily guided by cost efficiency. Another general finding is that costs will be reduced if policies that correct the
two relevant market failures are combined by incorporating the damage resulting from climate change in carbon prices, and the
benefits of technological innovation in support for low-carbon
innovation. An example is the recycling of revenues from
tradeable permit auctions to support energy efficiency and
low-carbon innovations. Low-low-carbon technologies can also diversify technology portfolios, thereby reducing risk (high agreement, much evidence).
Incentives and investment
The literature emphasizes the need for a range of cross-sectoral measures in addition to carbon pricing, notably in relation to regulatory and behavioural aspects of energy
efficiency, innovation, and infrastructure. Addressing market and regulatory failures surrounding energy efficiency, and
providing information and support programmes can increase responsiveness to price instruments and also deliver direct emission savings (high agreement, much evidence).
Innovation may be greatly accelerated by direct measures and one robust conclusion from many reviews is the need for public policy to promote a broad portfolio of research. The
literature also emphasizes the need for a range of incentives that are appropriate to different stages of technology development, with multiple and mutually supporting policies that combine technology push and pull in the various stages of the ‘innovation chain’ from R&D through the various stages of commercialization and market deployment. In addition, the development of cost-effective technologies will be rewarded by well-designed carbon tax or cap and trade schemes through
increased profitability and deployment. Even so, in some cases,
the short-term market response to climate policies may lock in existing technologies and inhibit the adoption of more fruitful options in the longer term (high agreement, much evidence).
Mitigation is not a discrete action: investment, in higher or lower carbon options, is occurring all the time. The estimated investment required is around $20 trillion in the energy sector alone out to 2030. Many energy sector and land use investments cover several decades; buildings, urban and transport
infrastructure, and some industrial equipment may influence
emission patterns over the century. Emission trajectories and the potential to achieve stabilization levels, particularly in
Categories A and B, will be heavily influenced by the nature
of these investments. Diverse policies that deter investment in long-lived carbon-intensive infrastructure and reward low-carbon investment could maintain options for these stabilization levels at lower costs (high agreement, much evidence).
However, current measures are too uncertain and short-term to deliver much lower-carbon investment. The perceived risks involved mean that the private sector will only commit the
required finance if there are incentives (from carbon pricing and
other measures) that are clearer, more predictable, longer-term and more robust than provided for by current policies (high agreement, much evidence).
Spillover effects from Annex I action
Estimates of carbon leakage rates for action under Kyoto range from 5 to 20% as a result of a loss of price competitiveness,
but they remain very uncertain. The potential beneficial effect
of technology transfer to developing countries arising from technological development brought about by Annex I action may be substantial for energy-intensive industries. However,
it has not yet been quantified reliably. As far as existing
mitigation actions, such as the EU ETS, are concerned, the empirical evidence seems to indicate that competitive losses
are not significant, confirming a finding in the TAR (medium agreement, limited evidence).
Perhaps one of the most important ways in which spillover from mitigation action in one region affects others is through its effect on world fossil fuel prices. When a region reduces its local fossil fuel demand as a result of mitigation policy, it will reduce world demand for that commodity and so put downward pressure on prices. Depending on the response from fossil-fuel producers, oil, gas or coal prices may fall, leading to loss of revenue for the producers, and lower costs of imports
for the consumers. Nearly all modelling studies that have been reviewed indicate more pronounced adverse effects on countries with high shares of oil output in GDP than on most of the Annex I countries taking abatement action (high agreement, much evidence).
Co-benefits of mitigation action
Co-benefits of action in the form of reduced air pollution,
more energy security or more rural employment offset mitigation costs. While the studies use different methodological approaches, there is general consensus for all world regions analyzed that
near-term health and other benefits from GHG reductions can
be substantial, both in industrialized and developing countries.
However, the benefits are highly dependent on the policies,
technologies and sectors chosen. In developing countries,
much of the health benefit could result from improvements in the efficiency of, or switching away from, the traditional use of coal and biomass. Such near-term co-benefits of GHG control
provide the opportunity for a true no-regrets GHG reduction policy in which substantial advantages accrue even if the impact of human-induced climate change itself turns out to be less than that indicated by current projections (high agreement, much evidence).
Adaptation and mitigation from a sectoral perspective Mitigation action for bioenergy and land use for sinks are expected to have the most important implications for adaptation. There is a growing awareness of the unique contribution that synergies between mitigation and adaptation could provide for the rural poor, particularly in the least developed countries: many actions focusing on sustainable policies for managing
natural resources could provide both significant adaptation benefits and mitigation benefits, mostly in the form of carbon
sink enhancement (high agreement, limited evidence).
11.1 Introduction
This chapter takes a cross-sectoral approach to mitigation options and costs, and brings together the information in Chapters 4 to 10 to assess overall mitigation potential. It compares these sectoral estimates with the top-down estimates from Chapter 3, adopting a more short- and medium-term perspective, taking the assessment to 2030. It assesses the cross-sectoral and macro-economic cost literatures since the Third Assessment Report (TAR) (IPCC, 2001), and those covering the transition to a
low-carbon economy, spillovers and co-benefits of mitigation.
The chapter starts with an overview of the cross-cutting options for mitigation policy (Section 11.2), including technologies that cut across sectors, such as hydrogen-based systems and options not covered in earlier chapters, examples being ocean fertilization, cloud creation and bio- and geo-engineering. Section 11.3 covers overall mitigation potential by sector, bringing together the various options, presenting
the assessment of the sectoral implications of mitigation, and comparing bottom-up with top-down estimates. Section 11.4 covers the literature on the macro-economic costs of mitigation.
Since the TAR, there is much more literature on the quantita-tive implications of introducing endogenous technological change into the models. Many studies suggest that higher carbon prices and other climate policies will accelerate the adoption of low-carbon technologies and lower macroeconomic costs, with estimates ranging from a negligible amount to negative
costs (net benefits). Section 11.5 describes the effects of
introducing endogenous technological change into the models, and particularly the effects of inducing technological change through climate policies.
The remainder of the chapter looks at interactions of various kinds: Section 11.6 links the medium-term to the long-term issues discussed in Chapter 3, linking the shorter-term costs and social prices of carbon to the longer-term stabilization targets; 11.7 covers spillovers from action in one group of countries on
the rest of the world; 11.8 covers co-benefits (particularly local air quality benefits) and costs; and 11.9 deals with synergies and
trade-offs between mitigation and adaptation.
11.2 Technological options for
cross-sectoral mitigation: description
and characterization
This section covers technologies that affect many sectors (11.2.1) and other technologies that cannot be attributed to any of the sectors covered in Chapters 4 to 10 (geo-engineering options etc. in 11.2.2). The detailed consolidation and synthesis of the mitigation potentials and costs provided in Chapters 4 to 10 are covered in the next section, 11.3.
11.2.1 Cross-sectoral technological options
Cross-sectoral mitigation technologies can be broken down into three categories in which the implementation of the technology:
1. occurs in parallel in more than one sector; 2. could involve interaction between sectors, or 3. could create competition among sectors for scarce
resources.
Some of the technologies implemented in parallel have been
discussed earlier in this report. Efficient electric motor-driven
systems are used in the industrial sector (Section 7.3.2) and are also a part of many of the technologies for the buildings sector,
e.g. efficient heating, ventilation and air conditioning systems
(Section 6.4.5). Solar PV can be used in the energy sector for centralized electricity generation (Section 4.3.3.6) and in the buildings sector for distributed electricity generation (Section
6.4.7). Any improvement in these technologies in one sector
will benefit the other sectors.
On a broad scale, information technology (IT) is imple-mented in parallel across sectors as a component of many end-use technologies, but the cumulative impact of its end-use has not been analyzed. For example, IT is the basis for integrating the control of various building systems, and has the potential to reduce building energy consumption (Section 6.4.6). IT is also the key to the performance of hybrids and other advanced vehicle technologies (Section 5.3.1.2). Smart end-use devices (household appliances, etc) could use IT to program their operation at times when electricity demand is low. This could reduce peak demand for electricity, resulting in a shift to base load generation, which
is usually more efficient (Hirst, 2006). The impact of such
a switch on CO2 emissions is unknown, because it is easy to construct cases where shifts from peak load to base load would increase CO2 emissions (e.g., natural-gas-fired peak load, but coal-fired base load). General improvements in IT, e.g. cheaper computer chips, will benefit all sectors, but applications have to be tailored to the specific end-use. Of course, the net impact of IT
on greenhouse gas emissions could result either in net reductions
or gains, depending for example on whether or not efficiency
gains are offset by increases in production.
An example of a group of technologies that could involve
interaction between sectors is gasification/hydrogen/carbon
dioxide capture and storage (CCS) technology (IPCC, 2005 and Chapter 4.3.6). While these technologies can be discussed separately, they are interrelated and being applied as a group enhances their CO2-emission mitigation potential. For example, CCS can be applied as a post-combustion technology, in which case it will increase the amount of resource needed to generate a unit of heat or electricity. Using a pre-combustion approach, i.e. gasifying fossil fuels to produce hydrogen that can be used in fuel cells or directly in combustion engines, may improve
overall energy efficiency. However, unless CCS is used to
mitigate the CO2 by-product from this process, the use of that
hydrogen will offer only modest benefits. (See Section 5.3.1.4
for a comparison of fuel cell and hybrid vehicles.) Adding CCS would make hydrogen an energy carrier, providing a low CO2 emission approach for transportation, buildings, or industrial applications. Implementation of fuel cells in stationary applications could provide valuable learning for vehicle application; in addition, fuel cell vehicles could provide electric power to homes and buildings (Romeri, 2004).
In the longer term, hydrogen could be manufactured by gasifying biomass – an approach which has the potential to achieve negative CO2 emissions (IPCC, 2005) – or through electrolysis using carbon-free sources of electricity, a zero CO2 option. In the even longer term, it may be possible to produce hydrogen by other processes, e.g. biologically, using
genetically-modified organisms (GCEP, 2005). However, none of these longer-term technologies are likely to have a significant
impact before 2030, the time frame for this analysis.
Biomass is an example of a cross-sectoral technology which may compete for resources. Any assessment of the use of biomass, e.g., as a source of transportation fuels, must consider competing demands from other sectors for the creation and utilization of biomass resources. Technical breakthroughs could allow biomass to make a larger future contribution to world energy needs. Such breakthroughs could also stimulate the investments required to improve biomass productivity for
fuel, food and fibre. See Chapter 4 and Section 11.3.
Another example of resource competition involves natural gas. Natural gas availability could limit the application of some short- to medium-term mitigation technology. Switching to lower carbon fuels, e.g. from coal to natural gas for electricity generation, or from gasoline or diesel to natural gas for vehicles, is a commonly cited short-term option. Because of its higher hydrogen content, natural gas is also the preferred fossil fuel for hydrogen manufacture. Discussion of these options in one sector rarely takes natural gas demand from other sectors into account.
In conclusion, there are several important interactions between technologies across sectors that are seldom taken into account. This is an area of energy system modelling that requires further investigation.
11.2.2 Ocean fertilization and other geo-engineering options
Since the TAR, a body of literature has developed on alternative, geo-engineering techniques for mitigating climate change. This section focuses on apparently promising techniques: ocean fertilization, geo-engineering methods for capturing and safely sequestering CO2 and reducing the amount of sunlight absorbed by the earth’s atmospheric system. These options tend to be speculative and many of their environmental side-effects have yet to be assessed; detailed cost estimates have not been published; and they are without a clear institutional framework for implementation. Conventional carbon capture and storage is covered in Chapter 4, Section 4.3.6 and the IPCC Special Report (2005) on the topic.
11.2.2.1 Iron and nitrogen fertilization of the oceans Iron fertilization of the oceans may be a strategy for removing CO2 from the atmosphere. The idea is that it stimulates the growth of phytoplankton and therefore sequesters CO2 in the form of particulate organic carbon (POC). There have been
eleven field studies in different ocean regions with the primary
aim of examining the impact of iron as a limiting nutrient for phytoplankton by the addition of small quantities (1–10 tonnes) of iron sulphate to the surface ocean. In addition, commercial
tests are being pursued with the combined (and conflicting) aims
of increasing ocean carbon sequestration and productivity. It should be noted, however, that iron addition will only stimulate phytoplankton growth in ~30% of the oceans (the Southern
C. Albedo Enhancement of Atmospheric Clouds. This scheme (Latham, 1990; 2002) involves seeding low-level marine stratocumulus clouds – which cover about a quarter of the Earth’s surface – with micrometre-sized aerosol, formed by atomizing seawater. The resulting increases in droplet number concentrations in the clouds raises cloud albedo for incoming sunlight, resulting in cooling which could be controlled (Bower et al., 2006) and be sufficient to
compensate for global warming. The required seawater atomization rate is about 10 m3/sec. The costs would be substantially less than for the techniques mentioned under B. An advantage is that the only raw material required is seawater but, while the physics of this process are reasonably
well understood, the meteorological ramifications need
further study.
These schemes do not affect the expected escalation in atmospheric CO2 levels, but could reduce or eliminate the associated warming. Disconnecting CO2 concentration
and global temperature in this way could have beneficial
consequences such as increases in the productivity of agri- culture and forestry. However, there are also risks and this approach will not mitigate or address other effects
such as increasing ocean acidification (see IPCC, 2007b,
Section 4.4.9).
11.3 Overall mitigation potential and
costs, including portfolio analysis
and cross-sectoral modelling
This section synthesizes and aggregates the estimates from chapters 4 to 10 and reviews the literature investigating cross-sectoral effects. The aim is to identify current knowledge about the integrated mitigation potential and/or costs covering
more than two sectors. There are many specific policies for
reducing GHG emissions (see Chapter 13). Non-climate policies
may also yield substantial GHG reductions as co-benefits
(see Section 11.8 and Chapter 12). All these policies have direct sectoral effects. They also have indirect cross-sectoral effects, which are covered in this section and which diffuse across countries. For example, domestic policies promoting a new technology to reduce the energy use of domestic lighting lead to reductions in emissions of GHG from electricity generation. They may also result in more exports of the new technology and, potentially, additional energy savings in other countries. This section also looks at studies relating to a portfolio analysis of mitigation options.
Ocean, the equatorial Pacific and the Sub-Arctic Pacific), where
iron depletion prevails. Only two experiments to date (Buesseler and Boyd, 2003) have reported on the second phase, the sinking and vertical transport of the increased phytoplankton biomass
to depths below the main thermocline (>120m). The efficiency
of sequestration of the phytoplankton carbon is low (<10%), with the biomass being largely recycled back to CO2 in the upper water column (Boyd et al., 2004). This suggests that the
field-study estimates of the actual carbon sequestered per unit
iron (and per dollar) are over-estimates. The cost of large-scale and long-term fertilization will also be offset by CO2 release/ emission during the acquisition, transportation and release of large volumes of iron in remote oceanic regions. Potential negative effects of iron fertilization include the increased production of methane and nitrous oxide, deoxygenation of intermediate waters and changes in phytoplankton community composition that may cause toxic blooms and/or promote changes further along the food chain. None of these effects
have been directly identified in experiments to date, partly due
to the time and space constraints.
Nitrogen fertilization is another option (Jones, 2004) with similar problems and consequences.
11.2.2.2 Technologically-varied solar radiative forcing The basic principle of these technologies is to reduce the amount of sunlight accepted by the earth’s system by an amount
sufficient to compensate for the heating resulting from enhanced
atmospheric CO2 concentrations. For CO2 levels projected for 2100, this corresponds to a reduction of about 2%. Three techniques are considered:
A. Deflector System at Earth-Sun L-14 point. The principle underlying this idea (e.g. Seifritz (1989), Teller et al.(2004), Angel (2006)) is to install a barrier to sunlight measuring about 106 km2 at or close to the L-1 point. Teller et al. estimate that its mass would be about 3000 t, consisting of a 30µm metallic screen with 25nm ribs.5 They envisage it
being spun in situ, and emplaced by one shuttle flight a year
over 100 years. It should have essentially zero maintenance. The cost has not yet been determined. Computations by Govindasamy et al. (2003) suggest that this scheme could markedly reduce regional and seasonal climate change.
B. Stratospheric Reflecting Aerosols. This technique involves
the controlled scattering of incoming sunlight with airborne sub-microscopic particles that would have a stratospheric residence time of about 5 years. Teller et al. (2004) suggest that the particles could be: (a) dielectrics; (b) metals; (c) resonant scatterers. Crutzen (2006) proposes (d) sulphur particles. The implications of these schemes, particularly with regard to stratospheric chemistry, feasibility and costs, require further assessment (Cicerone, 2006).
4 This is the L-1 Lagrange point between the sun and the earth. 5 µm stands for micrometre and Nm stands for nanometre (see glossary).
11.3.1 Integrated summary of sectoral emission potentials
Chapters 4 to 10 assessed the economic potential of GHG mitigation at a sectoral scale for the time frame out to 2030
(for a discussion of the different definitions of potential, see
Chapter 2). These bottom-up estimates are derived using a variety of literature sources and various methodologies, as discussed in the underlying chapters. This section derives ranges of aggregate economic potentials for GHG mitigation over different costs (i.e. carbon prices) at year-2000 prices. 11.3.1.1 Problems in aggregating emissions
In compiling estimates of this kind, various issues must be considered:
Comparability: There is no common, standardized approach in the underlying literature that is used systematically for assessing the mitigation potential. The comparability of data is therefore far from perfect. The comparability problem was addressed by using a common format to bring together the variety of data found in the literature (as shown below in section 11.3.1.3 and Table 11.3), acknowledging that any aberrations due to a lack of a common methodological base may in part cancel each other out in the aggregation process. Some extrapolations were necessary, for example in the residential
sector where the literature mostly refers to 2020. The final
result can be considered the best result that is possible and it is accurate within the uncertainty ranges provided.
Coverage: Chapters 4 to 10 together cover virtually all sources of greenhouse gas emissions. However, for parts of some sectors, it was not possible to derive emission reduction
potentials from the literature. Furthermore, no quantified
emission reduction potentials were available for some options. This leads to a certain under-estimation of the emission reduction potential as discussed in Section 11.3.1.3. The under-estimation of the total mitigation potential is limited, but not negligible.
Baselines: Ideally, emission reduction potentials should adopt a common baseline. Some emission scenarios, such as those developed for the Special Report on Emission Scenarios (IPCC, 2000), are suitable for worldwide, sectoral and multi-gas coverage. However, for a number of sectors, such baselines are not detailed enough to serve as a basis for making bottom-up emission reduction calculations. The baselines used are described and discussed further in Section 11.3.1.2.
Aggregation: The aggregation of mitigation potentials for various sectors is complicated by the fact that mitigation action in one sector may affect mitigation potential in another. There is a risk of double counting of potentials. The problem and the procedures used to overcome this risk are explained in Section 11.3.1.3. In addition the baselines differ to some extent.
11.3.1.2 The baseline
All mitigation potentials have to be estimated against a baseline. The main baseline scenarios used for compiling the assessments in the chapters are the SRES B2 and A1B marker scenarios (IPCC, 2000) and the World Energy Outlook 2004 (WEO2004) (IEA, 2004). The assumed emissions in the three baseline scenarios vary in magnitude and regional distribution. The baseline scenarios B2 and WEO2004 are comparable in the main assumptions for population, GDP and energy use. Figure 11.1 shows that the emissions are also comparable. Scenario A1B, which assumes relatively higher economic growth, shows substantially higher emissions in countries outside the OECD/ EIT region.
The crude oil prices assumed in SRES B2 and WEO2004 are of the same order of magnitude. The oil prices in the SRES scenarios vary across studies. For the MESSAGE model (B2 scenario), the price is about 25 US$/barrel (Riahi et al., 2006). In the case of the WEO2004, for example, the oil price assumed in 2030 is 29 US$/barrel. These prices (and all other energy price assumptions) are substantially lower than those prevailing in 2006 and assumed for later projections (IEA, 2005 and 2006b).
The 2002–6 rises in world energy prices are also reflected in the energy futures markets for at least another five to ten years.
In fact, the rise in crude oil prices during this period, some 50 US$/barrel, is comparable to the impact of a 100 US$/tCO2-eq increase in the price of carbon. However, it is still uncertain
whether these price increases will have a significant impact on
the long-term energy price trend.
Higher energy prices and further action on mitigation may reinforce each other in their impact on mitigation potential, although it is still uncertain how and to what extent. On the one hand, for instance, economies of scale may facilitate the introduction of some new technologies if supported by a higher
0 10 20 30 40 50 60
OECD EIT
Non-OECD/EIT
Global Gt
WEO SRES A1 SRES B2
Figure 11.1: Energy-related CO2-only emissions per world region for the year 2030 in the World Energy Outlook, and in the SRES B2 and A1B scenarios Source: Price et al., 2006.
energy price trend. On the other hand, it is also conceivable that, once some cost-effective innovation has already been triggered by higher energy prices, any further mitigation action through
policies and measures may become more costly and difficult.
Finally, although general energy prices rises will encourage
energy efficiency, the mix of the different fuel prices is also
important. Oil and gas prices have risen substantially in relation to coal prices 2002–6, and this will encourage greater use of coal, for example in electricity generation, increasing GHG emissions.
As a rule, the SRES B2 and WEO2004 baselines were both used for the synthesis of the emission mitigation potentials by sector. Most chapters have reported the mitigation potential for at least one of these baseline scenarios. There are a few exceptions. Chapter 5 (transportation) uses a different, more suitable, scenario (WBCSD, 2004). However, it is comparable to WEO2004. Chapter 6 (buildings) constructed a baseline scenario with CO2 emissions between those of the SRES B2 and A1B marker scenarios taken from the literature (see Section 6.5). The agriculture and forestry sectors based their mitigation potential on changes in land use as deduced from various scenarios (including marker scenarios, see Sections 8.4.3 and 9.4.3). The SRES scenarios did not include enough detail for
the waste sector, so Chapter 10 used the GDP and population
figures from SRES A1B and the methodologies described in
IPCC Guidelines 2006 (see Section 10.4.7).
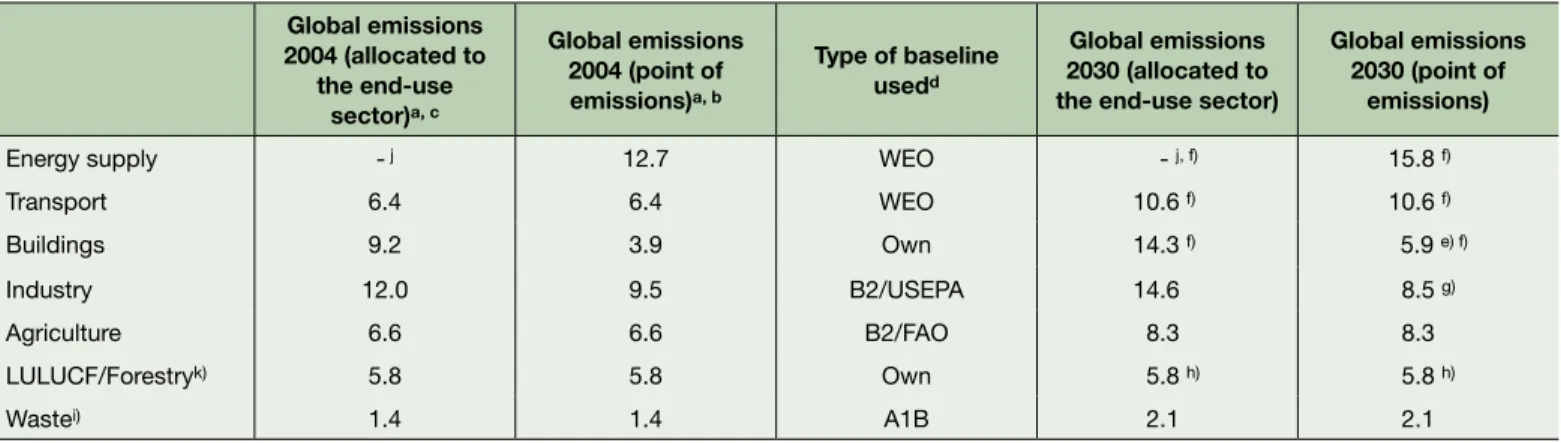
Table 11.1 compares the emissions of the different sectoral baselines for 2004 and 2030 against a background of the end-use and point-of-emission allocation of emissions attributed to electricity use. Since the 2030 data are from studies that differ in terms of coverage and comparability, they should not be directly aggregated across the different sectors and therefore no totals across all sectors are shown in Table 11.16. An important difference between the WEO baseline and SRES B2 is that the WEO emissions do not include all non-CO2 GHG emissions. 11.3.1.3 Synthesizing the potentials from Chapters 4 to 10
involving electricity
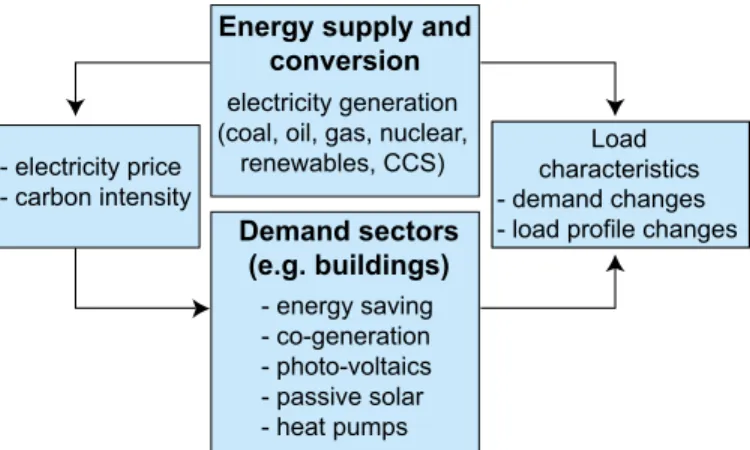
When aggregating the sectoral mitigation potentials, the links between sectors need to be considered (Figure 11.2). For example, the options in electricity supply interact with those for electricity demand in the buildings and industry sectors. On the supply side, fossil-fuel electricity can be substituted by low-CO2 or CO2-free technologies such as renewable sources, nuclear energy, bioenergy or fossil fuel in combination with
Global emissions 2004 (allocated to
the end-use sector)a, c
Global emissions 2004 (point of emissions)a, b
Type of baseline usedd
Global emissions 2030 (allocated to the end-use sector)
Global emissions 2030 (point of
emissions)
Energy supply - j 12.7 WEO - j, f) 15.8 f)
Transport 6.4 6.4 WEO 10.6 f) 10.6 f)
Buildings 9.2 3.9 Own 14.3 f) 5.9 e) f)
Industry 12.0 9.5 B2/USEPA 14.6 8.5 g)
Agriculture 6.6 6.6 B2/FAO 8.3 8.3
LULUCF/Forestryk) 5.8 5.8 Own 5.8 h) 5.8 h)
Wastei) 1.4 1.4 A1B 2.1 2.1
6 However, since the ranges allow for uncertainties in the baseline, they can be aggregated under specific assumptions and these ranges are shown below. Table 11.1: Overview of the global emissions for the year 2004 and the baseline emissions for all GHGs adopted for the year 2030 (in GtCO2-eq)
Notes:
a) The emissions in the year 2004 as reported in the sectoral chapters and Chapter 1, Figure 1.3a/b.
b) The allocation to point of emission means that the emissions are allocated to the sector where the emission takes place. For example, electricity emissions are allocated to the power sector. There is a difference between the sum when allocating the emissions in different ways. This is explained by the exclusion of electricity emissions from the agricultural and transport sectors due to lack of data and by the exclusion of emissions from conversion of energy as most end-use emissions are based on final energy supply.
c) ‘Allocated to the end-use sector’ means that the emissions are allocated to the sectors that use the energy. For example, electricity emissions are allocated to the end-use sectors, mainly buildings and industry. Emissions from extraction and distribution are not included here.
d) See text for further clarification on the type of baselines used.
e) This figure is based on the assumption that the share of electricity-related emissions in the constructed baseline in Chapter 6 is the same as for the SRES B2 scenario. According to Price et al. (2006), the electricity-related emissions amount to 59%. 59% of the baseline (14.3 GtCO2-eq) is 8.4 GtCO2-eq. The remaining emissions are allocated to the buildings sector.
f) 2030 emissions of the F-gases are not available for the Transport, Buildings, and Energy Supply sectors. g) Source: Price et al., 2006.
h) No baseline emissions for the year 2030 from the forestry sector are reported. See 9.4.3. On the basis of top-down models, it can be expected that the emissions in 2030 will be similar to 2004.
i) The data for waste include waste disposal, wastewater and incineration. The emissions from wastewater treatment are for the years 2005 and 2020. j) The emissions from conversion losses are not included due to lack of data.
carbon capture and storage. On the demand side, the buildings and the industrial sectors have options for electricity savings. The emission reductions from these two sets of options cannot be aggregated since emission reductions in demand reduce the potential for those in supply and vice-versa.
To overcome this problem, the following approach was adopted: The World Energy Outlook (IEA, 2004) for the year 2030 was used as the baseline. The potentials from electricity savings in the buildings and the industry sectors were estimated
first. Electricity savings then reduce demand for electricity.
This sequence was followed because electricity savings can be achieved at relatively low cost and their implementation can
therefore be expected first. Electricity savings were converted
to emission reductions using the average carbon intensity of the electricity supply in the baseline for the year 2030. In reality, it can be expected that electricity savings would result in a relatively larger reduction in fossil-fuel electricity generation than electricity generation involving low marginal costs such as renewables and nuclear. This is because, in the operating system, low-cost generation is normally called on before high-cost generation. However, this response depends on local conditions and it is not appropriate to consider it here. However, it does imply that the emission reductions for electricity savings reported here are an under-estimate. This under-estimate becomes more pronounced with higher carbon prices, and higher marginal costs for fossil fuels.
The detailed sequence is as follows:
1. Electricity savings from the measures in the buildings and industry sector were subtracted from the baseline supply estimates to obtain the corrected electricity supply for 2030. 2. No early withdrawal of plant or stranded assets is assumed.
Low-carbon options can therefore only be applied to new electricity supply.
3. The new electricity supply required to 2030 was calculated from 1) additional new capacity between 2010 and 2030 and 2) capacity replaced in the period 2010–2030 after an assumed average plant lifetime of 50 years (see Chapter 4.4.3).
4. The new electricity supply required was divided between available low-carbon supply options. As the cost estimates were lowest for a fuel switch from coal to natural gas supply,
it was assumed that this would take place first. In accordance
with Chapter 4 it was assumed that 20% of the new coal plants required would be substituted by gas technologies. 5. An assessment was made of the prevented emissions
from the other low-carbon substitution options after the fuel switch. The following technologies were taken into account: renewables (wind and geothermal), bioenergy, hydro, nuclear and CCS. It was assumed that the fossil fuel requirement in the baseline (after adjustments for the previous step) was met by these low-carbon intensive technologies. The substitution was made on the basis of relative maximum technical potential. The same breakdown as in Section 4.4.3 was used for the low-carbon options. 6. It was then possible to estimate the resulting mitigation
potential for the energy sector, after savings in the end-use sectors buildings and industry.
7. For the buildings and industry sectors, the mitigation potential was broken down into emission savings resulting from less electricity use and the remainder.
8. For sectors other than energy, buildings and industry, the data given in the chapters were used for the overall aggregation. When evaluating mitigation potential in the energy supply sector, the calculations in Chapter 4 did not subtract the electricity savings from the buildings and industry sectors (see Chapter 4, Table 4.19). Adopting this order (which is not the
preferred order, as explained above) implies first taking all the
mitigation measures in the energy sector and then applying the electricity savings from buildings and industry sectors. This would result in different mitigation potentials for each of the sectors and mitigation measures, although the total will not change. See Appendix 11.1 for a further discussion of the methodology and details of the calculation.
In the case of the other sectors, the data given in the chapters were used for the overall aggregation. The mitigation potential for the buildings and industry sectors was broken down into emission savings for lower electricity use and the remainder, so that the potential could be re-allocated where necessary to the power sector.
11.3.1.4 Synthesizing the potentials from Chapters 4 to 10 involving biomass
Biomass supplies originate in agriculture (residues and cropping), forestry, waste supplies, and in biomass processing industries (such as the paper & pulp and sugar industries). Key applications for biomass are conversion to heat, power, transportation fuels and biomaterials. Information about biomass supplies and utilization is distributed over the relevant chapters in this report and no complete integrated studies are available for biomass supply-demand balances and biomass potential.
Energy supply and conversion
Demand sectors (e.g. buildings)
electricity generation (coal, oil, gas, nuclear,
renewables, CCS)
- energy saving - co-generation - photo-voltaics - passive solar - heat pumps - electricity price
- carbon intensity - demand changes - load profile changes
Load characteristics
Figure 11.2: Interaction of CO2 mitigation measures between electricity supply and demand sectors
Biomass demand from different sectors
Demand for biomass as transportation fuel involves the production of biofuels from agricultural crops such as sugar cane, rape seed, corn, etc., as well as potentially ‘second-generation’
biofuels produced from lignocellulosic biomass. The first category
dominates in the shorter term. The penetration of second-generation biofuels depends on the speed of technological development and
the market penetration of gasification technology for synfuels and
hydrolysis technology for the production of ethanol from woody biomass. Demand projections for primary biomass in Chapter 5 are largely based on WEO-IEA (2006) global projections, with a relatively wide range of about 14 to 40 EJ of primary biomass, or 8–25 EJ of fuel. However, there are also higher estimates ranging from 45 to 85 EJ demand for primary biomass in 2030 (or roughly 30–50 EJ of fuel) (see Chapter 5).
Demand for biomass for power and heat is considered in Chapter 4 (energy). Demand for biomass for heat and power
will be strongly influenced by the availability and introduction
of competing technologies such as CCS, nuclear power, wind energy, solar heating, etc. The projected demand in 2030 for biomass would be around 28–43 EJ according to the data used in Section 4.4.3.3. These estimates focus on electricity generation. Heat is not explicitly modelled or estimated in the WEO, resulting in an under-estimate of total demand for biomass.
Industry is an important user of biomass for energy, most notably the paper & pulp industry and the sugar industry, which both use residues for generating process energy (steam and electricity). Chapter 7 highlights improvements in energy production from such residues, most notably the deployment
of efficient gasification/combined cycle technology that could strongly improve efficiencies in, for example, pulp and sugar
mills. Mitigation potentials reducing the demand for such commodities or raising the recycling rate for paper will not result in additional biomass demand. Biomass can also be used for the production of chemicals and plastics, and as a reducing agent for steel production (charcoal) and for construction purposes (replacing, for example, metals or concrete). Projections for such production routes and subsequent demand for biomass feedstocks are not included in this report, since their deployment is expected to be very limited (see Chapter 7).
In the built environment, biomass is used in particular for heating for both non-commercial uses (and also as cooking fuel) and in modern stoves. The use of biomass for domestic
heating could represent a significant mitigation potential. No
quantitative estimates are available of future biomass demand for the built environment (for example, heating with pellets or cooking fuels) (Chapter 6).
Biomass supplies
Biomass production on agricultural and degraded lands.
Table 11.2 summarizes the biomass supply energy potentials
discussed in Chapters 8 (agriculture), 9 (Forestry) and 10 (waste). Those potentials are accompanied by considerable uncertainties. In addition, the estimates are derived from scenarios for the year 2050. The largest contribution could come from energy crops on
arable land, assuming that efficiency improvements in agriculture
are fast enough to outpace food demand so as to avoid increased pressure on forests and nature areas. Section 8.4.4.2 provides a range from 20–400 EJ. The highest estimate is a technical
potential for 2050. Technically, the potentials for such efficiency
increases are very large, but the extent to which such potentials can be exploited over time is still poorly studied. Studies assume the successful introduction of biomass production in key regions as Latin America, Sub-Saharan Africa, Eastern Europe and Oceania, combined with gradual improvements in agricultural practice and management (including livestock). However, such development schemes – that could also generate substantial additional income for rural regions that can export biomass – are uncertain, and implementation depends on many factors such as trade policies, agricultural policies, the establishment of
sustainability frameworks such as certification, and investments
in infrastructure and conventional agriculture (see also Faaij & Domac, 2006).
In addition, the use of degraded lands for biomass production (as in reforestation schemes: 8–110 EJ) could contribute
significantly. Although biomass production with such low
yields generally results in more expensive biomass supplies, competition with food production is almost absent and various
co-benefits, such as the regeneration of soils (and carbon
storage), improved water retention, and protection from erosion may also offset some of the establishment costs. An important example of such biomass production schemes at the moment is the establishment of jatropha crops (oil seeds, also spelled jathropa) on marginal lands.
Biomass residues and wastes. Table 11.2 also depicts the energy potentials in residues from forestry (12–74 EJ/yr) and agriculture (15–70 EJ/yr) as well as waste (13 EJ/yr). Those biomass resource categories are largely available before 2030, but also somewhat uncertain. The uncertainty comes from possible competing uses (for example, the increased use of
biomaterials such as fibreboard production from forest residues
and the use of agro-residues for fodder and fertilizer) and differing assumptions about the sustainability criteria deployed with respect to forest management and agriculture intensity. The current energy potential of waste is approximately 8 EJ/yr, which could increase to 13 EJ in 2030. The biogas fuel potentials
from waste, landfill gas and digester gas are much smaller.
Synthesis of biomass supply & demand
A proper comparison of demand and supply is not possible since most of the estimates for supply relate to 2050. Demand has been assessed for 2030. Taking this into account, the lower end of the biomass supply (estimated at about 125 EJ/ yr) exceeds the lower estimate of biomass demand (estimated
at 70 EJ/yr). However, demand does not include estimates of domestic biomass use (such as cooking fuel, although that use may diminish over time depending on development pathways in developing countries), increased biomass for production of heat (although additional demand in this area may be limited) and biomass use in industry (excluding the possible demand of biomass for new biomaterials). It seems that this demand can be met by biomass residues from forestry, agriculture, waste and dung and a limited contribution from energy crops. Such a ‘low biomass demand’ pathway may develop from the use of agricultural crops with more limited potentials, lower GHG mitigation impact and less attractive economic prospects, in particular in temperate climate regions. The major exception here is sugar-cane-based ethanol production.
The estimated high biomass demand consists of an estimated maximum use of biomass for power production and the constrained growth of production of biofuels when the WEO projections are taken into consideration (25 EJ/yr biofuels and about 40 EJ/yr primary biomass demand). Total combined demand for biomass for power and fuels adds up to about 130 EJ/yr. Clearly, a more substantial contribution from energy crops (perhaps in part from degraded lands, for example producing jatropha oil seeds) is required to cover total demand of this magnitude, but this still seems feasible, even for 2030; the low-end estimate for energy crops for agricultural land is 50 EJ/yr, which is in line with the 40 EJ/yr primary projected demand for biofuels.
However, as was also acknowledged in the WEO, the demand for biomass as biofuels in around 2030 will depend in particular on the commercialization of second-generation biofuel
technologies (i.e. the large-scale gasification of biomass for
the production of synfuels as Fischer-Tropsch diesel, methanol or DME, and the hydrolysis of lignocellulosic biomass for the production of ethanol). According to Hamelinck and Faaij (2006), such technologies offer competitive biofuel production compared to oil priced at between 40–50 US$/barrel (assuming biomass prices of around 2 US$/GJ). In Chapter 5, Figure 5.9 (IEA, 2006b), however, assumes higher biofuel costs. Another key option is the wider deployment of sugar cane for ethanol production, especially on a larger scale using state-of-the art mills, and possibly in combination with hydrolysis technology and additional ethanol production from bagasse (as argued by Moreira, 2006 and other authors). The availability of such technologies before 2020 may lead to an acceleration of biofuel production and use, even before 2030. Biofuels may therefore become the most important demand factor for biomass, especially in the longer term (i.e. beyond 2030).
A more problematic situation arises when the development of biomass resources (both residues and cultivated biomass) fails to keep up with demand. Although the higher end of biomass supply estimates (2050) is well above the maximum projected biomass demand for 2030, the net availability of biomass in 2030 will be considerably lower than the 2050 estimates. If biomass supplies fall short, this is likely to lead to
Sector
Supply Demand
Biomass supplies to
2050
Energy supply biomass demand
2030
Transport biomass
demand 2030 Built environment Industry
Agriculture Relevant, in particular
in developing countries as cooking fuel
Sugar industry significant. Food & beverage industry. No quantitative estimate on use for new biomaterials (e.g. bio-plastics) not significant for 2030.
Residues 15-70
Dung 5-55
Energy crops on arable land and pastures
20-300 Crops on degraded
lands
60-150
Forestry 12-74 Key application Relevant for second-generation biofuels
Relevant
Waste 13 Power and heat
production
Possibly via gasification
Minimal Cement industry
Industry Process
residues
Relevant; paper & pulp industry
Total supply primary biomass
125-760
Total demand primary biomass
70-130 28-43 (electricity) Heat excluded
45-85 Relevant (currently
several dozens of EJ; additional demand may be limited)
Significant demand; paper & pulp and sugar industry use own process residues; additional demand expected to be limited
significant price increases for raw materials. This would have
a direct effect on the economic feasibility of various biomass applications. Generally, biomass feedstock costs can cover 30– 50% of the production costs of secondary energy carriers, so increasing feedstock prices will quickly reduce the increase in biomass demand (but simultaneously stimulate investments in biomass production). To date, there has been very little research into interactions of this kind, especially at the global scale.
Comparing mitigation estimates for top-down and bottom-up modelling is not straightforward. Bottom-bottom-up mitigation responses are typically more detailed and derived from more constrained modelling exercises. Cost estimates are therefore in partial equilibrium in that input and output market prices are
fixed, as may be key input quantities such as acreage or capital.
Top-down mitigation responses consider more generic mitigation technologies and changes in outputs and inputs (such as shifts from food crops or forests to energy crops) as well as changes in market prices (such as land prices as competition for land increases). In addition, current top-down models optimistically assume the simultaneous global adoption of a coordinated climate policy with an unconstrained, or almost unconstrained, set of mitigation options across sectors. A review of top-down studies (Chapter 3 data assembled from Rose et al. (2007) and US CCSP (2006)) results in a range for total projected biomass
use over all cost categories of 20 to 79 EJ/yr (defined as solid
and liquid, requiring a conversion ratio from primary biomass to fuels). This is, on average, half the range for estimates obtained via bottom-up information from the various chapters.
Given the relatively small number of relevant scenario studies available to date, it is fair to say that the role of biomass
in long-term stabilization (beyond 2030) will be very significant
but that it is subject to relatively large uncertainties. Further research is required to improve our insight into the potential.
A number of key factors influencing biomass mitigation
potential are worth noting: the baseline economic growth and energy supply alternatives, assumptions about technological change (such as the rate of development of cellulosic ethanol conversion technology), land use competition, and mitigation alternatives (overall and land-related).
Given the lack of studies of how biomass resources may be distributed over various demand sectors, we do not suggest any allocation of the different biomass supplies to various applications. Furthermore, the net avoidance costs per ton of CO2 of biomass usage depend on a wide variety of factors, including the biomass resource and supply (logistics) costs, conversion costs (which in turn depend on the availability of improved or advanced technologies) and reference fossil fuel prices, most notably of oil.
11.3.1.5 Estimates of mitigation potentials from Chapters 4 to 10
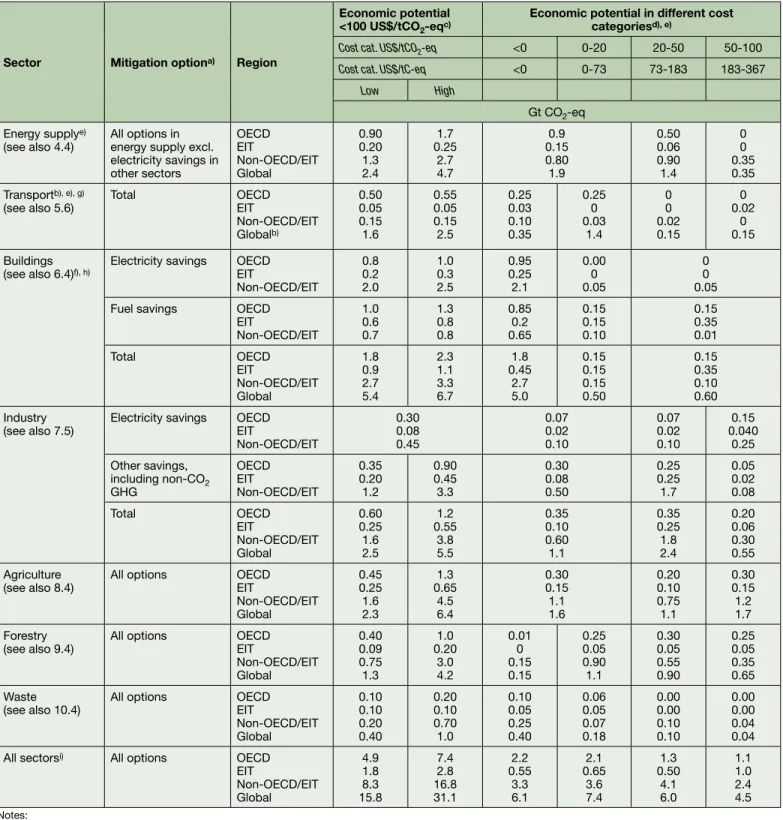
Table 11.3 uses the procedures outlined above to bring together the estimates for the economic potentials for GHG mitigation from Chapters 4 to 10. It was not possible to break down the potential into the desired cost categories for all sectors. Where appropriate, then, the cells in the table have been merged to account for the fact that the numbers represent the total of two cost categories. Only the potentials in the cost categories up to 100 US$/tCO2-eq are reported here. Some of the chapters also report numbers for the potential in higher cost categories. This is the case for Chapter 5 (transport) and Chapter 8 (agriculture).
Table 11.3 suggests that the economic potential for reducing GHG emissions at costs below 100 US$/tCO2 ranges7 from 16 to 30 GtCO2-eq. The contributions of each sector to the totals are in the order of magnitude 2 to 6 GtCO2-eq (mid-range numbers), except for the waste sector (0.4 to 1 GtCO2-eq). The mitigation potentials at the lowest cost are estimated for the buildings sector. Based on the literature assessment presented in Chapter 6 it can be concluded that over 80% of the buildings
potential can be identified at negative cost. However, significant
barriers need to be overcome to achieve these potentials. See Chapter 6 for more information on these barriers.
In all sectors, except for the transport sector, the highest economic potential for emission reduction is thought to be in the non-OECD/EIT region. In relative terms, although it is not possible to be exact because baselines across sectors are different, the emission reduction options at costs below 100 US$/tCO2-eq are in the range of 30 to 50% of the totalled
baseline. This is an indicative figure as it is compiled from a
range of different baselines.
A number of comments should be made on the overview presented in Table 11.3.
First, a set of emission reduction options have been excluded from the analysis, because the available literature did not allow for a reliable assessment of the potential.8
• Emission reduction estimates of fluorinated gases from
energy supply, transport and buildings are not included in the sector mitigation potentials from Chapters 4 to 6. For these sectors, the special IPCC report on ozone and climate (IPCC & TEAP, 2005) reported a mitigation potential for HFCs of 0.44 GtCO2-eq for the year 2015 (a mitigation potential of 0.46 GtCO2-eq was reported for CFCs and HCFCs).
7 Note that the range is found by aggregating the low or the high potentials per sector. As the errors in the potentials by sector are not correlated, counting up the errors using error propagation rules would lead to a range about half this size. However, given all the uncertainties, and in order to make statements with enough confidence, the full range reported here is used.
8 As indicated in the notes to Table 11.1, bog fires in the forestry sector have also been excluded from the emissions and therefore from the reduction potential as well. The emissions may be significant (in the order of 3 GtCO2-eq), see Chapter 1.
Table 11.3: Estimated economic potentials for GHG mitigation at a sectoral level in 2030 for different cost categories using the SRES B2 and IEA World Energy Outlook (2004) baselines
Sector Mitigation optiona) Region
Economic potential <100 US$/tCO2-eqc)
Economic potential in different cost categoriesd), e)
Cost cat. US$/tCO2-eq <0 0-20 20-50 50-100
Cost cat. US$/tC-eq <0 0-73 73-183 183-367
Low High
Gt CO2-eq Energy supplye)
(see also 4.4) All options in energy supply excl. electricity savings in other sectors OECD EIT Non-OECD/EIT Global 0.90 0.20 1.3 2.4 1.7 0.25 2.7 4.7 0.9 0.15 0.80 1.9 0.50 0.06 0.90 1.4 0 0 0.35 0.35 Transportb), e), g)
(see also 5.6) Total OECDEIT
Non-OECD/EIT Globalb) 0.50 0.05 0.15 1.6 0.55 0.05 0.15 2.5 0.25 0.03 0.10 0.35 0.25 0 0.03 1.4 0 0 0.02 0.15 0 0.02 0 0.15 Buildings
(see also 6.4)f), h) Electricity savings OECDEIT Non-OECD/EIT 0.8 0.2 2.0 1.0 0.3 2.5 0.95 0.25 2.1 0.00 0 0.05 0 0 0.05
Fuel savings OECD
EIT Non-OECD/EIT 1.0 0.6 0.7 1.3 0.8 0.8 0.85 0.2 0.65 0.15 0.15 0.10 0.15 0.35 0.01 Total OECD EIT Non-OECD/EIT Global 1.8 0.9 2.7 5.4 2.3 1.1 3.3 6.7 1.8 0.45 2.7 5.0 0.15 0.15 0.15 0.50 0.15 0.35 0.10 0.60 Industry
(see also 7.5) Electricity savings OECDEIT Non-OECD/EIT 0.30 0.08 0.45 0.07 0.02 0.10 0.07 0.02 0.10 0.15 0.040 0.25 Other savings,
including non-CO2 GHG OECD EIT Non-OECD/EIT 0.35 0.20 1.2 0.90 0.45 3.3 0.30 0.08 0.50 0.25 0.25 1.7 0.05 0.02 0.08 Total OECD EIT Non-OECD/EIT Global 0.60 0.25 1.6 2.5 1.2 0.55 3.8 5.5 0.35 0.10 0.60 1.1 0.35 0.25 1.8 2.4 0.20 0.06 0.30 0.55 Agriculture
(see also 8.4) All options OECDEIT Non-OECD/EIT Global 0.45 0.25 1.6 2.3 1.3 0.65 4.5 6.4 0.30 0.15 1.1 1.6 0.20 0.10 0.75 1.1 0.30 0.15 1.2 1.7 Forestry
(see also 9.4) All options OECDEIT Non-OECD/EIT Global 0.40 0.09 0.75 1.3 1.0 0.20 3.0 4.2 0.01 0 0.15 0.15 0.25 0.05 0.90 1.1 0.30 0.05 0.55 0.90 0.25 0.05 0.35 0.65 Waste
(see also 10.4) All options OECDEIT Non-OECD/EIT Global 0.10 0.10 0.20 0.40 0.20 0.10 0.70 1.0 0.10 0.05 0.25 0.40 0.06 0.05 0.07 0.18 0.00 0.00 0.10 0.10 0.00 0.00 0.04 0.04 All sectorsi) All options OECD
EIT Non-OECD/EIT Global 4.9 1.8 8.3 15.8 7.4 2.8 16.8 31.1 2.2 0.55 3.3 6.1 2.1 0.65 3.6 7.4 1.3 0.50 4.1 6.0 1.1 1.0 2.4 4.5 Notes:
a) Several reduction options are not included due to limited literature sources. This underestimation could be about 10–15%; see below.
b) For transport, the regional data by cost category do not add up to the global potential: regional (cost) distribution is available for LDV only. Due to the lack of interna-tional agreement about the regional allocation of aviation emissions, only global cost distributions are available for aviation. A lack of data means that only global figures are presented for biofuels, and not cost distribution.
c) The ranges indicated by the potential are derived differently for each chapter. See underlying chapters for more information. d) The economic potential figures per cost category are mid-range numbers.
e) The mitigation potential for the use of biomass is allocated to the transport and power sector. See the discussion on biomass energy in 11.3.1.4.
f) For the buildings sector the literature mainly focuses on low-cost mitigation options, and the potential in high-cost categories may be underestimated. The zero may represent an underestimation of the emissions.
g) The ‘0’ means zero, 0.00 means a value below 5 Mton.
h) The electricity savings in the end-use sectors Buildings and Industry are the high estimates. The electricity savings would be significantly lower if the order of mea-surement were to be reversed; the substitution potential in the energy sector would have been assessed before electricity savings (see Appendix 11.1).