A New Three Parameter Cubic Equation of State
A.A. Rabah
1;and S.A. Mohamed
2Abstract. A new three parameter Equation Of State (EOS) is developed based on well documented data, at three thermodynamic states of the critical point, the normal bubble point and standard condition. Besides these states, the EOS is designed to satisfy the condition of nearly zero Joule-Thomson (JT) coecients at the normal boiling point. Critical properties and densities at the normal boiling point and a standard condition of more than 100 pure uids were used. The new EOS is validated using experimental data and eight (8) of the popular EOSs, namely, SRK, PR, LLS, HK, MNM, SW, PT and ALS. The experimental data for pure uids include 331 data points of vapor pressure covering 12 uids and compressibility at the critical condition of 23 uids. For mixtures, the data includes 129 PVT data points of 12 reservoir uids [seven (7) of them are Sudanese crude oil considered for publication for the rst time and ve (5) from literature]. The new EOS is found to be superior to the existing EOSs in the prediction of PVT properties of mixtures with a grand average percent absolute deviation (AAPD) of 3.18%. It is also comparable to the existing EOSs in the prediction of vapor pressure despite the fact that existing EOSs are developed based on vapor pressure data; the grand average AAPD is 2.0. In terms of compressibility at the critical point with the exception of LLS, the new EOS yields better results than all other EOSs considered in this work.
Keywords: Equation of state; Joule-Thomson coecient; PVT data; Sudanese reservoir uids.
INTRODUCTION
Since the appearance of the Van Der Waals (VDW) Equation Of State (EOS) in 1873, numerous cubic (in volume or density) EOS have been developed. Most of these developments are based on the original VDW EOS [1]. These developments have the form of an extended VDW EOS as:
P = v bRT v2+ ubv + wba(T; !) 2: (1) EOSs that assume this form include Peng Robison (PR) [2], Soave-Redlich-Kwong (SRK) [3], Schmidt-Wenzel (SW) [4], Patel-Teja (PT) [5], Harmens-Knapp (HK) [6], Adachi-Lu-Sugie (ALS) [7], Lawal - Lake - Sil-berberg (LLS) [8] and Modied-Nasrifar-Moshfeghian (MNM) [9] to mention a few. The rst term in the
1. Department of Chemical Engineering, Faculty of Engineering, University of Khartoum, Khartoum, P.O. Box 321, Sudan. 2. Department of Transportation and Rening Petroleum
Engi-neering, College of Petroleum Engineering and Technology, Sudan University of Science and Technology, Khartoum, P.O. Box 566, Sudan.
*. Corresponding author. E-mail: [email protected] Received 2 December 2009; received in revised form 9 March 2010; accepted 17 July 2010
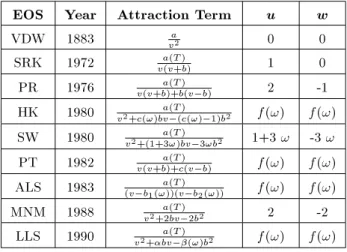
right hand side of Equation 1 represents the repulsive, and the second term represents the attraction term. Table 1 lists a number of cubic EOSs. The attraction term and the functional relationship of u and w are also given in Table 1; the repulsive term (not shown) is similar in all of these EOSs as dened in Equation 1. In most EOSs, the term a is constant. With the exception of VDW, the term (T; !) is temperature (T ) and acentric (!) factor dependent. With few exceptions,
Table 1. Features of some cubic EOSs.
EOS Year Attraction Term u w
VDW 1883 a
v2 0 0
SRK 1972 a(T )
v(v+b) 1 0
PR 1976 a(T )
v(v+b)+b(v b) 2 -1
HK 1980 a(T )
v2+c(!)bv (c(!) 1)b2 f(!) f(!)
SW 1980 a(T )
v2+(1+3!)bv 3!b2 1+3 ! -3 !
PT 1982 a(T )
v(v+b)+c(v b) f(!) f(!)
ALS 1983 a(T )
(v b1(!))(v b2(!)) f(!) f(!)
MNM 1988 a(T )
v2+2bv 2b2 2 -2
LLS 1990 a(T )
(T; !) = 1 + m(!) 1 T r : (2) At the critical point, (Tc; !) = 1. With the exception
of LLS, the parameter b is acentric factor dependent only. Parameters u and w are constant in two param-eter EOSs, such as VDW, PR, SRK, MNM. In three parameter EOSs, such as HK, SW and PT, u and w are dependent on each other. For the fourth parameters EOSs, such as LLS and ALS, the terms u and w are acentric factor dependent.
For two parameter EOSs, such as VDW and RK, parameters a and b are determined using VDW critical point conditions. This criterion is expressed mathematically by the following three equations [1]:
@P @v
Tc
= 0; (3a)
@2P
@v2
Tc
= 0; (3b)
f(Tc; Pc; Vc) = 0: (3c)
For three and four parameter EOSs, where additional boundary conditions are needed, the parameters are determined by tting the EOS to experimental data. Vapor pressure data is common to all EOSs. Other tted properties include liquid and vapor density and compressibility factor [5-7].
Experimental data and prediction methods for the thermodynamic states at critical point, normal boiling point and standard condition (T = 15C [60F] and
P = 1 atm [14.67 psia]) for a wide range of uids are well documented. The objective of this work is to use the thermodynamic properties at those three points, coupled with the inection point criteria of temperature, isotherm and isenthalpic (Joule Thomson inversion curve) to develop a three parameter equation of state similar to Equation 1.
MODEL DEVELOPMENT
Equation 1 can be written in a reduced form as: Pr= v Tr
r
ac(T; !)
v2
r+ uvr+ w2; (4)
where: Pr= PP
c; Tr=
T
Tc; =
bPc
RTc;
ac= aPc
(RTc)2; Zc=
Pcvc
RTc;
vr=RTvPc c =
v vcZc:
six boundary conditions are needed. The boundary conditions chosen to evaluate the parameters are (1) critical point, (2) normal boiling point and (3) stan-dard condition. These points are selected, because over years, the thermodynamic states at these points are well documented for pure uids. The boundary conditions at these three points are characterized as: 1. Critical Point: At this point, three constraints are
written by VDW as given by Equations 3a to 3c. In fact, VDW critical point conditions are common to all cubic EOSs.
2. Normal Boiling Point: The EOS is assumed to give the correct volume at the normal boiling point, hence:
f(Tb; Pb; vb) = 0: (5)
Equation 5 represents the fourth boundary condi-tion. It should be emphasized that the calculation methods of Tb and vb are well established. It is also
assumed that the JT coecient vanishes or becomes nearly zero at the normal boiling point:
@T @P
h
| {z }
normal boiling point
= 0: (6)
The point at which JT vanishes is called the inversion point and the locus of these points is called a JT inversion curve. Experimental data of the JT inversion curve is very limited in the literature; it does not cover a wide spectrum of uids. This is attributed to the fact that direct measurement of an inversion curve is dicult and unreliable [10]. Nevertheless, close scrutiny of the isenthalpic line (cf. Figure 1) reveals an interesting fact. It is noticeable that at low pressure (P ! 1 atm), the turning point of isenthalpic lines (i.e. = 0) lies exactly at or close to the bubble point curve. The question is, how close is it to the boiling curve? Under all circumstances, the deviation is in the order of magnitude of experimental error. For example, for water at the normal boiling point = 0:18 K/MPa. Hence, it is safe to consider that the JT coecient is approximately zero at the normal boiling point.
Using the denition of enthalpy: dh = CpdT
" T @V @T p v # dp: (7)
The JT coecient is: =@P@T
h= 1 Cp " T @v @T p v # : (8)
Figure 1. Temperature-entropy (T-s) diagram (source: [11]). At the normal boiling point, Equation 7 becomes:
" Tb
@v @T
pb vb
#
! 0; (9)
where the subscript b stands for normal boiling point. Equation 9 represents the fth boundary condition.
3. Standard Condition Point: To close the system of equations, Equation 4 is considered to give the correct value of the liquid density under standard conditions:
f (Tsc; Psc; vsc) = 0; (10)
where the subscript sc stands for standard condi-tion.
With these six boundary conditions (three at critical point, two at normal boiling point and one at standard condition) the six parameters (ac; ; u; w; Zc and m) can now be evaluated.
Evaluation of Parameters
Applying the critical point conditions given by Equa-tions 3a to 3c to Equation 4, and solving ac; and Zc,
in terms of u and w, results in:
Zc= pRTcvc c =
1
3[1 + (1 u) ] ; (11)
ac= 3Zc2+ (u w) 2+ u; (12)
(u + 2)33+ 3 (9w u + 5u + 5) 2
+ 3 (u + 2) 1 = 0: (13)
The value of is the smallest root of Equation 13. Details of the derivation of Equations 11 to 13 are available in [11].
There are, in total, six equations (Equations 5 and 9 to 13), with six unknown parameters (ac; ; u; w; Zc
and m). Using an algebraic method, parameters ac
and Zc are eliminated and the number of equations
is reduced to four non-linear equations with four unknown parameters (; u; w and m).
The non-linear equations are solved numerically using the Jacobian method and the values of the four parameters are calculated for 102 uids. For all these uids, the critical properties (Tc; Pc), acentric factor
(!), molar volume at the standard condition (vsc) and
the normal boiling point temperature (Tb) are obtained
It is convenient and common practice (cf. Table 1) to write u and m as a function of the acentric factor and w as a function of u. This exercise results in:
u = 1:7574 + 4:0951! + 1:7176!2; (14)
m = 0:0967 0:4442! + 0:8267!2
0:6621!3+ 0:1903!4; (15)
w = 0:01871u2 1:42111u + 1:6165: (16)
Since u and w are related by an exact mathematic relationship, similar to HK, SW and PT EOSs, the new model is a three parameter EOS.
Application to Mixtures
Equation 4 with the parameters dened by Equa-tions 11 to 16 may be used for mixture with the conventional VDW mixing rules as:
X =X
iyiXi; (17)
a =X
iyiyjpaiaj(1 kij) ; (18)
where X can be ; u or w and y is the liquid or vapor mole fraction, and kij is the binary interaction
parameter.
RESULTS AND DISCUSSION
To compare the new EOS to experimental data and the available EOSs, numerous quality measurements based on statistical error analysis are computed. These include the Percent Deviation (PD), the Average Absolute Percent Deviation (AAPD), the minimum Absolute Percent Deviation (APDmin), the maximum
Absolute Percent Deviation (APDmax) and the grand
average AAPD. The percent deviation is dened as: P Di=Xexp;iX XEOS;i
exp;i 100%; (19)
and the average absolute percent deviation (AAPD) is dened as:
AAPD =N1 X PDi; (20)
where Xexp is the experimental value, XEOS is the
calculated value using EOS, N is the number of the data points and i is a dummy index. Besides these statistical parameters, a Consistency Parameter (CP) is introduced in this work. The CP is dened as the
The new EOS is compared with experimental data and eight (8) of the most popular EOSs, namely, SRK, PR, LLS, HK, MNM, SW, PT and ALS EOSs. The data include published and unpublished experimental works of pure components and mixtures. For pure components, these data include the compressibility at the critical point and vapor pressure. For mixtures, PVT data of the reservoir uids under undersaturated conditions are used.
Compressibility
Table 2 shows the critical at the critical point (Zc) of
some components common to reservoir uids predicted by the EOSs including the new one. The statistical parameters of AAPD, APDmin and APDmax are also
shown. The new EOS predicts critical compressibility with an AAPD of about 4.0% while the AAPD of the existing EOSs with the exception of LLS exceeds 20. LLS has an AAPD of 1.37. The higher error associated with EOSs, such as SRK, PR and MNM, is not surprising, since Zc is constant, i.e. independent of
the uid. For ALS, SW, PT and HK, no justication could be given to the inaccuracy in the prediction of Zc.
The superiority of LLS by the prediction of Zccould be
attributed to the fact that parameter b is a function of temperature, contrary to the rest of the EOSs including the new model.
VAPOR PRESSURE
The vapor pressure is calculated using Maxwell criteria:
Ps= 1
vv vl vv Z
vl
P (T; v)dv; (21)
where Ps; v
v and vl are the vapor pressure, vapor
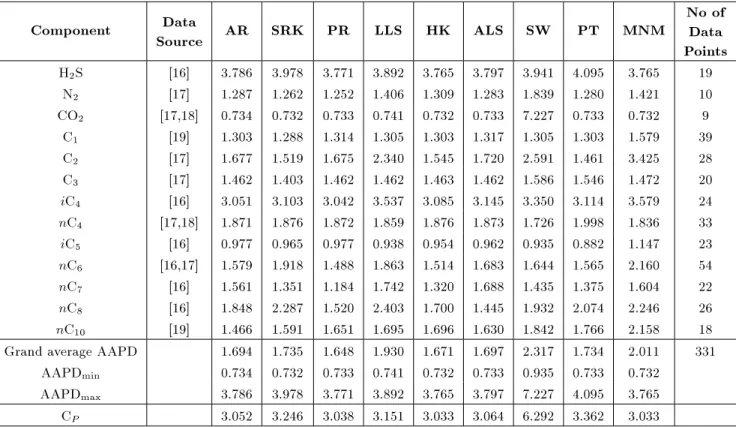
molar volume and liquid molar volume, respectively. Table 3 shows a summary of AAPD for some 13 uids, compromising about 331 vapor pressure data points from the literature. The reported values may be slightly dierent from similar calculations available in the literature [14]. This dierence is due to the covered ranges and, hence, the number of data points involved in the comparison. The covered range is limited to T r 0:9. This range is selected to maintain comparison consistency, because some EOSs, such as SW, are valid for a vapor pressure within this range only. All EOSs, including the new EOS, produced com-parable results with a consistent grand average AAPD of about 2.0. The APDmax for all EOSs is more than
3.0. However, this is obtained for few uids; namely, H2S and iC4. This could not be explained but, in part,
Table 2. Accuracy of EOSs in the prediction of Zc(data source: [12]).
Name Exp. This Work SRK PR LLS MNM HK SW ALS PT
N2 0.292 0.309 0.333 0.307 0.291 0.295 0.318 0.330 0.319 0.326
CO2 0.274 0.288 0.333 0.307 0.273 0.295 0.305 0.315 0.314 0.313
H2S 0.284 0.304 0.333 0.307 0.286 0.295 0.315 0.326 0.321 0.323
C1 0.286 0.312 0.333 0.307 0.288 0.295 0.320 0.332 0.325 0.328
C2 0.279 0.302 0.333 0.307 0.288 0.295 0.314 0.325 0.320 0.322
C3 0.276 0.296 0.333 0.307 0.288 0.295 0.310 0.321 0.312 0.318
iC4 0.282 0.294 0.333 0.307 0.288 0.295 0.308 0.319 0.316 0.316
nC4 0.274 0.291 0.333 0.307 0.288 0.295 0.307 0.317 0.315 0.315
iC5 0.270 0.288 0.333 0.307 0.288 0.295 0.305 0.315 0.313 0.313
nC10 0.247 0.256 0.333 0.307 0.245 0.295 0.291 0.297 0.297 0.296
nC13 0.232 0.241 0.333 0.307 0.231 0.295 0.286 0.289 0.291 0.290
nC14 0.226 0.238 0.333 0.307 0.225 0.295 0.286 0.288 0.290 0.288
nC15 0.224 0.232 0.333 0.307 0.224 0.295 0.284 0.285 0.287 0.286
nC17 0.219 0.221 0.333 0.307 0.220 0.295 0.282 0.280 0.279 0.282
C17 0.233 0.238 0.333 0.307 0.235 0.295 0.286 0.288 0.290 0.288
C18 0.231 0.234 0.333 0.307 0.229 0.295 0.285 0.286 0.288 0.287
C20 0.226 0.226 0.333 0.307 0.225 0.295 0.283 0.282 0.280 0.284
C21 0.224 0.223 0.333 0.307 0.223 0.295 0.283 0.281 0.278 0.283
C22 0.221 0.219 0.333 0.307 0.219 0.295 0.282 0.279 0.280 0.282
C23 0.220 0.216 0.333 0.307 0.222 0.295 0.281 0.278 0.274 0.281
C24 0.217 0.212 0.333 0.307 0.218 0.295 0.281 0.277 0.273 0.279
C25 0.215 0.208 0.333 0.307 0.217 0.295 0.281 0.275 0.276 0.278
C26 0.213 0.205 0.333 0.307 0.214 0.295 0.280 0.274 0.270 0.277
AAPD 4.03 36.88 26.19 1.37 21.26 20.42 21.68 20.86 21.71
APDmin 0.00 14.16 5.25 0.22 1.13 9.02 12.96 9.36 11.76
APDmax 9.01 56.34 44.13 6.63 38.50 31.46 28.64 28.41 30.05
CP 9.01 42.18 38.88 6.41 37.37 22.44 15.68 19.05 18.29
may be attributed to the literature data. The good accuracy of existing EOSs on the prediction of vapor pressure is not surprising, since vapor pressure values have been used to determine the values of parameter \a". On the contrary, vapor pressure data are not involved in the development of the new EOS. Despite this fact, the new EOS is comparable to existing EOSs in terms of vapor pressure. This is indicative in the consistency of the new EOS.
Molar Volume of Reservoir Fluids
Table 4 gives the composition and code names for 12 reservoir uids. Reservoir temperature, bubble point, and plus heptanes (C7+) molecular weight and specic
gravity are also given in Table 4. Data of mixtures coded A to F are supplied by the Ministry of Energy and Mining, Sudan. These data have been considered for publication for the rst time. For these data, the
experimental error of pressure is 5 psi, temperature is 0:5F and cell volume is 0:3 cc as reported in
PVT studies. Reservoir uids, G to M, are obtained from the literature; their sources are indicated in the footnote of Table 4.
For C7+, the critical properties and acentric
factor are estimated for a given molecular weight and specic gravity from Lawal-Tododo-Heinze [15] correlations. Binary Interaction Parameters (BIPs) are taken as kij = 0.
Table 5 gives a summary of the statistical pa-rameters of comparison of new EOS with experimental data and other EOSs in term of the molar volume of reservoir uid. Table 5 reveals some interesting ndings:
1. Although HK, ALS and PR do yield good results, the new EOS is superior to all EOSs under consid-eration, in terms of the grand average AAPD.
Component Data
Source AR SRK PR LLS HK ALS SW PT MNM Data
Points
H2S [16] 3.786 3.978 3.771 3.892 3.765 3.797 3.941 4.095 3.765 19
N2 [17] 1.287 1.262 1.252 1.406 1.309 1.283 1.839 1.280 1.421 10
CO2 [17,18] 0.734 0.732 0.733 0.741 0.732 0.733 7.227 0.733 0.732 9
C1 [19] 1.303 1.288 1.314 1.305 1.303 1.317 1.305 1.303 1.579 39
C2 [17] 1.677 1.519 1.675 2.340 1.545 1.720 2.591 1.461 3.425 28
C3 [17] 1.462 1.403 1.462 1.462 1.463 1.462 1.586 1.546 1.472 20
iC4 [16] 3.051 3.103 3.042 3.537 3.085 3.145 3.350 3.114 3.579 24
nC4 [17,18] 1.871 1.876 1.872 1.859 1.876 1.873 1.726 1.998 1.836 33
iC5 [16] 0.977 0.965 0.977 0.938 0.954 0.962 0.935 0.882 1.147 23
nC6 [16,17] 1.579 1.918 1.488 1.863 1.514 1.683 1.644 1.565 2.160 54
nC7 [16] 1.561 1.351 1.184 1.742 1.320 1.688 1.435 1.375 1.604 22
nC8 [16] 1.848 2.287 1.520 2.403 1.700 1.445 1.932 2.074 2.246 26
nC10 [19] 1.466 1.591 1.651 1.695 1.696 1.630 1.842 1.766 2.158 18
Grand average AAPD 1.694 1.735 1.648 1.930 1.671 1.697 2.317 1.734 2.011 331
AAPDmin 0.734 0.732 0.733 0.741 0.732 0.733 0.935 0.733 0.732
AAPDmax 3.786 3.978 3.771 3.892 3.765 3.797 7.227 4.095 3.765
CP 3.052 3.246 3.038 3.151 3.033 3.064 6.292 3.362 3.033
Table 4. Mixture compositions and reservoir conditions.
Components A B C D E F G H K L M
H2S 0.00 0.00 0.00 0.00 0.00 0.00 0.00 0.00 0.00 0.00 0.00
N2 0.35 0.08 0.07 0.18 0.20 8.70 6.94 4.52 0.91 0.49 0.16
CO2 0.94 0.68 26.99 1.26 2.00 0.25 0.23 0.21 0.16 0.53 1.94
C1 21.05 29.04 0.29 1.44 1.69 1.75 1.45 1.31 36.47 38.83 25.50
C2 4.44 10.00 0.31 0.27 0.27 0.16 0.39 0.06 9.67 9.86 7.37
C3 4.53 7.75 0.37 0.31 0.25 0.11 0.66 0.05 6.95 9.53 11.21
iC4 3.17 1.23 0.50 0.13 0.12 0.02 0.25 0.02 1.44 1.23 3.49
nC4 3.29 4.10 1.08 0.33 0.27 0.04 0.39 0.03 3.93 4.31 4.17
Neopentane 0.00 0.02 0.00 0.00 0.00 0.00 0.00 0.00 0.00 0.00 0.00
iC5 2.70 1.15 1.53 0.23 0.22 0.01 0.31 0.01 1.44 1.20 2.18
nC5 2.23 2.25 1.74 0.41 0.37 0.02 0.38 0.02 1.41 1.87 2.76
C6 3.57 2.74 2.95 1.08 1.04 0.02 0.97 0.03 4.33 2.82 3.67
C7+ 53.73 40.97 64.16 94.36 93.57 88.92 88.03 93.74 33.29 29.33 37.55
T (F) 249 224 172 242 243 234 236 231 220 162 138
Pb (psia) 1818.7 1999.7 809.7 129.7 150.7 309.7 359.7 186.7 2634.7 2677.7 1689.7
S.G. C7+ 0.816 0.855 0.909 0.887 0.886 0.8952 0.845 0.896 0.8515 0.8413 0.8467
MW C7+ 180.596 321.9 389.49 373.00 363.00 336.50 220.59 320.93 218.00 252.0 209.00
Data sources:
1. Mixtures A to F: Ministry of Energy and Mining, Sudan. 2. Mixtures G and H: [20]
3. Mixture L: [21] 4. Mixtures K and M: [22]
Table 5. Summary of AAPD in the prediction of the molar volume of the reservoir uids.
Mixture No. of
Data Points This Work PR SRK LLS ALS SW PT MNM HK
A 13 1.19 4.06 16.53 14.42 0.77 16.94 15.65 2.34 2.48
B 9 3.17 5.96 18.21 31.29 7.21 18.51 16.58 2.98 4.51
C 7 0.84 10.32 23.38 18.15 2.76 11.93 10.20 7.13 0.40
D 16 4.00 16.11 29.60 3.36 9.14 7.47 5.11 14.87 1.80
E 16 2.66 16.99 30.61 3.88 7.53 6.48 4.22 14.90 2.67
F 18 5.54 10.83 23.78 4.63 9.59 10.48 8.66 6.15 2.33
G 10 5.14 3.32 15.76 4.92 5.80 14.26 13.27 2.04 6.07
H 13 5.51 10.13 23.07 0.73 8.82 10.27 8.63 4.47 2.70
K 9 3.15 0.41 11.28 28.23 4.19 23.08 21.63 4.06 7.01
L 9 0.67 3.57 15.68 28.44 3.14 18.82 17.32 1.78 4.47
M 9 3.15 0.41 11.28 28.23 4.19 23.08 21.63 4.06 7.01
AAPD 3.18 7.46 19.93 15.12 5.74 14.67 12.99 5.89 3.77
APDmin 0.67 0.41 11.28 0.73 0.77 6.48 4.22 1.78 0.40
APDmax 5.54 16.99 30.61 31.29 9.59 23.08 21.63 14.90 7.01
CP 4.87 16.58 19.33 30.56 8.82 16.60 17.41 13.12 6.61
2. Despite the fact that the mixtures under considera-tion vary in composiconsidera-tion (mixtures A, B, K, L and M are characterized with high content of C1 and
low content of C7+), the new EOS is consistent
in the prediction of the molar volume of reservoir mixtures. It has a CP of 4.87, while CP is 6.61 for HK, CP is 8.82 for ALS and CP > 13 for the rest of the EOSs.
CONCLUSION
The work produced a new EOS based on well docu-mented data at three thermodynamic states of critical point, normal boiling point and standard condition. The new EOS is also made to satisfy JT inversion criteria. The new EOS is superior to the existing EOSs and consistent in the prediction of the thermodynamic properties of mixtures and pure uids. The derivation of the EOS is straightforward and educational. ACKNOWLEDGMENT
The authors acknowledge the support of the Ministry of Energy and Mining, Sudan.
REFERENCES
1. Van Der Waals, J.D., Doctoral Dissertation, Leiden, Holland (1873).
2. Peng, D.Y. and Robinson, D.B. \A new two constant equation of state", Ind. and Eng. Chem. Fundam., 15, pp. 59-64 (1976).
3. Soave, G. \Equilibrium constants from a modied Redlich-Kwong equation of state", Chem. Eng. Sci., 27, pp. 1197-1203 (1972).
4. Schmidt, G. and Wenzel, H. \A modied van der Waals type equation of state", Chem. Eng. Sci., 35, pp. 1503-1512 (1980).
5. Patel, N.C. and Teja, A.S. \A new cubic equation of state for uids and uid mixtures", Chem. Eng. Sci., 37, pp. 463-473 (1982).
6. Harmens, A. and Knapp, H. \Three-parameter cubic equation of state for normal substances", Ind. Eng. Chem. Fundam., 19, pp. 291-294 (1980).
7. Adachi, Y., Lu, B.C.Y. and Sugie, H. \A four-parameter equation of state", Fluid Phase Equilib., 11, p. 29 (1983).
8. Lawal, A.S., Van der Laan, E.T. and Thamby-nayagam, R.K.M. \Four-parameter modication of the Lawal-Lake-Silberberg equation of state for calculating gas-condensate phase equilibria", Paper SPE 14269 Presented at the 1985 Annual Technical Conference and Exhibition, Las Vegas, Nevada, September 22-25 (1985).
9. Nasrifar, Kh. and Moshfeghian, M. \Application of an improved equation of state to reservoir uids: Computation of minimum miscibility pressure", J. of Petroleum Science and Engineering, 42, pp. 23-234 (2004).
10. Haghighi, B., Laee, M.R., Husseindohkt, M.R. and Matin, N.S. \Prediction of Joule-Thomson inversion curve by the use of equation of state", J. Ind. Eng. Chem., 10(2), pp. 316-320 (2004).
Springer, Berlin, Germany (2007).
12. Danesh, A. \PVT and phase behavior of petroleum reservoir uids", Elsevier Science, 2nd Edition, Ams-terdam (1998).
13. Spencer, C.F. and Danner, R.P. \Prediction of bubble point pressure of mixture", J. Chem. Eng. Data, 18(2), pp. 230-234 (1973).
14. Yu, J.M., Adachi, Y. and Lu., B.C.Y. \Selection and design of cubic equations of state", ACS Symposium Series, American Chemical Society, Washington, DC, pp. 537-559 (1986)
15. Tododo, A.O. \Thermodynamically equivalent pseu-docomponents for compositional reservoir simulation models", PhD Dissertation, Texas Tech University, Lubbock, Texas (2005).
16. Daubert, T.E. and Danner, R.P. \Physical and ther-modynamic properties of pure chemicals, data com-pilation", Hemisphere Publishing Corp., London, UK (1992).
17. Lide, D.R. (editor), CRC Handbook of Chemistry and Physics, CRC Press, Boca Raton, FL, USA (2005). 18. VDI \VDI-GVC. VDI- Waermeatlas", 10, Au.,
Springer-Verlag, Berlin (2007).
19. Friend, D.G., Ely, J.F. and Ingham, H. \Thermophys-ical property of methane", J. Phys. Chem. Ref. Data., 18(2), pp. 583-638 (1989).
20. Rabah, A.A. and Mohamed, S. \Prediction of mo-lar volumes of the Sudanese reservoir uids", Jour-nal of Thermodynamics, ID 142475, pp. 1-9 (2010). doi:10.1155/2010/142475
21. McCain, W.D. Jr., The Properties of Petroleum Fluids, PennWell Books, 2nd Ed. (1990).
MS Thesis, University of Texas, USA (2006). BIOGRAPHIES
Ali Abdelrahman Rabah received a B.S. in Chem-ical Engineering from the University of Khartoum, Sudan, in 1989. He received his Ph.D. (Dr.-Ing.) from the Institute of Thermodynamics at Hannover University in Germany in 2003.
Dr. Rabah became an Alexander von Humboldt fellow at the University of Helmut-Schmidt in Ham-burg, Germany, in 2008. He is Assistant Professor of Chemical Engineering at the University of Khartoum and a consultant engineer.
Dr. Rabah has authored 14 research papers in local, regional and international journals, and has assumed various academically related administration posts. He is the head of the Chemical Engineering Department at the University of Khartoum and a former Dean of the Faculty of Engineering at the University of Kordofan, in Sudan.
Sumya Abdel Moneim Mohamed obtained B.S. and Ph.D. degrees in Chemical Engineering from the University of Khartoum, Sudan, in 1995 and 2007, respectively. She is Assistant Professor of Petroleum Renery and Transportation Engineering at the Uni-versity of Sudan for Science and Technology, where she is also a consultant engineer and the Head of the Department. Dr. Sumya has published several research papers.
![Figure 1. Temperature-entropy (T-s) diagram (source: [11]).](https://thumb-us.123doks.com/thumbv2/123dok_us/8397785.2231171/3.892.217.694.148.651/figure-temperature-entropy-t-s-diagram-source.webp)
![Table 2. Accuracy of EOSs in the prediction of Z c (data source: [12]).](https://thumb-us.123doks.com/thumbv2/123dok_us/8397785.2231171/5.892.145.771.167.774/table-accuracy-eoss-prediction-z-c-data-source.webp)