Node Density Performance Analysis on IEEE
802.11ah Standard for VoIP Service
Triani Wulandari, Doan Perdana and Ridha Muldina Negara
School of Electrical Engineering, Telkom University, Indonesia
Abstract: The growing of internet and IoT application makes large number of devices will be connected each other to exchange data communication. IEEE made standard of WLAN technology to support the needs. But from the existing standard technologies, there are still deficiencies in delivering the data package for communication. IEEE 802.11ah was made as a new standard of Wi-Fi technology that supports wireless networking scenarios and solving the problem of capacity, coverage and power consumption in IoT era. The wireless access network is very attractive for best-effort data package transmission, but VoIP service on the wireless network is very critical due to its real-time communication characteristic. This research addresses the performance analysis of 802.11 ah standard against VoIP services. To determine the influence of node density in 802.11ah standard, the simulation is done by changing the number of station that access the channel via RAW mechanism. The simulation is performed using network simulator NS3 version 3.23. Based on the result, it can be concluded that the evaluation of IEEE 802.11ah standard in the node density scenario accompanied by the changing of RAW station and RAW group number, the use of MCS 5 with 2 MHz bandwidth resulting better network performance than MCS 7 with 1 MHz bandwidth. Using MCS 5 obtained delay value of 0.241761 s on average, the throughput value of 0,5648 Mbps on average, and the PDR value of 19.84 % on average.
Keywords: IEEE 802.11ah, Restricted Access Window, Network Simulator 3, VoIP, WLAN
1.
Introduction
Nowadays, wireless communications technology in this information era has grown very rapidly [1] due to its superiority in connecting devices without using cable so it can be more flexible and practical. But behind these advantages, wireless technology also has some disadvantages such as large energy consumption, limited area coverage, and limited user capacity. For example, in many cases of Wireless Sensor Network as a development of wireless communication technology has a limited power source [2]. To meet these challenges, IEEE 802.11 as a set of standard for communication of device in WLAN [3] designed a new standard for wireless networks. IEEE 802.11ah standard was released to support wireless network scenario with multiple connected devices, large coverage areas, and limited energy consumption. In use, the IEEE 802.11ah standard meets the needs for M2M Wireless standards such as those used in metering and control utilities, home and industrial automation, eHealth, surveillance, and intelligent transport systems [4].
Currently the development of Internet of Things (IoT) has occurred so rapidly after the introduction of the development of WLAN standards. In IoT, hundreds or even thousands of devices will be interconnected to be able to exchange information with each other. To deal with the seizure of the
channel, the collision and the hidden node problem due to the large number of connected devices, 802.11ah adapts the Restricted Access Window (RAW) mechanism [5]. RAW mechanisms group stations into groups to access channels and make access time divided into multiple slots. Each RAW can consist of several groups and each group consists of one or more slots. Station in group will be served one by one in turn for channel access. So that the station which is not in turn will be in sleep mode and can minimize energy consumption.
In this IoT era, large number of devices will be connected with the internet. The growing of internet application makes VoIP more popular. People tend to choose this communication via internet because it’s easier and cheaper than traditional PSTN [6]. On the other hand, wireless access networks are very attractive for best-effort package delivery, it provides little QoS and is used for kind of service that do not have strict QoS requirements [7][1]. The challenge in VoIP service is the sensitivity to QoS with the need for guaranteed real time data delivery. The time critical application such as VoIP worsen the QoS issue in wireless network. This is because the large overhead involved when transporting VoIP packet which are small in size and are generated very frequently [8][9].
In 802.11ah standard, the RAW mechanism that can allocate large numbers of stations with alternate channel time access can become an issue The channel access mechanism can make a station change into sleep mode and a packet should wait its turn when it's not time to access the channel, whereas real time services such as VoIP need quick access with low delay in its packet delivery.
In this research, analysis of 802.11ah standard performance on VoIP service based on the changing of RAW stations number was done. Some stations access the channel via RAW mechanism and connected to single access point. The changing number of station which is accessing the channel via RAW mechanism indicate the difference of node density in the network channel. This scenario aims to analyze network performance in different RAW group number and MCS used. Furthermore, network performance is measured using simulation results generated by Network Simulator 3 version 3.23. The output from the simulation is QoS parameters such as throughput, delay, and PDR.
2.
Related Works
Several researches about the evaluation and improvement of IEEE 802.11ah standard have been conducted in its PHY and MAC layer. In [10], Le-Tian and the team, have been conducted some research about implementation and validation of IEEE 802.11ah module in Ns-3. They also study the evaluation of RAW mechanisms which was performed on the 802.11ah standard for dense IoT networks in [11], and explained about Homogeneous and Heterogeneous traffic patterns. The simulation is done by the changing of traffic load, station number, and duration of RAW group. The simulation results show that with proper grouping, the RAW mechanism not only increase the throughput and latency value, but also decrease the power consumption within the network.
Yue Zhao has done the simulation about another feature of 802.11ah MAC layer, i.e. TIM implementation in [12]. He focused on energy efficiency analysis in this standard. The scope of this research is to evaluate the energy efficiency of TIM segmentation in uplink traffic assuming Poisson process. The simulation results show that the TIM segmentation on 802.11 ah standard can deteriorate the performance for uplink transmission based on a Matlab system level simulator.
The author [13] analyze the influence of RAW size to the QoS of the network. Small RAW size can increase delay value due to the collision. On the other hand, large RAW size also can increase delay due to the RAW Turn Around time. So, they proposed algorithms to allocating the nodes and change reservation slot duration in RAW period. The research show that the maximum delay of the algorithm is 0.59 s and it is about 2.6 times smaller if we compared to the maximum delay value of 802.11ah standard.
Another performance evaluation of this standard has been analyzed by [14]. This research evaluates the performance of IEEE802.11ah protocol in Local Area Network environment using Markov chain model as analytical model. The theoretical QoS value was calculated with variation in different parameters. With the Markov chain model, increase in retransmission count caused throughput increases. On the other hand, the throughput falls with increase number of nodes in the network.
Several researches study about routing protocols that can be implemented in package delivering process in 802.11ah standard. In [15][16], had been conducted the simulation and analysis of performance and energy consumption of the DSDV and OSLR routing protocols that were applied to the 802.11ah standard. The simulation results were taken through two scenarios, i.e. the changing of distance between stations and access point, and the number of nodes. It can be concluded that OLSR routing protocols yielded better performance when compared to DSDV on energy consumption, throughput, PDR, and average delay parameters. In [17], implementation on AODV and DSDV routing protocols on the RAW mechanism has also been performed through the scenarios, which are the changing of RAW number accompanied by changes the nodes and the duration of RAW. The simulation results show that network performance with AODV protocol better than DSDV when
applied to IEEE 802.11ah standard for throughput, delay, PDR and energy consumption parameters value.
3.
Scenario and System Design
The simulations on this research were performed on Network Simulator 3 release 3.23 with 802.11ah module which has been modified according to [10].
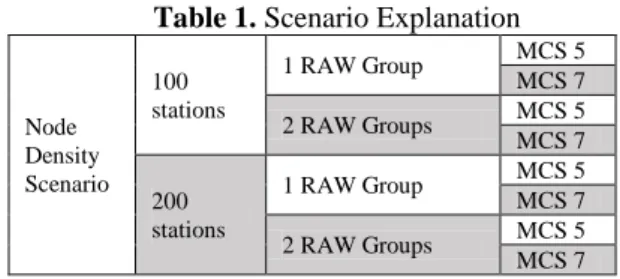
The node density scenario aims to analyze network performance with different network conditions which are affected by the change in node density in each RAW group and MCS. Simulations were performed on 100 and 200 nodes with an increase in the number of RAW stations by 10% of the total number of nodes in the simulation. On each number of station, the simulation were performed in two different RAW groups, and on each RAW group condition, the simulation were performed in two different MCS conditions as explained in table 1.
Table 1. Scenario Explanation
Node Density Scenario
100 stations
1 RAW Group MCS 5
MCS 7
2 RAW Groups MCS 5
MCS 7
200 stations
1 RAW Group MCS 5
MCS 7
2 RAW Groups MCS 5
MCS 7
The amount of payload and data rate used in the simulation is adjusted to the characteristics of payload and data rate on one of the VoIP codecs. The simulation is done using VoIP codec G.729. The G.729 codec is one of the codecs that capable of converting voice into packets with relatively smaller data rate than other codecs, which is 8 Kbps, this causes the G.729 codec to have a more effective and efficient bandwidth utilization that can be used on services over wireless networks that have less bandwidth [18]. Effective and efficient network conditions are required by wireless networks with IEEE 802.11ah standards that capable of allocating stations with large numbers and wide coverage.
Figure 1. Topology of Simulation
In the simulation topology, was placed one Access Point and 100 or 200 nodes of STA around it that illustrated in Fig 1. This research focuses on RAW mechanism in MAC layer of 802.11ah standard. The other features such as TIM segmentation and TwT were not implemented in the simulation.
is transmitted, data transmission time is more important than its integrity [8], it is in accordance with the needs of delivery data on VoIP communications where communication in real time is necessary.
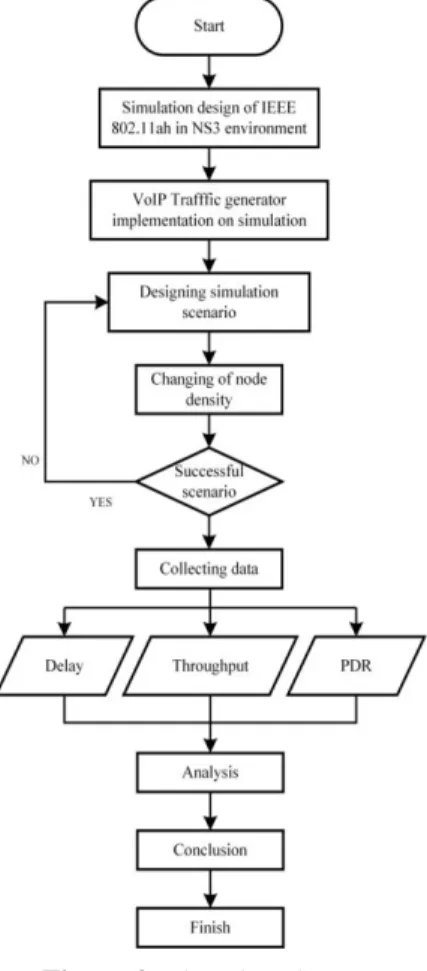
Figure 2. Flowchart System
The flowchart system of this research is presented in figure 2. According to the system, after designing the simulation of 802.11ah standard in NS3 environment, VoIP traffic generator is implemented on the simulation. The node density changing scenario of simulation is designed to collect the data. If the scenarios is succeed, delay, throughput and PDR data can be collected to be analyzed.
The output from the simulation in this research is QoS parameters which are as follows [19]:
- Average End to End Delay, which is the average time of delivering the data package from the sender to the receiver [20][21].
(1) - Throughput, which is defined as the speed (rate) effective for transferring the data. Throughput is total number of packets received in bits divided by the number of delivery time.
(2)
- Packet Delivery Ratio (PDR), which is the ratio between
the number of packets successfully received and the number of packets sent.
(3)
4.
Result and Evaluation
The parameters and its description of the simulation are presented in table 2. The output from the simulation is QoS parameters such as delay, throughput and PDR for node density scenario in IEEE 802.11ah standard for VoIP service which are shown in figure 3 – figure 8.
Table 2. Simulation Parameters
Parameter Description
Physical Layer WLAN/ IEEE 802.11
Transport Layer UDP
Traffic Packet Size 94 Bytes
Traffic Data Rate 8 Kbps
Number of STA 100 and 200
Number of AP 1
MCS MCS 5 (2 MHz
bandwidth and 5200 Kbps data rate) and MCS 7 (1 MHz bandwidth and 3000 Kbps data rate)
RAW Group 1 and 2
RAW Slot 1
Figure 3. Delay on 100 nodes condition
Figure 4. Delay on 200 nodes condition
Figure 4 shows the influence of increasing number of RAW stations against the delay value in the simulation performed on 200 nodes with two different MCSs. In both MCS conditions from the figure, it can be seen that the overall delay value obtained when there are 2 RAW groups is smaller than 1 RAW group condition when there are 200 nodes in the simulation of each MCS. Then in general the delay value obtained on MCS 7 is greater when compared with MCS 5 in each of the same number of RAW groups. Then the highest delay obtained by using MCS 5 for both number of groups condition, there is an increase value of delay with an average of 12.81% from the lowest conditions. Then when using MCS 7 in the network, there is an increase in delay value with an average of 12.05% from the lowest condition. Thus the overall delay value obtained tends to increase slowly along with the RAW station changes in the simulation.
In a simulation with 100 nodes condition, the delay value tends to decrease with the change number of its RAW station. While at 200 nodes condition, the delay value tends to increase with the change of RAW station number. This happens because in the simulation with 100 nodes condition, the greater number of RAW station will be the greater number of nodes that support RAW mechanism and come into the RAW group or RAW slot to access the channel, while the remaining nodes that do not support RAW mechanisms will be decrease and minimize the possibility of a canal seizure or collision. The large number of nodes which access the channel through the RAW mechanism causes the higher probability of success transmitted data and minimizes the delay obtained. Then when we review the simulation with 200 nodes, the condition with higher number of RAW station will generate large delay, it is because in the condition of the same number of groups, the number of nodes that enter into RAW group will increase and exceed its capacity to accommodate a number station, then the large number of nodes in the group will be served one by one in turn by RAW slot in accordance with the RAW mechanism that causes the data transmission process will occur longer and increase the value of delay obtained.
From Figure 3 it can be seen that the simulation performed on 100 nodes with different MCS conditions result in relatively stable delay with values below 150 ms which is a standard delay tolerance for VoIP services issued by ITU-T. Whereas if we review the simulation of 200 nodes with different MCS conditions as shown in Figure 4, the delay value obtained is relatively large above 150 ms, where the value does not meet the standard delay for VoIP service although the delay value obtained still meets the limit
tolerance that is below 400 ms [23]. Acquisition of a large delay value occurs because at the time of simulation, added the background of VoIP traffic that will increase the number of packets sent. With the condition of 200 nodes in the network, traffic conditions will be more crowded and make the delay will be greater if we compare it with network conditions with 100 nodes that are not too dense. So, the greater the number of nodes with the background traffic in the simulation will generates the higher delay value.
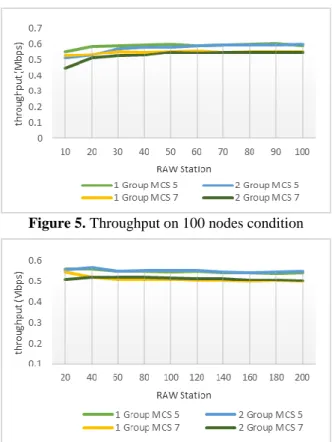
Figure 5. Throughput on 100 nodes condition
Figure 6. Throughput on 200 nodes condition
Figure 5 shows the influence of RAW stations number on the throughput values obtained under simulated conditions with 1 and 2 RAW groups and 2 different MCSs, i.e. MCS 5 (Bandwidth 2 MHz and data rate 5200 Kbps) and MCS 7 (Bandwidth 1 MHz and data rate 3000 Kbps) at 100 nodes. From the figure we can see that the overall throughput value generated by MCS 5 is relatively larger than the condition generated by MCS 7 for the same number of RAW groups. Under simulation conditions using MCS 5, there was an increase of 11.35% on average for both different RAW groups from each of the lowest and the highest throughput value obtained. Then when we review the throughput value generated by MCS 7, we get an average increase of 12.07% in both RAW group at the highest condition. Thus, the overall throughput value for different groups and MCS tends to increase as the number of RAW stations increases.
both different RAW groups from each of the lowest and the highest throughput value obtained. In the simulation condition using MCS 7, there is also a decrease with the fluctuating throughput value with very small difference. A decrease in throughput value with an average of 5.59% for two different RAW groups was obtained from each of the highest throughput and lowest throughput values. Thus, the overall throughput value of 200 nodes in different groups and MCS tends to decrease as the number of RAW stations increases with a very small value so it can be expressed as constant.
In the simulation with 100 nodes condition, the acquisition of the increased throughput value as the number of RAW stations increases is occurred due to the greater number of RAW stations, it will be the greater number of stations that can support RAW mechanisms in the 802.11ah standard. Where on the RAW mechanism, the station is divided evenly into several groups and channel access into several slots which then put each slot in each group. Station can transmit the data only on its time slot comes. If there are large numbers of stations that do not support RAW mechanisms, they will not be grouped into RAW groups that cause the times to access the channel are not arranged, so that all stations outside the group will be mutually scrambling to access the channel and collisions can occur. Therefore, the greater number of stations that support RAW mechanism in the total number of stations contained in the network, the possibility of the seizure of canals and collisions can be reduced, so that data packets sent in the transmission will be greater accepted that causes the throughput value obtained will continue to increase. However, in the simulation with 200 number of nodes condition, the number of stations supporting RAW mechanisms and grouped into RAW groups is larger and makes the queue within the group to access the channel through the same number of RAW slots, resulting a decrease of throughput value even though the values are relatively small so it can be said to be constant throughput value.
Then when we see from Figure 5 and 6, generally the result of the throughput value obtained on each different node number will produce the same state, where the throughput value obtained by using MCS 5 is greater than MCS 7. It happened because by using the MCS 5 (Bandwidth 2 MHz and data rate 5200 Kbps), data rate and bandwidth used is greater than MCS 7 (Bandwidth 1 MHz and data rate 3000 Kbps). With a large bandwidth, it will be the larger channel used for data transmission, and with higher data rates, it will be the higher transmission speed in delivering data package and increase the value of throughput obtained.
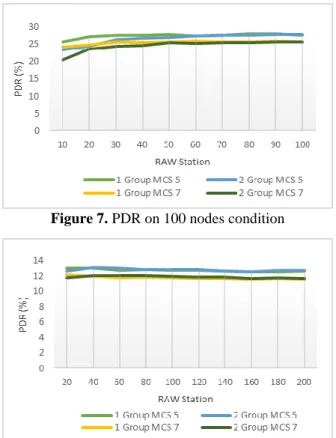
Figure 7 shows the influence of RAW station number against PDR value obtained under simulated conditions with 1 and 2 RAW groups and 2 different MCSs at 100 nodes condition. From the figure we can see that the overall PDR value generated by MCS 5 is relatively larger than the condition generated by MCS 7 for the same number of RAW groups. In the simulated condition using MCS 5, there was an increase of 12.28% on average for both different RAW groups from each of the highest and lowest PDR values. Then if we review at the value of PDR generated by MCS 7, there was an increase value of 13.27% on average in both number of
RAW group in the highest condition. Thus the overall PDR value at different groups and MCS tends to increase as the number of RAW stations increases.
Figure 7. PDR on 100 nodes condition
Figure 8. PDR on 200 nodes condition
Figure 8 shows the influence of increasing number of RAW stations against PDR value obtained in simulations performed on 200 nodes with different MCS and RAW groups condition. In both group conditions from the figure it can be seen that all the PDR values obtained in MCS 7 are greater when compared with MCS 5 in both RAW groups. In simulation condition using MCS 5, there was a decrease with the fluctuating PDR value with very small difference, where the difference of PDR value from the highest and lowest condition for both RAW group was 3.88% on average. In the simulation condition using MCS 7, there is also a decrease with the fluctuating throughput value with very small difference. There was a decreased PDR value by 3.82% on average for both different RAW groups from each of the highest and lowest value. Thus the overall PDR value with 200 nodes in different groups and MCS conditions tends to decrease as the number of RAW stations increases with a very small difference so it can be expressed as constant value.
(Bandwidth 2 MHz and data rate 5200 Kbps), data rate and bandwidth used are bigger than MCS 7 (Bandwidth 1 MHz and data rate 3000 Kbps). The larger the bandwidth used, the larger the channel can be used for data transmission, so that the PDR value will also increase.
5.
Conclusions
The evaluation of IEEE 802.11ah standard in the node density scenario accompanied by the changing of RAW station and RAW group number, the use of MCS 5 with 2 MHz bandwidth resulting better network performance than MCS 7 with 1 MHz bandwidth. Using MCS 5 obtained delay value of 0.241761 s on average, the throughput value of 0,5648 Mbps on average, and the PDR value of 19.84 % on average.
Increasing the number of RAW stations will result in better performance on the network, but in overcrowded network conditions will affect the results obtained so that the selection number of RAW Group, RAW slot and MCS Index must also adjust to other parameters according to the conditions network used.
Network performance based on the simulation results of VoIP service over IEEE 802.11ah standard in this research shows less suitable result to be applied according to real need of network. Another research with a larger number of users and capacity according to the real network condition and simulate it for another services other than VoIP with the customized 802.11ah standard parameters is needed.
References
[1] H. Touil and Y. Fakhri, “A Fuzzy-based QoS Maximization Protocol for WiFi Multimedia ( IEEE 802 . 11e ) Ad hoc Networks,” Int. J. Commun. Networks Inf. Secur., vol. 6, no. 3, pp. 217–225, 2014.
[2] F. Alassery, W. K. M. Ahmed, M. Sarraf, and V. Lawrence, “A Low Computational Complexity Statistical Discrimination Algorithm for Collision Detection in Wireless Sensor Networks,” IAENG Int. J. Comput. Sci., vol. 41, no. 3, pp. 2– 4, 2014.
[3] M. Yazdani, M. Kamali, N. Moghim, and M. Ghazvini, “A Fair Access Mechanism Based on TXOP in IEEE 802 . 11e Wireless Networks,” Int. J. Commun. Networks Inf. Secur., vol. 8, no. 1, pp. 11–17, 2016.
[4] T. Adame, A. Bel, B. Bellalta, J. Barcelo, and M. Oliver, “IEEE 802.11ah: The Wi-Fi Approach for M2M Communications,” IEEE Wirel. Commun., vol. 21, no. 6, pp. 144–152, 2014.
[5] O. Raeesi, A. Hazmi, J. Pirskanen, M. Valkama, and J. Talvitie, “Performance Enhancement and Evaluation of IEEE 802 . 11ah Multi-Access Point Network using Restricted Access Window Mechanism,” in IEEE International Conference on Distributed Computing in Sensor Systems, 2014, pp. 287–293.
[6] S. T. Chandel and S. Sharma, “Experimental Analysis of Various Protocols on VoIP Traffic with Different CODECs in Wireless LAN,” in Fifth International Conference on Eco-Friendly Computing and Communication Systems (ICECCS-2016), 2016, pp. 109–113.
[7] I. Networks, “Stochastic Modeling and Analysis of Feedback Control on the QoS VoIP Traffic in a single cell,” IAENG Int. J. Comput. Sci., vol. 44, no. 1, 2017.
[8] C. Olariu, “Quality of Service Support for Voice over IP in Wireless Access Networks,” Waterford Institute of Technology, 2013.
[9] N. Sirisala and C. S. Bindu, “Recommendations Based QoS Trust Aggregation and Routing in Mobile Adhoc Networks,” Int. J. Commun. Networks Inf. Secur., vol. 8, no. 3, pp. 215– 220, 2016.
[10] L. Tian, S. Deronne, S. Latré, and J. Famaey, “Implementation and Validation of an IEEE 802 . 11ah Module for ns-3,” in Workshop on ns-3, 2016, no. January, pp. 49–56.
[11] L. Tian, J. Famaey, and S. Latr, “Evaluation of the IEEE 802 . 11ah Restricted Access Window Mechanism for dense IoT networks,” in International Symposium on a World of Wireless, Mobile and Multimedia Networks (WoWMoM), 2016.
[12] Y. Zhao, “Analysis of Energy Efficiency in IEEE 802 . 11ah,” AALTO University School of Electrical Engineering, 2015. [13] J. Kim and I. Yeom, “QoS Enhanced Channel Access in IEEE
802 . 11ah Networks,” in International Symposium on Communications and Information Technologies (ISCIT), 2017.
[14] S. Taneeru and P. C. Jain, “Performance Evaluation of IEEE 802 . 11ah Protocol in Wireless Local Area Network,” in Micro-Electronics and Telecommunication Engineering (ICMETE), 2016, pp. 920–925.
[15] M. I. Denatama, D. Perdana, and R. M. Negara, “Analisis Perbandingan Kinerja Protokol Routing DSDV dan OLSR Untuk Perubahan Kecepatan Mobilitas pada Standar IEEE 802.11ah,” J. Infotel, vol. 8, no. 2, pp. 100–106, 2016. [16] M. I. Denatama, D. Perdana, and R. M. Negara, “Simulation
and Analysis of Energy Consumption and Performance of Routing Protocol DSDV and OLSR on IEEE 802 . 11ah Standard,” IJSSST, vol. 17, no. 35, pp. 1–9, 2016.
[17] M. H. Baasir, D. Perdana, and R. M. Negara, “Analysis of Performance and Energy Consumption of the Routing Protocols AODV and DSDV in RAW Mechanism for IEEE 802 . 11ah Standard,” IJSSST, vol. 17, no. 35, pp. 1–6, 2016. [18] A. Chhabra and D. Singh, “Assessment of VoIP E-Model over
802 . 11 Wireless Mesh Network,” in International Conference on Advances in Computer Engineering and Applications (ICACEA), 2015, pp. 856–860.
[19] V. S. W. Prabowo, A. Fahmi, and D. Perdana, “Radio Resources Allocation Based-on Energy Saving for LTE-Advanced System,” e-Proceeding Eng., vol. 4, no. 1, pp. 932– 938, 2017.
[20] D. Perdana and R. F. Sari, “Performance Evaluation of Multi-channel Operation IEEE 1609.4 Based on Multi-hop Disseminatio,” Int. J. Comput. Sci. Netw. Secur., vol. 13, no. 3, pp. 42–47, 2013.