Introducing a method for mapping
recreational experience
Andrej Christian LindholstPhD
Postdoctoral Research Fellow, Forest and Landscape, University of Copenhagen, Copenhagen, Denmark
Nicola DempseyPhD
Lecturer, Department of Landscape, University of Sheffield, Sheffield, UK
Mel BurtonMA, CMLI
Research Fellow, Department of Landscape, University of Sheffield, Sheffield, UK
The provision of recreational opportunities forms an important and long-standing urban planning and management objective. However, considering a range of experiences encountered when in such spaces currently does not form part of existing open space assessment tools in the UK. In this paper, ’rec-mapping’, an innovative method of analysing and mapping positive recreational experiences in urban green spaces, is explored and piloted within the UK planning context. Originating in the Nordic countries, this on-site method can provide urban planners and designers with data about the extent to which specific green spaces provide and support a range of recreational experiences. The exploration reported here is based on a short review of the method’s background and an application in two test sites in Sheffield, south Yorkshire, in early summer 2010. This paper critically appraises the application of rec-mapping at smaller spatial scales and recommends further explorations within the UK planning context, as the method adds to existing open space assessment by providing a unique layer of information to analyse more fully the recreational qualities of urban green spaces.
1. Introduction
The long-term value and function of urban green spaces can be attributed to their potential to support recreation activity, which in turn contributes positively to the wellbeing and health of urban populations. In the UK, this is reflected in the origins of the public park, established during the Victorian era when they were created as spaces in which residents could escape temporarily from everyday urban life, get some fresh air and take a walk; all long identified as having health benefits (Conway, 1991). While leisure and recreational activities now are different to those of the Victorian age, it can be argued that the ecological, social and economic values and functions remain mostly the same (Newton, 2007). In this way, urban green spaces and their recreational function continue to form an important component of the urban landscape. From a planning perspective, the challenge is to deal with the recreational qualities of urban green spaces in a way that is meaningful and supports the urban population to use these spaces.
UK planning authorities often approach the conceptualisation of recreational functions through categorisations of urban green space using broad and arguably vague terminology such as ‘country park’, ‘city park’, ‘local park’, ‘garden’, ‘sports facility’, ‘woodland’ and ‘playground’ provided in inventories such as Planning Policy Guidance 17 (DCLG, 2002). Minimum quality standards for facilities and levels of maintenance are set
by national bodies and are measured using tools such as the local environmental quality survey of England and the Green Flag Awards. However, these tools do not measure the recreational value of these urban green spaces or the recreational experience to be had therein. Perhaps because recreational quality is so deeply rooted in our shared under-standing of urban green spaces as recreational space per se, and these spaces are routinely assessed through objective char-acteristics, standards and designs, this quality is often not acknowledged in any systematic way as dependent on one’s personal experience of a space rather than objective and quantitative measures.
in two sites in Sheffield are then critically explored. The paper finally discusses the methodological challenges and provides reflections and recommendations of applying rec-mapping in a UK planning context.
2. Qualitative assessment in the UK planning and design context
The benefits of green and open space in urban areas have long been cited and recognised in UK policy (Bell et al., 2007; DCLG, 2006) and there has been a sustained commitment to improving green and open space over the past decade or so (DCLG, 2007). Recent budgetary cuts may, however, have implications for the continuity of this trend. Within current government policies are a number that relate to sustainable communities and liveability, which support the claims that high quality living environments can have a positive influence on the everyday life of users and residents (Dempsey, 2009). In practice, this manifests itself as the increasing use of consulta-tion, which has become an important part of the formal urban planning and design process in the UK. The Local Government Act, 1999 made it a legal requirement for local authorities to consult widely with users on aspects of the activities and services provided, marking a move towards a modernised agenda of localised decision-making (Burgess et al., 2001).
Several methods of qualitative assessment exist that can contribute to decision-making about green space improve-ments. These measure open spaces at varying levels of detail with emphasis on users’ opinions. At one end of the spectrum, relatively broad-brush data are collected for the local environ-mental quality survey of England. This is undertaken by trained surveyors using a range of indicators including cleanliness, ‘environmental crime’ such as graffiti and stan-dards of maintenance (Keep Britain Tidy, 2010). As they do not ask users about their opinions it can be described as an ‘expert-led’ assessment method.
A more inclusive approach can be found in GreenSTAT, an online tool that allows residents to comment anonymously on the quality and use of their local open spaces (GreenSpace, 2006). The survey questions, however, are closed providing little opportunity for in-depth commentary on what in particular users like or dislike. The resulting aggregated datasets of ‘accurate and reliable visitor feedback’ are only accessible by local authority practitioners and are used as part of their process of ‘informed decision-making’ (CABE Space, 2010; GreenSpace, 2010).
GreenSpace advises that GreenSTAT can be incorporated into entries for the Green Flag Award. This scheme assesses and promotes high quality urban parks and green spaces and has become a significant ‘quality’ benchmark (DCLG, 2006).
Assessment is undertaken by trained Green Flag judges using a range of objective measures such as cleanliness and the presence of a management plan. A qualitative assessment is made, which measures perceptions of how welcoming, safe and healthy a place feels (Greenhalgh and Parsons, 2004). Evidence of community involvement, consultation and community-led activities must be provided but the assess-ment does not call directly on users’ opinions and percep-tions of the space. Specific reference is made to recreation insofar as the management plan must ‘demonstrate that there are appropriate levels of recreational facilities and opportunities for all sectors of the community’ (Civic Trust, 2008, p. 12) but there is no focus on users’ recreational experience per se.
A more direct assessment of green space is provided by Spaceshaper as a method of measuring the quality of space combining quantitative and qualitative assessments (CABE Space, 2007). It is a participatory appraisal method in which stakeholder participants, led by a trained Spaceshaper facilitator, rate the site against a range of characteristics that relate to use, access, community, design and how the space makes them feel. While Spaceshaper allows participants to comment on the activities and opportunities provided by a space, it does not measure the recreational experience further than asking how the participants ‘feel’ about the space. Spaceshaper results have been applied in different ways including incorporation into future urban designs and plans, and adoption as a means of assessment by local authorities (CABE Space, 2007).
Finally, experiential landscape mapping offers a further example of measuring experience in the environment. Applied at a variety of scales, experiential landscape mapping has been developed to shed light on how people attach significance and value to places, how people orientate themselves when in an environment and how a sense of belonging is developed (Thwaites and Simkins, 2007). It differs from ‘rec-mapping’ as it is broader in its scope and scale, focusing on a wide range of experiences. Examples of its application include contribution, through participa-tion with users, to a rural village’s design statement and to create designs for improving school grounds (Experiential Landscape, 2010).
a difference to residents and users of open spaces (Experiential Landscape, 2010). The next section presents rec-mapping as a method that addresses this gap.
3. ‘Rec-mapping’: measuring recreational experience
In the Nordic countries – particularly in Sweden, Denmark and Finland – various research and planning efforts over the past 25 years have sought to elaborate systematic measurement and analysis of the recreational qualities of urban green spaces. Methods developed to do this – and what we here call ‘rec-mapping’ – have been applied to help planners and designers understand the recreational qualities of urban green spaces based on how the urban populations perceive and experience these spaces. The tradition includes methods that integrate various research-supported concepts such as ’park characters’ (Berggren-Ba¨rring and Grahn, 1995; Nordh, 2010), ‘experience worlds’ (Regionplane-och trafikkontoret, 2001), ‘experience values’ (Caspersen and Olafsson, 2006), ‘sociotopes’ (Sta˚hle, 2006), ’social values’ (Tyrva¨inenet al., 2007) and ‘experience classes’ (Caspersen and Olafsson, 2010; Olafsson, 2012). Common among these methods is the focus on observation/ registration of various physical characteristics of recreational qualities in urban landscapes in the operationalisation of theoretical concepts for the purpose of planning and manage-ment support.
Building further on the tradition’s core focus on a range of important recreational qualities, Grahn and Stigsdotter (2010) proposed a change by viewing people’s experience of positive recreational qualities as a set of so-called ‘perceived sensory dimensions’. In line with methods and findings in earlier research (especially Berggren-Ba¨rring and Grahn, 1995), they confirmed that the Swedish population perceives recreational experience in urban green spaces through eight dimensions. The eight experiences are listed and described in Table 1. Each experience is furthermore associated with various recreational and outdoor activities.
Applications that use a ‘perception-based’ approach have subsequently been developed. The focus in operationalisation has centred on perception and cognition rather than observation/registration of physical characteristics. Based on such an approach, Randrup et al. (2008) addressed broader knowledge needs, such as health promotion, in a planning situation in Denmark through the identification of recreational experiences by means of on-site analysis. Subsequently, Schipperijn (2010) applied this method in a range of studies of the quality and public use of green spaces and and Lindholst (2010; Lindholstet al., 2010) adopted and modified the method further for practical application in park and nature management.
Initially, Randrupet al. (2008) developed a highly formalised and expert-based procedure for rec-mapping with the aim of achieving a high degree of quantification as a measurement (calculated as a total aggregated score) for an urban green space’s recreational value. A score from 0 to 3 was given for each experience in predefined zones. In order to make the designation of zones relatively objective, a method for dividing a park into zones was derived from Gustavsson and Ingelo¨g’s (1994) classification and identification of ‘forest rooms’ into different types with relatively objective characteristics. The identification of four ‘room types’ (‘open’, ‘semi-open’, ‘clearing’ and ‘enclosed’) was applied to zone a site. Aggregate scores for each zone were weighted against the relative size of the total area. Schipperijn (2010) tested this approach against the perceived attractiveness and found no statistical evidence that high scores correspond to attractive urban green spaces in the eyes of users. A reason for the suspected inappropriateness of using quantitative measures to assess recreational qualities may be that, just as urban green spaces can be viewed as ‘restorative pauses’ within the built-up environment, ‘pauses’ may also be needed between experiences in order to comprehend and appreciate their qualities. Although intuitively understandable, ‘more’ is not necessarily ‘better’. Following the understanding devel-oped by Regionplane-och trafikkontoret (2001, 2004) in their work on ‘experience worlds’ in the green structure in the Stockholm region, it can be argued that ‘buffer zones’, or transition spaces, are needed with no recreational experiences within a high quality recreational urban green space. Likewise, Sta˚hle (2006) warned that the benefits arising from the inherent heterogeneity of urban space may recede if focus shifts from complementarity to substitutability. Each experi-ence may therefore in itself better be viewed with no innate ranking order in their potential worth and use value. On the other hand, representation of an experienced space within planning necessarily does imply a certain level of reduction-ism or quantification (Sta˚hle, 2006). For example, Grahn and Stigsdotter (2010) found that from a health perspective some (combinations of) experiences are in general more beneficial than others. Following Sta˚hle (2006), the challenge for city planning is then to produce a practically useful method, which at the same time meaningfully represents the valued places and experiences of users.
influenced and learned through socialisation and shared information – or what Faehnleet al. (2011) call ‘intersubjective action’, and is context dependent. It also implies that cognitive categories (i.e. the dimensions of the recreational experience) may differ across boundaries and contexts. It therefore follows that experiences in a Swedish or Nordic context may not be valid to the same extent in a UK context.
With the importance of representation and context in mind, Lindholst et al. (2010) (and Lindholst, 2010) suggested a pragmatic procedure that tailors rec-mapping to its context. This allows the procedure to be highly adaptive to purpose, methods, participants, communication needs and circum-stances, and enables various understandings of the recrea-tional qualities at different scales within a particular green space. A drawback of tailoring the procedure is its limiting potential for comparing different sites’ recreational qualities across larger spatial entities (e.g. all green spaces across a city or region) within the planning system. However, a highly tailored procedure allows a deeper qualitative under-standing of a site or an exploration of the method itself as presented here. Rec-mapping was applied in a pilot study at
two sites in Sheffield, UK, as a pragmatic and context-sensitive procedure.
4. Rec-mapping in Sheffield: piloting the method
The pilot study was organised as a 2-day workshop, in which an adapted version of rec-mapping, its merits, theoretical background and proposed application were introduced and subsequently tested in two sites with researchers and practi-tioners and subjected to a post-exercise evaluation. The workshop was conducted in Sheffield in the summer of 2010 with practitioners from Sheffield City Council, South Yorkshire Forest Partnership, members of a community organisation (Friends of Firth Park), and researchers repre-senting different academic disciplines from the Universities of Copenhagen and Sheffield. Two sites in Sheffield were selected as test sites. At the time of the exercise, these sites were targeted for urban regeneration investment. The two test sites were: Firth Park, a well-functioning and well-visited Green Flag awarded Victorian park located in a residential area in the north of the city, which was redeveloping a largely unused and disconnected area of the park that offered few facilities and Nominal name Short description/interpretation Important characteristics
Nature Experience of the free-growing, untouched, vital, ‘an encounter with nature’
No visible man-made facilities or traces, visible or audible. ‘Natural areas’.
Richness in species
Experience of richness in plants, insects and/or animals
Presence of different or special plants, flowers, insects and/or animals. Possibility to gather mushrooms, fruits, etc.
Serene Experience of an undisturbed peacefulness, to be on one’s own, in safety and withdrawn, ‘at one with natural surroundings’
No artificial noise (e.g. transport), few or no other humans, no litter, no paths/transport corridors.
Space Experience of an independent, homogeneous, inter-connected and special ’universe’
No cross-cutting paths or disturbing features. At least two types: an ‘avenue of old beech trees’ or ‘an open horizon’, e.g. at a lake/the sea.
Refuge Experience of safe surroundings and facilities for expression, play and interactions with other people
Demarcated and uncluttered space/place by trees, bushes, fences. Play facilities, tables/benches, meet animals, e.g. ‘playground’.
Prospect Experience of open and free surroundings for expression and activity
Open and accessible space with grass/sports fields. Supporting facilities such as lighting, changing rooms: ’the common’.
Social Experience of an organised and entertaining scene and getting together with other people
Facilities, services, activities, cafe´, restaurants, benches, tables, barbeque and entertainment: ‘a social scene’. Cultural Experience of cultivated, man-made surroundings
formed by history and/or culture
Historical features and buildings, sculptures, statues, fountains, canals, flower stands, well-manicured bushes, formal elements: ‘historical and cultural space’.
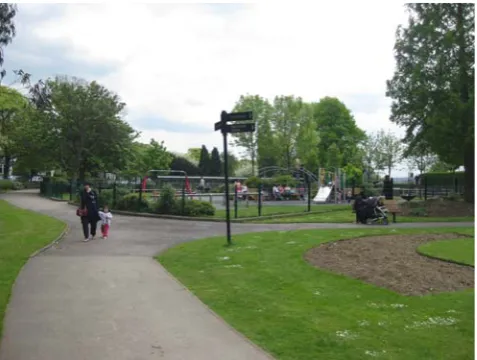
attracted very few visitors; and the South Street Open Space, part of Sheaf Valley Park, a run-down green space located in the city centre behind the city’s railway station, associated with antisocial behaviour including drug use and largely used by local residents to access the station and city beyond. Figures 1 and 2 provide aerial maps of the spaces. There is a key difference between the two sites: Firth Park had a considerable number of recreational facilities while Sheaf Valley Park had none.
4.1 Firth Park
Firth Park is situated 3 miles (4?8 km) north of Sheffield city centre and is approximately 15?2 ha in size (Figures 1, 3 and 4). Firth Park is listed by Sheffield City Council as a city park and heritage site, and is on the English Heritage register of parks and gardens of special historic interest (SCC, 2009). The features of the park are varied: woodland, open amenity grassland areas, specific sports facilities (including bowls, cricket and basketball), children’s playground and community buildings. A historic clock tower, former boating lake and
[image:5.595.306.551.142.436.2]Hinde Common Wood are situated on one side of a main road, Firth Park Road, with the rest of the park and recreational and community facilities on the other side.
Figure 1.Aerial map of Firth Park. The solid line shows the park boundary; dotted line indicates an area under redevelopment in 2010–12
[image:5.595.55.301.143.459.2]Figure 2.Aerial map of Sheaf Valley Park. The solid line shows the park boundary; dotted line indicates an area under redevelopment in 2010–12
[image:5.595.311.549.556.733.2]Firth Park is one of Sheffield’s oldest and most historic parks, opened in 1875, and fell into decline in the late 1970s. The establishment of the ‘Friends of Firth Park’ group in 1999 was central to the reversal of Firth Park’s decline (Burton, 2010). The rec-mapping exercise was conducted in all parts of the park apart from Hinde Common Wood due to time constraints.
4.2 Sheaf Valley Park
Sheaf Valley Park was the name given to a new city park underpinned by a vision of linking a series of open spaces
[image:6.595.47.286.144.324.2]from the city centre to Norfolk Park, one of the city’s oldest public parks, situated 1 mile (1?6 km) south-east of the city centre, which are undergoing a process of regeneration (Figures 2, 5 and 6). The rec-mapping exercise was conducted in one part of Sheaf Valley Park owned by Sheffield City Council and referred to as the South Street Open Space. This space is located on a steep incline situated between the Park Hill flats and wider residential area beyond and the train station, which acts as gateway to the city centre (SCC, 2012). The site’s function as a green corridor between residential areas and the train station/city centre is illustrated in Figure 5. This space was mainly used as a through-route as, apart from the steep banks of grass, there are no benches or sitting areas in which people might linger. Antisocial behaviour has been a problem due to poor lighting, no natural surveillance as there are no houses overlooking the space, and clusters of trees where drug-taking and drinking has taken place in the past. The South Street Open Space arguably had a reputation for being something of a forgotten or ‘non-space’ and was targeted for regeneration (MP4 Project, 2010).
4.3 Applying the method
Before conducting the rec-mapping, the participants attended a class-based session, which focused on the background and general understanding of the eight experiences and outlined the practicalities of carrying out a site analysis based on these experiences. Through early feedback from participants, it became clear that there were some difficulties in applying the terms as described in Table 1 because of differences in language interpretation and cultural understandings. For
[image:6.595.301.539.554.733.2]Figure 4.A early spring view of playgrounds and facilities in Firth Park
[image:6.595.47.284.564.744.2]Figure 5.A typical view of greenery in Sheaf Valley Park
example, some participants highlighted ‘prospect’ as an inaccurate description of how they might interpret the term. When interpreting this particular dimension, Grahn and Stigsdotter (2010) make reference to the idea of hunting grounds and savannahs, whereas the participants interpreted it as a term indicating broad views across and out of the park. This issue is illustrated in Figure 6.
The tools for the on-site analysis were site maps and pens to mark the presence and strength of participants’ experiences. Participants were divided into small groups and asked to mark experiences according to where they occurred on the site map, as ‘zones’, and their perceived strength indicated on a scale from 0 to 3 (from ‘no’ to a ‘full’ experience). The exercise was conducted in both parks. Participants were asked to record the presence and strength of experiences by a process of interpreting and discussing their perceptions of the particular space and, when necessary, with reference to local knowledge. The process was subject to ongoing discussions in the groups. The groups were also encouraged to take photographs and notes to provide information explaining their decisions.
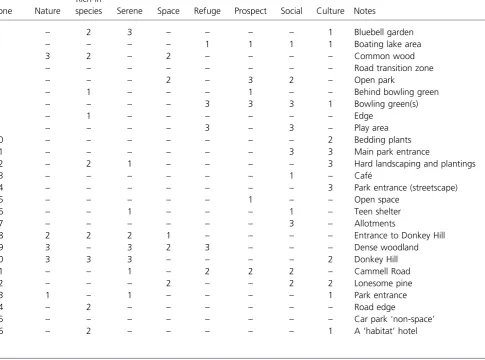
The results of the on-site analysis for Firth Park are summarised in Table 2 and graphically depicted in a ‘thematic’ rec-map (Figure 7). Experiences (and their zones) were found to overlap creating multi-experiential spaces in different ways. It could be tempting to aggregate scores for each experience in Table 2 in order to identify the most defining experiences for Firth Park. However, such a step is problematic due to the issues discussed relating to aggregation of what is basically held to be qualitative information. It should also be noted that the graphical representation of the rec-map based on the data table for Firth Park could be presented differently. Formats may be adapted to meet communication needs in other planning contexts. Sheaf Valley Park was also mapped for recreational experiences but a data table and maps are omitted in this paper as no recreational experiences of illustrative importance could arguably be recorded. Figure 5 illustrates a typical scene in Sheaf Valley Park. Low experience of refuge and space could be recorded, but the design and features of the park did not inspire such experiences in any measureable degree. Nuisances such as a noisy soundscape, litter and an unsafe feeling were found to reduce any potential positive experiences. The lack of clear recognisable experiences was also observed to frustrate the participants as learners of the method. The contrast in the level of experiences between the two test sites points to the conclusion that to be useful for learning purposes a site must contain a stronger set of experiences.
The exercise revealed interesting aspects about the rec-mapping methodology. As the exercise was a learning event for the
groups, the thematic maps are not accurate in the sense that the same groups would reach the same result if they did the same exercise again (now as more experienced rec-mappers). More zones and experiences would possibly be recorded as groups developed greater sensitivity to experiences and became more able to identify them, both aspects that might increase the longer they spent on site.
The zones defined in the map in Figure 7 were not designated in advance of the exercise or draw systematically on a formal predefined understanding of what constitutes a zone (such as the four room types). A potential issue with using pre-defined zones before identifying experiences is that, unless a park is unusually well designed, some experiences that may be associated with larger zones may actually only be found to be present to a certain extent. This would lead to inaccuracies in the subsequent graphical representation (as well as in the case of quantification). Without a set of predefined zones or clear methodological rules, designating a site and graphically representing zones are somehow subjective – or highly context dependent. The accuracy would then depend on clear specification of the planning purpose driving and guiding the mapping exercise. The context-dependent approach allows a decision to be made on how ‘deep’ a map should go in identifying experiences and their zones. This might vary from a rough perception of a large area to mapping the detailed differences in one’s experience that occur by moving just a few metres. In a planning situation there might be a need to assess the overall character of a space (e.g. does it have nature or culture qualities) or to focus on redesigning a space to establish small refuge areas.
Learning was the main purpose of the exercise. How to record zones was therefore left as a matter of deliberated choice for the groups. Experiences and zones were identified at different spatial scales and, in some cases, were justified by clear cues for demarcation such as fenced areas such as playgrounds or the structure of the landscape (with visible correspondence with one of the four room types) and in other cases the clues were more uncertain due to unclear or blurred transitions between zones.
to cover spatially different experiences within the same demarcation.
In earlier methods such as park character analysis, ‘nature’ and ‘culture’ (and ‘serene’ and ‘social’) would somehow be seen as mutually exclusive. Indeed, Berggren-Ba¨rring and Grahn (1995) found that the difference between these two properties represents the most fundamental clue in our perception and characterisa-tion of urban green spaces. In general, this makes sense, but in the pilot study these experiences were also found to co-exist in some zones of Firth Park, notably, in zone 20 (Donkey Hill). A mix of dense wild-growing forest and formal wood sculptures and colourful bird boxes gave rise to mapping these experiences within the same zone. Also in zone 7, a bowling green, apparently exclusive experiences in the form of refuge and prospect are found to co-exist. This was evaluated to be a result of a potential mixed use of the space depending on time and user groups.
5. Reflections on the application of rec-mapping
Throughout the process, comments and reflections were primarily documented by means of handwritten notes, supplemented by photographic material, graphical presenta-tions and rec-maps. An internal report was written up including sections on rec-maps and site analysis, collection of reflections made by practitioners and researchers, and various other materials. Based on these materials, the researchers elaborated a range of reflections that aimed to assess rec-mapping’s merits as a planning method in the UK.
The rec-mapping process allows people to focus their attention on a space while spending time within it making on-site observations, which they may never have done before. It provides a ‘snap-shot’ of experiences and their location within a site and can easily be conducted again at a later date if refurbishments are carried out,
Zone Nature
Rich in
species Serene Space Refuge Prospect Social Culture Notes
1 – 2 3 – – – – 1 Bluebell garden
2 – – – – 1 1 1 1 Boating lake area
3 3 2 – 2 – – – – Common wood
4 – – – – – – – – Road transition zone
5 – – – 2 – 3 2 – Open park
6 – 1 – – – 1 – – Behind bowling green
7 – – – – 3 3 3 1 Bowling green(s)
8 – 1 – – – – – – Edge
9 – – – – 3 – 3 – Play area
10 – – – – – – – 2 Bedding plants
11 – – – – – – 3 3 Main park entrance
12 – 2 1 – – – – 3 Hard landscaping and plantings
13 – – – – – – 1 – Cafe´
14 – – – – – – – 3 Park entrance (streetscape)
15 – – – – – 1 – – Open space
16 – – 1 – – – 1 – Teen shelter
17 – – – – – – 3 – Allotments
18 2 2 2 1 – – – – Entrance to Donkey Hill
19 3 – 3 2 3 – – – Dense woodland
20 3 3 3 – – – – 2 Donkey Hill
21 – – 1 – 2 2 2 – Cammell Road
22 – – – 2 – – 2 2 Lonesome pine
23 1 – 1 – – – – 1 Park entrance
24 – 2 – – – – – – Road edge
25 – – – – – – – – Car park ‘non-space’
26 – 2 – – – – – 1 A ‘habitat’ hotel
[image:8.595.52.538.154.514.2]–5no experience; 15weak experience; 25good experience; 35full experience
as it is not an overly time or cost-intensive method of data collection. A further benefit of the methodology is how it can be summarised in a range of formats including data tables, rec-maps, photographs, keywords and descriptions, and integrated into a geographic information system (GIS).
The methodology is relatively robust and research based, with theoretical and empirical underpinnings, and provides an analytical approach to understanding people’s perceptions of space using a simple rationale framework. In addition, it provides planning and design professionals with a tool for site management
Nature
Space
Social Culture Zone identification
14 12 13
25
17 19
18
20 21
22 5 24
23 26
4
2 3 1 15
16 10 8
9 7 7
6 11
Key for all rec-maps
No experience Weak experience Good experience Full experience
Colour codes for experience strength
Refuge Prospect
Rich in species Serene
[image:9.595.115.502.143.677.2]N
and forward planning, which can highlight areas of potential development and investment. It also provides experts and users with an opportunity to engage in dialogue about local spaces that are important to the community or may be in the future.
Beyond the specification of purpose, the ‘accuracy’ of rec-mapping also seems to depend on several dynamic aspects that are not always present when conducting an on-site analysis. These include the ability both to filter certain temporary influences away such as weather conditions or one’s individual mood on that particular day. Taking local knowledge into account is also important; this may relate to existing knowl-edge about particular user groups and behaviours, or about specific trees and plants, such as a bluebell glade, which may not be in flower. Both the ability to create and read a rec-map meaningfully requires knowledge on how to interpret experi-ences in particular circumstances and understand their importance for the recreational value, according to the descriptions provided in Table 1.
There are some drawbacks to rec-mapping that became apparent throughout the pilot exercise. The methodology does not allow participants to account for how people actually use spaces as it is perception-based and focused on the location of the various potential experiences. It is for this reason that planners and designers alone should not conduct the rec-mapping exercise as they are not necessarily local residents or users of the space; it is important that local users are involved in the process to provide contextual information. Gauging the experiences of different user groups is not wholly possible using the rec-mapping methodology unless ‘user groups’ are repre-sented – for example, ethnic minority groups/teenagers – which requires a desire to be involved that cannot always be assumed.
Another drawback of the methodology is that it currently only focuses on positive experiences and not negative ones, under-lining the assumption that people actively seek positive experiences in green spaces (Grahn and Stigsdotter, 2010). Nuisances are thus only recorded insofar as they reduce positive experiences. This is an oversight in an applied exercise because there may be parts of a park that people avoid due to negative experiences; with this information added, planners and designers could use rec-mapping as a way of identifying areas that are perceived in terms of negative experiences. Tyrva¨inenet al. (2007) suggested and mapped three important negative experiences (‘scariness’, ‘unpleasantness’ and ‘noise’) at the city scale in Helsinki, Finland. Such negative experiences might be adopted for further innovation of an applied method. A further drawback was highlighted and related to the experience one has at the park entrances and in other ‘transition’ or ‘buffer zones’ as described earlier. It is to be expected that users would have different experiences in these ‘transition’ spaces but this factor needs to be incorporated into
the methodology to capture the experience of passing from one kind of space to another. Qualitatively, such spaces also indicate and/or delimit any ‘positive’ experience in nearby spaces by providing a clear clue or contrast for the change in one’s experience.
On the other hand, rec-mapping allowed participants a new language for describing their recreational experience and to locate these through zoning the park. For example, partici-pants were able to identify multiple experiences, such as the experience of nature, serene, space and refuge in the area of dense woodland around Donkey Hill in Firth Park (area 19). This kind of qualitative information cannot be measured or captured using existing green space characterisations, which are limited to a description of the features (e.g. woodland) or uses (e.g. walking) in a space. This is particularly interesting when examining spaces that have little recreational value; while objective measures may record Sheaf Valley Park as biodi-versity-rich green space with ecological benefits, the personal experiences collected by means of rec-mapping highlight strongly the lack of recreational experience to be had therein, indicating a need to improve it with users in mind.
It should also be noted that there were some limitations of the pilot investigation itself. The rec-mapping was not trialled with as wide a range of stakeholders as was hoped. For this reason, it is not possible to be completely sure that all experiences and recreational values are recorded. Although user groups were included in the rec-mapping exercise, the pilot study did not provide a basis for any suggestion regarding the possible role and benefits of user and public participation in rec-mapping at small spatial scales. As a proposal, user involvement may be done by standard procedures as described by Cowan et al. (2010). Results based on rec-mapping would form part of the planning process as information for further deliberation by various stakeholders including users and the public. In comparison, information on recreational experiences has mainly been integrated into planning in Sweden and Finland through surveys of general preferences at city level.
The current state of affairs renders the proposed rec-mapping procedure as a job ideally for a group of professionals possessing both local knowledge and rec-mapping expertise. However, this comes with a caveat. Based on her work with the park character analysis, Nordh (2010) recommended that experts with no special interests carry out or oversee the procedure as professionals within an organisation may have particular interests that bias the procedure and results.
differences may have endowed the population (and groups within the population) with a different set of perceptions. In Denmark, some municipalities have added new experiences such as ‘urban nature’ in order to adapt existing frameworks to important experiences present in the local environment (Vestegnssamarbejdet, 2011). However, it is clearly beyond this paper to identify or confirm relevant cognitive dimensions for the UK population. It should be noted though that the experiences represented in Table 1 were considered relevant in the pilot study. New research within the UK context based on the same methodology as applied by Berggren-Ba¨rring and Grahn (1995) and Grahn and Stigsdotter (2010) could be intriguing and address this issue fully.
Two specific sites were examined, which, while providing usefully divergent examples, are not fully representative of urban green spaces and more sites need to be rec-mapped in the UK to test the robustness of the methodology and confirm the applicability of the terminology used. The pilot study in Sheffield was applied to small spaces, but methods for larger spatial scales could also be relevant to the UK planning context. This includes methods developed for the identification of recreational qualities at regional scales such as the method forwarded by Caspersen and Olafsson (2010). A large spatial scale approach would also address some of the shortcomings of the localised and contextualised slant of rec-mapping as applied in the pilot study in Sheffield. For example, a more objective designation of experience zones would enable more reliable information for comparison and planning at city or regional level.
6. Conclusions
There is currently no statutory obligation for evaluation to form a part of planning processes in the UK, despite being widely supported as providing important information not collected elsewhere (Dempsey and Burton, 2012). In general, it is advisable for planners and designers to take a pragmatic and collaborative approach to understanding how a space is used and might be used in the future. The pilot shows that rec-mapping is a useful tool for effectively ‘zoning’ a space and getting an understanding of users’ potential recreational experience(s) in different parts of that space. It provides a new language for identifying the potential for improvement with the advantage that it is not simply immersed in discussions about characteristics and features such as inventories or maintenance standards, but also about the quality and location of recreational experiences. The pilot shows that as rec-mapping does not provide a framework for an exhaustive qualitative character-isation; it should complement other methods of green space measurement to contribute to a fuller understanding of the site(s) in question. While the eight experiences ‘made sense’ in the pilot project, it was also clear that it is necessary to consider the context within which rec-mapping is conducted, and that some aspects of the methodology may need to be adapted (such as specific terms used and spaces explored) beforehand. Overall, rec-mapping
provides a new layer of information that cannot be measured in existing qualitative open space assessments. Alongside other, more objective methods, rec-mapping is a relatively robust method for evaluating recreational quality and can provide planners and designers with an improved understanding of the recreational qualities of a site, and can help identify potential areas for recreational improvements. These merits mean that rec-mapping fits well into typical planning processes and adds to the pool of information on which sound planning and investment decisions should be based.
Acknowledgements
Activities carried out as a part of the basis for this paper have been undertaken within the EU NSR Interregional IVB project: ‘Making places profitable – public and private open spaces’ (MP4). The authors would like to thank the participants in the rec-mapping workshops and colleagues at Forest and Landscape, University of Copenhagen and South Yorkshire Forest Partnership for their assistance and comments.
REFERENCES
Bell S, Montarzino A and Travlou P(2007) Mapping research priorities for green and public urban space in the UK. Urban Forestry and Urban Greening6(2): 103–115. Berggren-Ba¨rring AM and Grahn P(1995)Gro¨nstrukturens
betydelse fo¨r anva¨ndningen: en ja¨mfo¨rande studie av hur ma¨nniskor i barnstugor, skolor, fo¨reningar, va˚rdinstitutioner m fl organisationer utnyttjar tre sta¨ders parkutbud. Landskapsplanering Rapport 95:3, pp. 1–310. Sveriges lantbruksuniversitet, Alnarp, Sweden.
Bourassa SC(1990) A paradigm for landscape aesthetics. Environment and Behavior22(6): 787–812.
Burgess P, Hall S, Mawson J and Pearce G(2001)Devolved approaches to local governance: Policy and practice in neighbourhood management. Joseph Rowntree Foundation, York, UK.
Burton M(2010)MP4 WP2.1 Peer Review of Model Agreements for Place-keeping: Friends of Firth Park and Sheffield City Council. Working paper, South Yorkshire Forest Partnership, Sheffield, UK. Available on request at http://www.mp4-interreg.eu (accessed 17/03/2012). CABE Space(2007)Spaceshaper: a user’s guide. CABE, London,
UK.
CABE Space(2010)Urban Green Nation: building the evidence base. CABE, London, UK.
Caspersen OH and Olafsson AS(2006)Oplevelsesværdier og det grønne ha˚ndtryk. En metode til kortlægning og udvikling af friluftsoplevelser i hovedstadsregionen. By-og
landsplanserien. Nr. 27-2006. Center for Skov, Landskab og Planlægning, KVL, Hørsholm, Sweden.
greater Copenhagen.Urban Forestry and Urban Greening 9(2): 101–112.
Civic Trust(2008)Park and green space self assessment guide: A guide to the self assessment of the quality of your parks and green spaces using the Green Flag Award criteria. Civic Trust, Liverpool, UK.
Conway H(1991)People’s Parks: the design and development of Victorian parks in Britain. Cambridge University Press, Cambridge, UK.
Cowan R, Adams S and Chapman D(2010)Qualityreviewer: appraising the design quality of development proposals. Thomas Telford, London, UK.
Dempsey N(2009) Are good-quality environments socially cohesive? Measuring quality and cohesion in urban neighbourhoods.Town Planning Review80(3): 315–345. Dempsey N and Burton M(2012) Defining place-keeping: The
long-term management of public spaces.Urban Forestry and Urban Greening11(1): 11–20.
DCLG (Department for Communities and Local Government) (2002)Planning Policy Guidance 17: planning for open space, sport and recreation. DCLG, London, UK. DCLG(2006)Strong and Prosperous Communities: the local
government white paper.Vol. 1 & 2. Stationery Office, London, UK.
DCLG(2007)How to create quality parks and open spaces. DCLG, London, UK.
Experiential Landscape(2010) Projects, Experiential Landscape, University of Sheffield, Sheffield, UK. See www.elprdu. com/projects.html (accessed 15/03/2011).
Faehnle M, Ba¨cklund P and Tyrva¨inen L(2011) Looking for the role of nature experiences in planning and decision making: a perspective from the Helsinki metropolitan area. Sustainability: Science, Practice, and Policy7(1): 45–55. Grahn P and Stigsdotter UK(2010) The relation between
perceived sensory dimensions of urban green space and stress restoration.Landscape and Urban Planning94(3–4): 264–275.
Greenhalgh L and Parsons A(2004)Raising the Standard: the Green Flag Award Guidance Manual. CABE, London, UK. GreenSpace(2006)GreenSTAT questionnaire. GreenSpace,
Reading, UK. See www.greenstat.org.uk (accessed 02/04/ 2012).
GreenSpace(2010)Applying GreenSTAT. GreenSpace, Reading, UK. See www.green-space.org.uk/greenstat/ (accessed 02/04/2012).
Gustavsson R and Ingelo¨g T(1994)Det nya landskapet: Kunskaper och ide´er om naturva˚rd, skogsodling och planering i kulturbyg. Skogsstyrelsen, Jo¨nko¨ping, Sweden. Herzog TR(1992) A cognitive analysis of preference for urban
spaces.Journal of Environmental Psychology12(3): 237–248. Home R, Bauer N and Hunziker M(2010) Cultural and biological
determinants in the evaluation of urban green spaces. Environment and Behavior42(4): 494–523.
Keep Britain Tidy(2010)The state of England’s local
environment: A survey by Keep Britain Tidy 2009/10. Keep Britain Tidy, Wigan, UK.
Lindholst AC(2010) Rough Guide to Rec-mapping and Planning. EU NSR Interregional IVB project MP4. University of Copenhagen, Copenhagen, Denmark. Available on request at www.mp4-interreg.eu (accessed 17/ 03/2012).
Lindholst AC, Nuppenau C and Hune BS(2010) Anvendelse af oplevelsesværdier i planlægningen.Teknik & Miljø2010(7/ 8): 32–36.
MP4 Project(2010)Projects on the Ground: Sheaf Valley Park, South Yorkshire Forest Partnership. Sheffield, UK. Available on request at www.mp4-interreg.eu (accessed 17/03/2012) Newton J(2007)Wellbeing and the Natural Environment: A
brief overview of the evidence. Department for Environment, Food and Rural Affairs, London, UK. Nordh H(2010)Park characteristics: A tool for classifying and
designing urban green spaces. VDM Verlag, Saarbru¨cken, Germany.
Olafsson AS(2012)GIS-based Recreation Experience Mapping: Development, Validation and Implementation. PhD thesis, University of Copenhagen, Frederiksberg, Denmark. Purcell AT, Lamb RJ, Mainardi-Peron E and Falchero S(1994)
Preference or preferences for landscape?Journal of Environmental Psychology14(3): 195–209.
Randrup TB, Schipperijn J, Hansen BI, Jensen FS and Stigsdotter UK(2008)Natur og sundhed. Park og Landskabsserien No 40, Skov og Landskab, Hørsholm, Denmark.
Regionplane-och trafikkontoret(2001)Upplevelseva¨rden: Sociala kvaliteter i den regionala gro¨nstrukturen. Regionplane-och trafikkontoret, Stockholm, Sweden. Regionplane-och trafikkontoret(2004)Ja¨rvakilen:
Upplevelseva¨rden i Stockholmsregionens gro¨ne kilar. Regionplane-och trafikkontoret, Stockholm, Sweden. Schipperijn J(2010)Use of urban green space.PhD thesis.
Forest and Landscape, University of Copenhagen, Frederiksberg, Denmark.
SCC (Sheffield City Council)(2009)Firth Heritage Park, Sheffield: Green Flag Management Plan 2008–2012. SCC, Sheffield, UK.
SCC(2012)South Street Open Space. SCC, Sheffield, UK. See www.sheffield.gov.uk/planning-and-city-development/
regeneration/neighbourhood-regeneration/your-neighbourhood/park-hill/south-street-open-space (accessed 02/04/2012).
Sta˚hle A(2006) Sociotope mapping – exploring public open space and its multiple use values in urban and landscape planning practice.Nordic Journal of Architectural Research 19(4): 59–71.
Tyrva¨inen L, Ma¨kinen K and Schipperijn J(2007) Tools for mapping social values of urban woodlands and other green areas.Landscape and Urban Planning79(1): 5–17. van den Berg AE and van Winsum-Westra M(2010) Manicured,
romantic, or wild? The relation between need for structure and preferences for garden styles.Urban Forestry and Urban Greening9(3): 179–186.
van den Berg AE, Vlek CAJ and Coeterier JF(1998) Group differences in the aesthetic evaluation of nature development plans: a multilevel approach.Journal of Environmental Psychology18(2): 141–157.
Vestegnssamarbejdet(2011)Oplevelsevaerdier: Kortlaegning og Afrapportering af Oplevelsesvaerdier pa˙ Vestegnen. Vestegnssamarbejdet, Ishøj, Denmark.
WHAT DO YOU THINK?
To discuss this paper, please email up to 500 words to the editor at [email protected]. Your contribution will be forwarded to the author(s) for a reply and, if considered appropriate by the editorial panel, will be published as discussion in a future issue of the journal.