Business Data for Engaging in
International Real Estate Transactions
in Arizona
November 2011
NATIONAL ASSOCIATION OF
REALTORS
®Executive Summary
This report presents state specific information relevant to residential and commercial real estate. The market descriptions and analyses present some of the types of information that an international purchaser might find of interest:
The content of NAR’s Local Market Reports is discussed in detail. These reports present information on specific state real estate markets. Realtors® have access to the reports as part of their membership. The reports can also be made available by arrangement through NAR Research.
We also present state specific data in terms of prices, sales, demographics, income, immigration status, state exports, the state economy, and commercial real estate where appropriate. A wide variety of economic factors affect the real estate markets at various times, and we have attempted to present the data most relevant to the description of current and future market drivers and conditions.
Finally, readers are encouraged to review the information on NAR’s Global Business & Alliances Division, which has the expertise to address specific questions related to international transactions as well as the ability to direct specific questions to other NAR resources.
Overall this report is only a starting point illustrating some of the state-specific information available. It can serve as an initial basis for developing questions, identifying areas of interest, and initiating the real estate process. The amount of data available from both NAR and
governmental sources is voluminous. Depending on user information needs NAR can identify data sources and contacts and suggest appropriate contexts for understanding real estate market information.
Introduction—Overview of International Transactions
Today, we are living a global marketplace. International transactions—imports, exports, and capital flows—are substantial and growing. Along with the expansion of international trade and the internationalization of capital markets, the flow of people across borders has increased. The demand for real estate in both the residential and commercial sectors has grown, both in terms second homes as well as in terms of investment properties. The purpose of this report is to present recent economic data related to international business activity directly associated with Arizona, particularly as related to providing information to non-U.S. residents in terms of residential and commercial real estate.
The growth of the international economy provides many opportunities for rental housing, first and/or second homes, and commercial properties. A recent study, The 2011 National Association of REALTORS® Profile of International Home Buying Activity,1shows that
approximately 2.8 percent of national existing home sales involved non-resident foreign buyers. In addition, another 2.8 percent of sales were purchased by recent immigrants and foreign expats residing in the U.S. for business purposes. In the commercial area—e.g., office buildings, retail space, industrial buildings, multi-family residences, and hotel properties—property ownership is essentially a worldwide market, with investors from a variety of countries owning properties in the United States. The level of actual participation in international transactions will vary from state to state, depending on geographic, business, and demographic patterns.
International residential transactions in the United States occur for a variety of reasons: foreign expats with international corporations needing housing while working outside of their
1 NAR conducted a survey of REALTORS® in 2011 to better understand the extent of non-U.S. resident and 0 50,000 100,000 150,000 200,000 250,000 2001 2002 2003 2004 2005 2006 2007 2008 2009 2010 2011
Monthly U.S. Imports and Exports of Goods and Services
Import Export
home countries, foreign residents seeking second/vacation homes (e.g., Canadians vacationing in the winter in Florida), and foreign-born nationals seeking residences due to immigration. The homeownership rate of foreign-born households recently arrived in the U.S. tends initially not to be high. Due to language, cultural and institutional adjustments, homeownership among recent immigrants lags behind that of native-born Americans and the population as a whole. However, eventually, the homeownership rate of immigrants surpasses that of the national average, with over 80 percent of foreign-born U.S. residents owning a home – far higher than the national homeownership rate of 65.4 percent.
REALTORS® can seize the opportunity and help close the early-year homeownership gap through counseling and homebuyer education programs for their foreign-born clients. Many REALTORS® have already realized the potential business opportunities. Over the last five years, almost half of NAR members indicated that they have participated in a transaction involving an international element, and this trend will inevitably increase.
0% 10% 20% 30% 40% 50% 60% 70% 80% 90% 5 Years or Less 6 to 10 Years 11 to 15 Years 16 to 20 Years 21 to 25 Years 26 to 30 Years 31 to 35 Years 36 to 40 Years More than 40 Years
Homeownership of Immigrants by Length of Stay in U.S.
Arizona—Local Market Reports Summarize State Conditions
NAR issues Local Market Reports (LMRs) for a number of state Metropolitan Statistical Areas (MSA’s). The reports are available at
http://www.realtor.org/research_secured/subscription_data/localmarketreports .
The reports are formatted into 3 sections: summary activity (prices and sales), local fundamentals (economic and housing demand), and a final section that describes unique statistics that are shaping the current market.
Local markets are compared with the U.S. average when appropriate as well as analyzed for changes over time. The median price change data is shown both as a level or dollar amount and as a rate of change over various time periods. Comparing on a year-over-year basis
eliminates seasonal fluctuations. As housing is a long-term asset, it is important to show the long-term benefits to owning housing. Hence, we have included the equity gains from housing over the long-term.
The average home tenure is 7 years, so we have coupled comparison values around this period. Some households may in fact hold their home longer, boosting their equity gain. The equity gain in this report is the change in the median home price. Like the prices, home sales and construction are compared to the same period one year earlier to account for seasonal fluctuations.
The section on market fundamentals gives context to local market conditions. New employment is a factor that creates demand for housing. Potential home buyers need a steady income stream and equity to make a purchase, so this correlation is strong. However, the newly employed need time to develop the confidence and equity to make a purchase, and employment can experience broad short-term swings, so we include a 3-year view. The economic activity index, published by the Federal Reserve Bank of Philadelphia, incorporates a number of state economic indicators, such as employment and gross state product into one index, which is used as a measure of the health of a state’s economy. Again, comparing the short-term with the long-term changes gives perspective on whether short-long-term changes are dramatic or small relative to recent trends.
The section on fundamentals also includes tables and graphs on local affordability conditions. Falling mortgage rates improved affordability during the housing boom, but moderating or declining prices are driving changes in affordability today. Consequently, we focus on the long-term and short-term changes in the monthly service cost of a mortgage (monthly payment) using the current 30-year fixed rate and the median price over a 30-year period. This calculation does not include taxes, insurance, or other expense. A measure below the historical average can suggest that a local market is in an affordable situation. In short, neither prices nor mortgage rates provide adequate justification for coloring a market as affordable or not. A buyer will run the numbers specific to his or her situation before buying. Also included are data on the monthly mortgage servicing cost both for the long-term as well as for the most recent 6 quarters. The latter pattern shows recent dynamics whereas the former puts the recent
measure does not factor in the financing options available to buyers, which makes it a second-best measure of affordability.
The final section of the report focuses on trends that are driving the current state of the housing market. Risky lending between 2005 and 2007 has caused a wave of foreclosures. However, the erratic and often shocking foreclosure figures can be deceptive. This section highlights where foreclosures are rising the most and how they fit into the local context as a whole and in a historical context.
Every attempt is made to include the best data possible. If one data source was not available for a particular metro area, a second-best solution was substituted. For instance, the Bureau of Labor Statistics does not provide employment figures for all metro areas from its
Establishment Survey. Where this data is not available, we have substituted figures from the Bureau of Labor Statistics’ Household Survey. Not all data series are complete. We attempt to complete as many calculations as possible, but when data is missing (e.g. median home price) some calculations cannot be made. Here are the data sources used:
Housing Price and Sales Statistics – The National Association of Realtors
Labor statistics – U.S. Bureau of Labor Statistics (Establishment Surveys and Household)
Housing Permits Data – U.S. Census Bureau
Foreclosure Data – Mortgage Bankers’ Association of America
State Economic Index - Federal Reserve Board of Philadelphia
Graphs, Tables, and information on NAR’s Global Programs
The following graphs in this report compare economic activity, housing sales, and housing prices in the state and the U.S. Information on NAR’s Global Programs is presented, and a variety of state specific data are presented, followed by graphs for selected metropolitan areas. Finally, some information on the commercial sector is presented, depending on
0 50 100 150 200 250 2000 2001 2002 2003 2004 2005 2006 2007 2008 2009 2010 2011
Philadelphia Federal Reserve Coincident Economic Activity
Index
Arizona US (100: July, 1992) 0 1,000 2,000 3,000 4,000 5,000 6,000 7,000 8,000 0 50 100 150 200250
State and National Existing Home Sales Volume
ARIZONA U.S. (Unit: 1,000) 0 50,000 100,000 150,000 200,000 250,000 300,000
State and National Median Existing Home Sales Price
ARIZONA U.S.
Information on NAR’s Global Programs
NAR’s Global Business & Alliances division helps members prepare to serve the growing market of global buyers. Offering the Certified International Property Specialist
designation, the At Home With Diversity certification and the Resort and Second Home Property Specialist certification, we show REALTORS® how to diversify their business, and provide members with the research, tools and access to globalize their network. With nearly 80 bilateral agreements, affiliation with 60 countries, and strategic partnerships, NAR Global helps you explore the global market.
NAR’s international program has a long history, demonstrating the foresight of NAR leaders over a number of decades. Through carefully developing and nurturing international bilateral and multilateral relationships worldwide, NAR has laid a solid foundation for participation in today’s global marketplace.
NAR Global home page at Realtor.org – Best general resource for information on NAR international programs and services – http://www.realtor.org/global.
Certified International Real Estate Specialist (CIPS) designation program and business network – Provides introductory and advanced training for real estate professionals and
administrators, along with business development/networking tools, resources and events. Access course descriptions, schedule, benefits and other information on CIPS from the NAR Global home page, http://www.realtor.org/global.
NAR Global Association Network – NAR partners with nearly 80 associations in 60 countries—all of whose members subscribe to a code of conduct similar to the NAR Code of Ethics. Review the full list of foreign partners, NAR’s volunteer liaisons to these groups, and/or access the association directly at http://www.realtor.org/global/cooperating_associations. Global Perspectives in Real Estate - NAR Global's bi-monthly newsletter filled with valuable
information regarding global business development for REALTORS®. View the electronic version at http://www.realtor.org/global/globalperspectives.
International Research Reports - Learn about the global impact in your market. Access NAR's International Real Estate Research Reports, including all 50 State-by-State International Business Reports, at http://www.realtor.org/research/research/reportsintl.
Broker Assessment Tool – Brokers can complete this short survey and receive a customized report on how to find the global opportunities in your market and take your business - and your earning potential - to the global level. Get started at www.realtor.org/brokersolutions.
Demographic and Economic Statistics
Data Overview
A variety of tables and graphs present information relevant to the Arizona real estate picture:
Table 1: Population Demographics by Birth Place as of 2010
Entry Year All U.S. Born
Citizen
Foreign Born
Naturalized
Citizen Non Citizen
Arizona Before 1980 204,635 30,418 128,995 45,222 1980-1989 177,710 13,061 82,282 82,367 1990-1999 259,793 13,970 73,825 171,998 2000 or later 290,323 18,349 25,733 246,241 Total 932,461 75,798 310,835 545,828 U.S. Before 1980 9,546,536 1,722,087 6,245,642 1,578,807 1980-1989 8,102,180 688,733 4,676,062 2,737,385 1990-1999 11,654,539 799,661 4,653,196 6,201,682 2000 or later 14,880,388 1,017,308 1,901,182 11,961,898 Total 44,183,643 4,227,789 17,476,082 22,479,772
Source: American Community Survey 2010
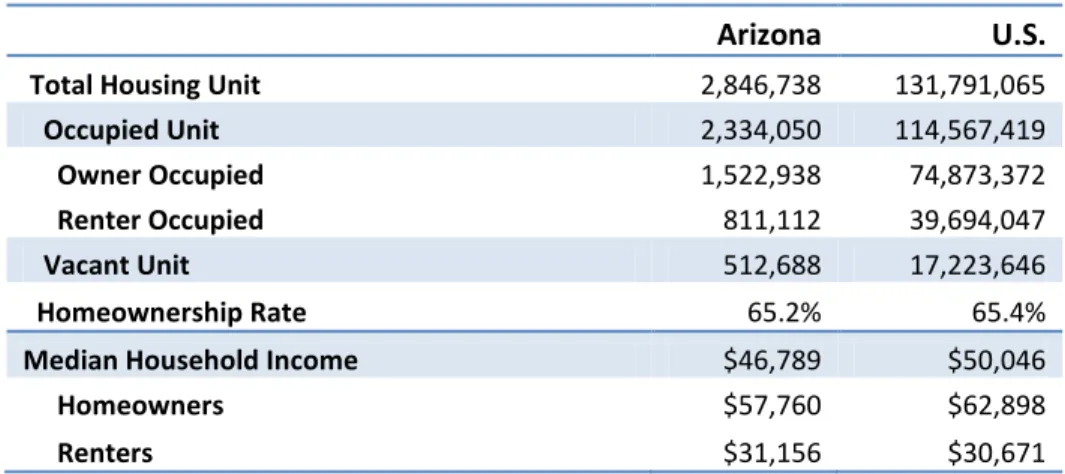
Table 2: Tenure Status and Median Income as of 2010
Arizona U.S.
Total Housing Unit 2,846,738 131,791,065
Occupied Unit 2,334,050 114,567,419
Owner Occupied 1,522,938 74,873,372
Renter Occupied 811,112 39,694,047
Vacant Unit 512,688 17,223,646
Homeownership Rate 65.2% 65.4%
Median Household Income $46,789 $50,046
Homeowners $57,760 $62,898
Renters $31,156 $30,671
Demographic and Economic Statistics
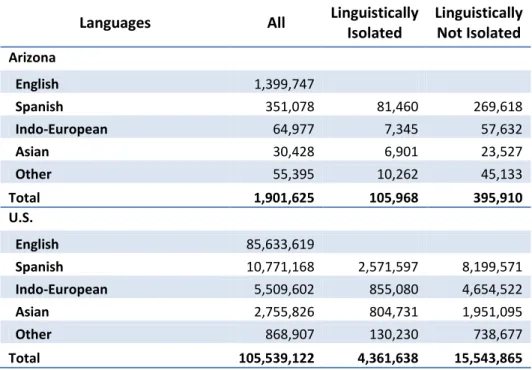
Table 3: Major Language Spoken at Home
Languages All Linguistically
Isolated Linguistically Not Isolated Arizona English 1,399,747 Spanish 351,078 81,460 269,618 Indo-European 64,977 7,345 57,632 Asian 30,428 6,901 23,527 Other 55,395 10,262 45,133 Total 1,901,625 105,968 395,910 U.S. English 85,633,619 Spanish 10,771,168 2,571,597 8,199,571 Indo-European 5,509,602 855,080 4,654,522 Asian 2,755,826 804,731 1,951,095 Other 868,907 130,230 738,677 Total 105,539,122 4,361,638 15,543,865
Source: American Community Survey 2010
Table 4: Migration Statistics as of 2010
Arizona U.S.
(%) (%)
Non Movers 5,072,829 80.1% 258,582,774 84.4%
Movers 1,259,957 19.9% 47,045,833 15.6%
Moved From Same County 880,157 13.9% 28,879,282 9.2%
Moved From Same State 120,256 1.9% 9,769,629 3.3%
Moved From Different State 221,581 3.5% 6,718,586 2.4%
Moved From Abroad 37,963 0.6% 1,678,336 0.6%
Mortgage Statistics
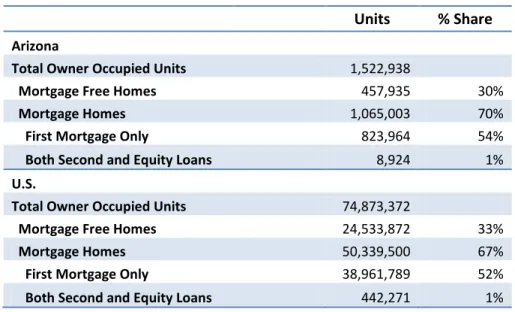
Table 5: Mortgage Status in 2010
Units % Share
Arizona
Total Owner Occupied Units 1,522,938
Mortgage Free Homes 457,935 30%
Mortgage Homes 1,065,003 70%
First Mortgage Only 823,964 54%
Both Second and Equity Loans 8,924 1%
U.S.
Total Owner Occupied Units 74,873,372
Mortgage Free Homes 24,533,872 33%
Mortgage Homes 50,339,500 67%
First Mortgage Only 38,961,789 52%
Both Second and Equity Loans 442,271 1% Source: American Community Survey 2010
Table 6: Mortgage Origination in 2010
Purchase Loans Refinancing Loans
# of Loans Median Amount # of Loans Median Amount Arizona Total Loans 74,817 134,000 83,258 171,800 Conventional 34,704 135,000 67,944 169,200 FHA 32,093 129,400 10,994 177,400 VA 5,895 166,100 4,304 186,600 RHS 2,125 118,900 16 170,000 U.S. Total Loans 2,516,146 159,800 4,937,482 176,200 Conventional 1,360,724 168,700 4,285,035 176,600 FHA 896,937 151,600 512,216 171,600 VA 175,957 189,700 137,591 184,700 RHS 82,528 122,700 2640 136,900
Mortgage Statistics
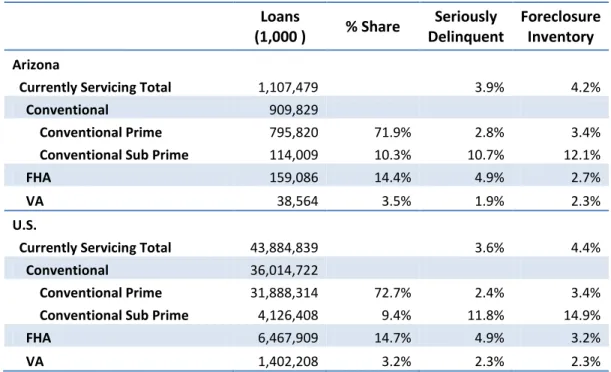
Table 7: Existing Mortgage Status as of 2011 2nd Quarter
Loans (1,000 ) % Share Seriously Delinquent Foreclosure Inventory Arizona
Currently Servicing Total 1,107,479 3.9% 4.2%
Conventional 909,829
Conventional Prime 795,820 71.9% 2.8% 3.4%
Conventional Sub Prime 114,009 10.3% 10.7% 12.1%
FHA 159,086 14.4% 4.9% 2.7%
VA 38,564 3.5% 1.9% 2.3%
U.S.
Currently Servicing Total 43,884,839 3.6% 4.4%
Conventional 36,014,722
Conventional Prime 31,888,314 72.7% 2.4% 3.4%
Conventional Sub Prime 4,126,408 9.4% 11.8% 14.9%
FHA 6,467,909 14.7% 4.9% 3.2%
VA 1,402,208 3.2% 2.3% 2.3%
Immigration Statistics
Table/Chart 8: Admitted Immigrants
Arizona U.S. 2001 16,197 841,002 2002 17,588 1,058,902 2003 10,955 1,059,356 2004 19,507 703,542 2005 18,986 957,883 2006 21,529 1,122,257 2007 17,528 1,266,129 2008 20,638 1,052,415 2009 20,997 1,107,126 2010 18,243 1,130,818
Table/Chart 9: Naturalized Citizens
Arizona U.S. 2001 8,239 886,026 2002 6,064 606,259 2003 7,218 572,646 2004 6,500 462,435 2005 6,785 537,151 2006 9,707 604,280 2007 12,091 702,589 2008 24,055 660,477 2009 12,377 1,046,539 2010 10,340 743,715
Source: Department of Homeland Security, Immigration Statistics 2011
0 200 400 600 800 1,000 1,200 1,400 0 5,000 10,000 15,000 20,000 25,000
Admitted Immigrants
Arizona U.S. (Unit: 1,000) 0 200 400 600 800 1,000 1,200 0 5,000 10,000 15,000 20,000 25,000 30,000Naturalized Citizens
Arizona U.S. (Unit: 1,000)Immigration Statistics
Table/Chart 10: Immigration by Origination Regions and Countries in 2010
Total 18,243 Asia 6,189 North America 8,858 Europe 1,188 South America 504 Oceania 87 Mexico 7,690 Iraq 1,221 India 805 Philippines 779 China (PRC) 542 Vietnam 448 Canada 382 Bhutan 346 Burma 341 Cuba 282 Thailand 248 United Kingdom 235 Korea 213 Iran 207 Ethiopia 178 Somalia 149 Nepal 141 Guatemala 138 Colombia 137 Germany 137 Romania 117 Kenya 112 Peru 106 Liberia 105 Nigeria 103 Sudan 95 Brazil 92 Pakistan 88 El Salvador 87 Afghanistan 83 Ukraine 81 Jordan 76 Bangladesh 75 Japan 68
Source: Department of Homeland Security, Immigration Statistics 2011
Source: Department of Homeland Security, Immigration Statistics 2011 Asia 33.9% North America 48.6% Africa 7.7% Europe 6.5% South America 2.8% Oceania 0.5% Unknown 0.1%
Immigration by Origination Regions
0 2,000 4,000 6,000 8,000 10,000 12,000 China (PRC)
Philippines India Iraq Mexico
Recent Immigration Trend from Major Countries
Immigration Statistics
Table/Chart 11: Naturalization by Origination Regions and Countries in 2010
Total 10,340 Asia 3,202 North America 4,500 Europe 1,259 South America 381 Oceania 52 Mexico 3,768 India 727 Philippines 601 Vietnam 379 China (PRC) 315 Canada 310 United Kingdom 187 Iran 164 Romania 162 Iraq 152 Bosnia-Herzegovina 150 Sudan 140 Somalia 134 Germany 104 Colombia 103 Nigeria 94 Guatemala 93 Poland 91 Ethiopia 90 Korea, South 89 El Salvador 87 Pakistan 81 Liberia 80 Peru 78 Russia 74 South Africa 73 Bangladesh 67 Taiwan 58 Brazil 56 Cuba 56 Thailand 55 Afghanistan 54 Serbia and Montenegro1 54 Egypt 52
Source: Department of Homeland Security, Immigration Statistics 2011
Source: Department of Homeland Security, Immigration Statistics 2011 Asia 31.0% North America 43.5% Africa 9.1% Europe 12.2% South America 3.7% Oceania 0.5% Unknown 0.0%
Naturalization by Origination Regions
0 2,000 4,000 6,000 8,000 10,000 12,000 14,000 16,000 China (PRC)
Vietnam Philippines India Mexico
Recent Naturalization Trend from Major Countries
Immigration Statistics
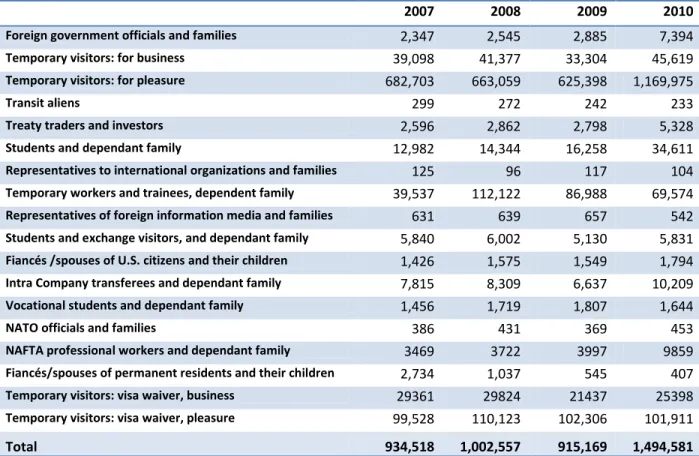
Table 12: Nonimmigrant Visitors to Arizona
2007 2008 2009 2010
Foreign government officials and families 2,347 2,545 2,885 7,394
Temporary visitors: for business 39,098 41,377 33,304 45,619
Temporary visitors: for pleasure 682,703 663,059 625,398 1,169,975
Transit aliens 299 272 242 233
Treaty traders and investors 2,596 2,862 2,798 5,328
Students and dependant family 12,982 14,344 16,258 34,611
Representatives to international organizations and families 125 96 117 104
Temporary workers and trainees, dependent family 39,537 112,122 86,988 69,574
Representatives of foreign information media and families 631 639 657 542
Students and exchange visitors, and dependant family 5,840 6,002 5,130 5,831
Fiancés /spouses of U.S. citizens and their children 1,426 1,575 1,549 1,794
Intra Company transferees and dependant family 7,815 8,309 6,637 10,209
Vocational students and dependant family 1,456 1,719 1,807 1,644
NATO officials and families 386 431 369 453
NAFTA professional workers and dependant family 3469 3722 3997 9859
Fiancés/spouses of permanent residents and their children 2,734 1,037 545 407
Temporary visitors: visa waiver, business 29361 29824 21437 25398
Temporary visitors: visa waiver, pleasure 99,528 110,123 102,306 101,911
Total 934,518 1,002,557 915,169 1,494,581
International Economic Activities
Table 13: Employment by Foreign Direct Investment Firms
2005 2006 2007 2008 2009
Arizona
Total Private Sector Employees 2,107,800 2,228,500 2,255,700 2,187,200 2,005,600
Direct Investment Firms
All industries 68,500 72,500 73,200 76,500 73,100
FDI Firm share (%) 3% 3% 3% 3% 4%
Manufacturing 19,500 20,200 19,300 20,000 18,400
Wholesale trade 6,000 5,900 5,900 6,200 6,800
Retail trade 9,200 9,500 8,500 9,100 9,800
Information 2,200 4,000 3,400 3,400 2,700
Finance and insurance * 1,700 1,800 3,100 3,900 3,000
Real estate, rental, leasing 1,100 700 700 800 1,000
Professional, scientific, tech services 2,200 1,900 5,600 5,700 5,700
Other industries 26,700 28,600 26,700 27,400 25,700
U.S. (Unit: 1,000)
Total Private Sector Employees 112,494 114,575 115,866 114,967 107,971
Direct Investment Firms
All industries 5,588 5,334 5,202 5,132 5,280
FDI Firm share (%) 5% 5% 4% 4% 5%
Manufacturing 2,051 2,064 2,001 2,004 1,964
Wholesale trade 662 615 579 561 560
Retail trade 530 564 573 613 469
Information 234 226 212 222 252
Finance and insurance * 382 215 199 195 384
Real estate, rental, leasing 38 44 47 48 38
Professional, scientific, tech services 239 202 198 183 245
Other industries 1,453 1,405 1,393 1,307 1,367
* Excludes depository institutions. Source: Bureau of Economic Analysis
International Economic Activities
Table 14: Arizona State Exports by Product
(Unit: $ 1 Million)
2006 2007 2008 2009 2010
Total 18,299 19,228 19,784 14,023 15,652
Share among U.S. Export (%) 1.9% 1.8% 1.6% 1.4% 1.3%
COMPUTER AND ELECTRONIC PRODUCTS 7,548 7,418 6,886 4,338 5,165
TRANSPORTATION EQUIPMENT 2,977 3,355 3,298 2,523 2,391
MACHINERY, EXCEPT ELECTRICAL 1,222 1,307 1,384 1,339 1,639
AGRICULTURAL PRODUCTS 511 679 697 685 893
ELECTRICAL EQUIPMENT, APPLIANCES & COMPONENTS 1,434 1,666 1,579 752 847
FABRICATED METAL PRODUCTS, NESOI 689 645 836 950 723
CHEMICALS 458 467 589 506 669
PLASTICS & RUBBER PRODUCTS 463 449 468 410 469
PRIMARY METAL MFG 469 609 645 333 445
MISCELLANEOUS MANUFACTURED COMMODITIES 477 348 412 427 440
MINERALS & ORES 837 743 1,295 394 433
FOOD MANUFACTURES 245 330 441 298 371
PAPER 243 244 198 207 232
WASTE AND SCRAP 187 406 372 149 198
SPECIAL CLASSIFICATION PROVISIONS, NESOI 202 187 180 142 152
OIL & GAS 0 1 57 168 136
TEXTILES & FABRICS 97 92 79 75 81
PETROLEUM & COAL PRODUCTS 8 23 67 61 75
USED OR SECOND-HAND MERCHANDISE 40 46 72 51 69
FURNITURE & FIXTURES 32 27 34 39 45
NONMETALLIC MINERAL PRODUCTS 33 31 42 33 45
PRINTED MATTER AND RELATED PRODUCTS, NESOI 42 63 52 40 36
WOOD PRODUCTS 24 27 39 29 35
TEXTILE MILLS PRODUCTS 23 18 14 17 21
APPAREL MANUFACTURING PRODUCTS 11 11 10 13 12
International Economic Activities
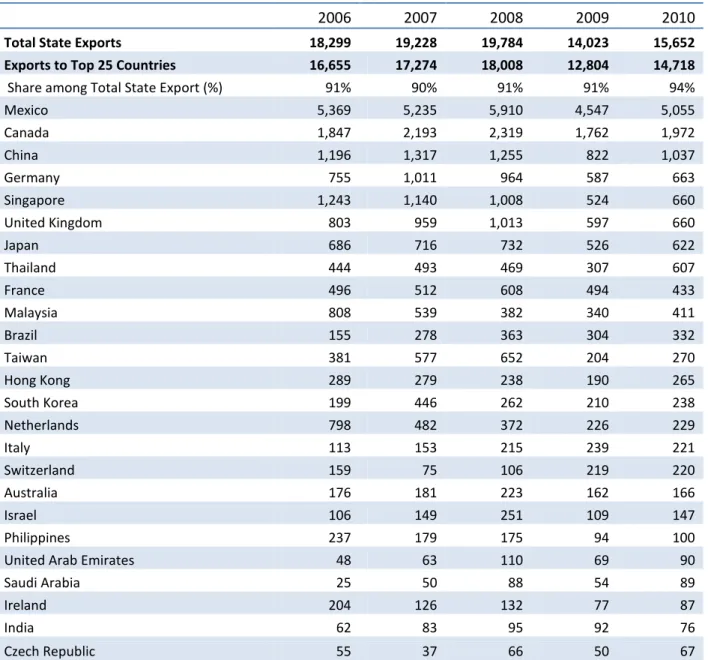
Table 15: Arizona State Exports by Partner
(Unit: $ 1 Million)
2006 2007 2008 2009 2010
Total State Exports 18,299 19,228 19,784 14,023 15,652
Exports to Top 25 Countries 16,655 17,274 18,008 12,804 14,718
Share among Total State Export (%) 91% 90% 91% 91% 94%
Mexico 5,369 5,235 5,910 4,547 5,055 Canada 1,847 2,193 2,319 1,762 1,972 China 1,196 1,317 1,255 822 1,037 Germany 755 1,011 964 587 663 Singapore 1,243 1,140 1,008 524 660 United Kingdom 803 959 1,013 597 660 Japan 686 716 732 526 622 Thailand 444 493 469 307 607 France 496 512 608 494 433 Malaysia 808 539 382 340 411 Brazil 155 278 363 304 332 Taiwan 381 577 652 204 270 Hong Kong 289 279 238 190 265 South Korea 199 446 262 210 238 Netherlands 798 482 372 226 229 Italy 113 153 215 239 221 Switzerland 159 75 106 219 220 Australia 176 181 223 162 166 Israel 106 149 251 109 147 Philippines 237 179 175 94 100
United Arab Emirates 48 63 110 69 90
Saudi Arabia 25 50 88 54 89
Ireland 204 126 132 77 87
India 62 83 95 92 76
Czech Republic 55 37 66 50 67
Local Economic and Housing Market Trends
Table/Chart 16 A : Housing and Economic Trends for Phoenix-Mesa-Scottsdale, AZ
0 50,000 100,000 150,000 200,000 250,000 300,000
Median Home Price
Phoenix-Mesa-Scottsdale, AZ US 0.0 1.0 2.0 3.0 4.0 5.0 6.0
Median Price to Median Income
Phoenix-Mesa-Scottsdale, AZ US Source: NAR 2011 0 20 40 60 80 100 120 140 160 0 500 1,000 1,500 2,000 2,500
Non-Farm Employees
Phoenix-Mesa-Scottsdale, AZ US (Unit: 1 Million) (Unit: 1 Thousand) 100 200 300 400 500 0 2 4 6 8 10 12 14 16 18Single Family Home Permits
Phoenix-Mesa-Scottsdale, AZ US
Local Economic and Housing Market Trends
Table/Chart 16 B : Housing and Economic Trends for Tucson, AZ
0 50,000 100,000 150,000 200,000 250,000 300,000
Median Home Price
Tucson, AZ US Source: NAR 2011 0.0 1.0 2.0 3.0 4.0 5.0 6.0 7.0
Median Price to Median Income
Tucson, AZ US Source: NAR 2011 0 20 40 60 80 100 120 140 160 0 50 100 150 200 250 300 350 400 450
Non-Farm Employees
Tucson, AZ US (Unit: 1 Million) (Unit: 1 Thousand) 100 200 300 400 500 0 1 1 2 2 3 3 4Single Family Home Permits
Tucson, AZ US
Local Commercial Market Trends
Table/Chart 17 A : Commercial Real Estate Fundamentals for Phoenix
0.0% 5.0% 10.0% 15.0% 20.0% 25.0% 30.0% -4000 -3000 -2000 -1000 0 1000 2000 3000 4000 Sq u ar e Fee t Office Fundamentals
Completions ('000 SF) Net Absorption ('000 SF) Vacancy Rate (%)
Source: REIS inc.
0.0% 2.0% 4.0% 6.0% 8.0% 10.0% 12.0% 14.0% 16.0% -3000 -2000 -1000 0 1000 2000 3000 4000 5000 Sq u ar e Fee t Industrial Fundamentals
Completions ('000 SF) Net Absorption ('000 SF) Vacancy Rate (%)
Source: REIS inc.
4.0% 6.0% 8.0% 10.0% 12.0% 14.0% -500 0 500 1000 1500 2000 2500 Sq u ar e Fee t Retail Fundamentals
Completions ('000 SF) Net Absorption ('000 SF) Vacancy Rate (%)
2.0% 4.0% 6.0% 8.0% 10.0% 12.0% 14.0% -2000 0 2000 4000 6000 8000 10000 Sq u ar e Fee t Multifamily Fundamentals
Local Commercial Market Trends
Table/Chart 17 B : Commercial Real Estate Fundamentals for Tucson
0.0% 5.0% 10.0% 15.0% 20.0% -100 -50 0 50 100 150 Sq u ar e Fee t Office Fundamentals
Completions ('000 SF) Net Absorption ('000 SF) Vacancy Rate (%)
Source: REIS inc.
0.0% 2.0% 4.0% 6.0% 8.0% 10.0% 12.0% -400 -300 -200 -100 0 100 200 300 400 Sq u ar e Fee t Retail Fundamentals
Completions ('000 SF) Net Absorption ('000 SF) Vacancy Rate (%)
Source: REIS inc.
0.0% 2.0% 4.0% 6.0% 8.0% 10.0% 12.0% -2000 -1500 -1000 -500 0 500 1000 1500 Sq u ar e Fee t
Completions (Units) Net Absorption (Units) Vacancy Rate (%)
Local Commercial Market Trends
Table/Chart 18 A: Commercial Real Estate Investment and Average Price in Phoenix
$2,000 $4,000 $6,000 $8,000 $10,000 $12,000 2007 2008 2009 2010 2011* M ill io n s
Commercial Real Estate Investment Volume
Retail Office Industrial Apartment
Source: Real Capital Analytics Source: Real Capital Analytics
0 20 40 60 80 100 120 0 50 100 150 200 250 300 Th o u san d s