1
The Role of Biofuels
Beyond 2020
Commissioned by BP
16/09/2013
Element Energy Limited 20 Station Road Cambridge CB1 2JD Tel: 01223 227764 Fax: 01223 356215
2
Executive summary
Background
The UK has a greenhouse gas emission reduction target of 80% by 2050, compared to 1990 levels. This translates into the need to strongly decarbonise all energy sectors: power generation, transport and heat. Decarbonisation of road transport, especially cars, is expected to be achieved in the long term with electric plug-in vehicles and hydrogen vehicles, coupled with a decarbonisation of the electricity and hydrogen production. However the car fleet is today dominated by vehicles using internal combustion engine (ICE) – i.e. liquid fuels – and will still be by 2030. In this context of reliance on liquid fuels, this study explores the potential role and cost effectiveness of using biofuels to decarbonise road transport.
The deployment of new powertrain technologies and the fleet energy consumption is modelled with a consumer choice model developed by Element Energy for the Energy Technologies Institute in 2010-11 and extended and updated for the Department for Transport (DfT) in 2012. The model combines cost performance data for a wide range of powertrains and fuels with consumer preference data from a survey of 2,700 UK new car buyers.
Biofuel pathways
The UK Bioenergy Strategy conducted in 2012 by the Department for Energy and Climate Change, the Department for Transport and the Department for Environment, Food and Rural Affairs estimated the contribution of bioenergy to the national energy needs1. The analysis identified the volume of sustainable bioenergy resources, defined as not leading to land use change and feedstock not coming from high carbon stock land.
For this study, several biofuel pathways were developed to represent a range of possible biofuels futures and to investigate how this identified sustainable bioenergy potential would translate in terms of emission savings and cost effectiveness:
• A LOW BIOFUELS case where biofuel blending stays low (E10 and B7) and relies on conventional biofuels
• A MEDIUM BIOFUELS case where E20 is introduced from 2020 and ethanol is increasingly made from cellulosic feedstock. The use of biofuels in this scenario falls well within the ‘Highly Restrictive Sustainability Standards’ scenario of the UK Bioenergy Strategy.
• A HIGH BIOFUELS case that represents a stretch case: high blending of butanol as well as use of drop-in fuels, to the limit of identified constraints of the ‘Medium Supply’ in the UK Bioenergy Strategy.
The pathways mainly rely on the improvement of biofuels for gasoline engines, as sustainable biofuels options are limited for diesel engines. The assumptions on emission savings achieved by biofuels are based on current values for delivered biofuels and converge towards the Renewable Energy Directive targets over time. The contribution of advanced biofuels – produced through advanced conversion processes of cellulosic feedstock – is limited to the projections developed by the International Energy Agency2.
1
DECC, DfT and Defra, 2012, UK Bioenergy Strategy. Available at
https://www.gov.uk/government/publications/uk-bioenergy-strategy
3
Findings
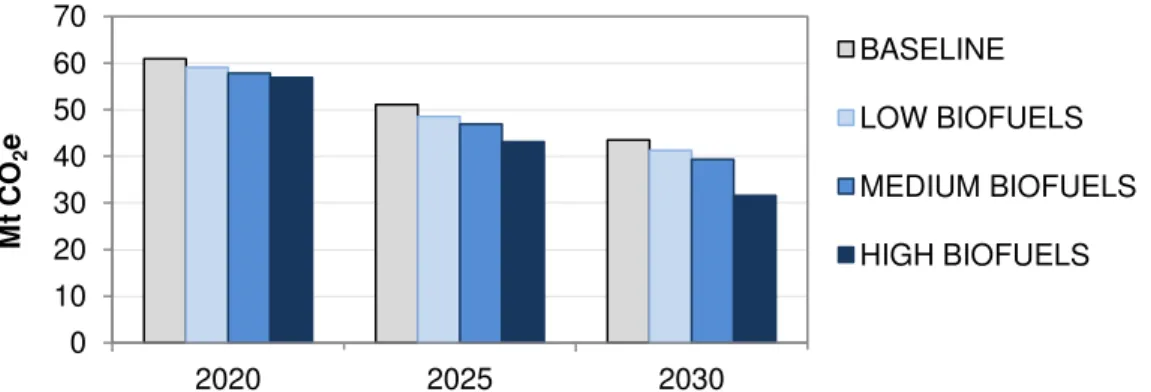
Modelling results show that, within supply constraints, biofuels provide strong decarbonisation potential due to high numbers of ICE-derived vehicles still in circulation by 2030. The MEDIUM BIOFUELS pathway achieves 9% (4Mt) lower emissions by 2030 compared to the baseline case (5% blends). In the extreme case of the HIGH BIOFUELS pathway, 12Mt (27%) of CO2 are saved in 2030 compared to the baseline.
Figure 1 Well to Wheel emissions from cars in Mt CO2e (tailpipe emissions plus fuel
and electricity production emissions)
Increasing high biofuel blends increases the cost of liquid fuels based on current cost projections. The cost premium does however stay modest, translating into a £13 increase in the yearly fuel spending of an average car. Overall, the MEDIUM and HIGH BIOFUELS are much more cost effective than the LOW BIOFUEL pathway, at around £80 versus £125 per tonne of CO2 avoided.
Blending biofuels is a more cost effective way of reducing emissions than using plug-in vehicles in the timeframe to 2030:
• At vehicle and consumer level, blending biofuels in fuels is a cheaper way to reduce emissions than using BEVs: biofuels translate into costs of £95/tCO2
versus £170/tCO2 for BEVs in 2030, based on DECC projections of energy costs
and grid carbon intensity.
• At UK level, achieving 4Mt emission savings in 2030 through the use of biofuels results in an additional cost to the UK of £336m. This is significantly cheaper than achieving comparable emission savings through a high uptake of plug-in vehicles that comes at an additional cost of over £1,200m.
An advantage of biofuels pathways is that they are complementary to hybrid and plug-in hybrid vehicles, which are expected to dominate low carbon powertrains during the 2020s and can make use of low carbon liquid fuels. This means that there is a low risk of technology lock-in to pursuing increased use of biofuels alongside continued efforts to electrify road transport. Furthermore, advanced biofuels address emissions of both new and existing vehicles, thus reducing emissions earlier than new powertrains and abating the risk of relying solely on longer term deployment of new technology.
This study shows the UK has the opportunity to significantly reduce the fleet emissions by 2030 and suggests a policy that maximises the availability of all low carbon options by 2020, including advanced biofuels, would allow maximum flexibility to meet future CO2
targets at lowest cost.
Capturing the benefits of biofuels will however require policy signals for the advanced biofuel supply chain to develop. Reaching an agreement over the current debate at EC level on the revision of the sustainability criteria and rules around the 10% target of 2020 is of particular importance. It would allow for policy makers and the industry to have the certainty required for the deployment of biofuels – and thus for the UK to capture the emission savings potential identified in this study.
0 20 40 60 2020 2025 2030 M t C O2 e BASELINE LOW BIOFUELS MEDIUM BIOFUELS HIGH BIOFUELS
4
Contents
1 Introduction ... 6
2 Methodology and biofuel pathways ... 7
2.1 Modelling the uptake of vehicle technologies ... 7
2.2 Biofuel pathways ... 7
2.2.1 Biofuels sustainability and supply constraints ... 8
2.2.2 Fuel WTW emission and blend level assumptions ... 9
2.2.3 Cost of biofuels ... 13
2.2.4 Impact of biofuels on consumer proposition ... 14
3 Results: emission savings and cost impact of biofuels ... 16
3.1 Emission savings ... 16
3.2 Cost impact and cost effectiveness ... 17
4 Comparison with other powertrains ... 18
4.1 Cost effectiveness of emission savings ... 18
4.2 Cost to the UK ... 20
5 The role of biofuels in the UK ... 22
6 Conclusions ... 24
7 Appendix ... 26
7.1 Model inputs and key assumptions ... 26
7.2 Biofuel pathways: engine compatibility assumptions and consumption outputs .. 27
7.2.1 Assumptions on ICEV compatibility with biofuel blends ... 27
7.2.2 Consumption outputs and sustainable biofuel supply limits ... 28
Authors
For comments or queries please contact:
[email protected] 0330 119 0984 [email protected] 01223 852495
Disclaimer
This study uses data derived from independent and publicly available sources and represents independent work performed by Element Energy. Modelling assumptions and other aspects of the analysis do not necessarily reflect the entirety of BP’s views.
5
Acronyms
BEV Battery Electric Vehicle BTL Biomass To Liquid
BuXX Gasoline blend containing XX%(vol) butanol BXX Diesel blend containing XX%(vol) biodiesel CCC Committee on Climate Change
CO2 Carbon Dioxide
DECC Department of Energy and Climate Change ECCo Electric Car Consumer model
EPC Engineering, Procurement and Construction ETI Energy Technologies Institute
EU European Union
EV Electric Vehicle
EXX Gasoline blend containing XX%(vol) ethanol FAME Fatty Acid Methyl Ester
FCEV Fuel Cell EV F-T Fischer Tropsch
HVO Hydro treated Vegetable Oil ICE Internal Combustion Engine IEA International Energy Agency
NREL National Renewable Research Laboratory
OECD Organisation for Economic Co-operation and Development OEM Original Equipment Manufacturer
PHEV Plug-in Hybrid EV
PiV Plug-in Vehicle (PHEV, RE-EV, BEV) RED Renewable Energy Directive
RE-EV Range Extended EV
RTFO Renewable Transport Fuel Obligation TCO Total Cost of Ownership
TTW Tank To Wheel UCO Used Cooking Oil
UK United Kingdom
VED Vehicle Excise Duty WTW Well To Wheel
6
1 Introduction
The UK has ambitious carbon dioxide (CO2) reduction targets3 and within the transport
sector, plug-in and other ultra low emission vehicles are expected to play a critical role in meeting long term CO2 goals: according to Department for Transport projections, almost
every new car and van will need to be zero-emission at the tailpipe by 2040 to meet the 2050 target4.
Ultra low emission vehicles (ULEV) currently face several barriers to adoption, including costs. Element Energy’s analysis for the LowCVP and analysis from the Energy Technology Institute suggest that they will continue to have higher ownership costs than petrol or diesel cars until 2030 and beyond5. Furthermore, plug-in hybrid and range-extended vehicles are expected to have broader appeal to the mass market than pure BEVs, which are likely to continue to have limited driving ranges6. Fuel cell vehicles are expected to offer more favourable economics in larger vehicles, if expected cost reductions are delivered. However, mass-market interest may be limited until infrastructure is widely available, which is not expected to occur until well within the 2020s7.
As a result, while internal combustion engine vehicles (ICEV) and derived powertrains such as hybrid vehicles (HEV) will deliver reduced emissions through improvement in fuel efficiency, the deployment of ULEVs is expected to be modest in the short term, with projections for market share of 2 to 10% by 2020 and ranging from 5% to 45% by 2030.8 The combination of this slow rollout of ULEVs and the fact that many of these will continue to have ICEs means that liquid fuels are likely to play a continued role in the transport sector in the medium term.
Advanced biofuels9, through their compatibility with ICEV and derived powertrains, could therefore be a cost effective route to decarbonising the whole vehicle parc and complement the growth of plug-in vehicles. This study investigates the potential benefits of including advanced biofuels in the post-2020 road transport mix, in the context of the benefits and limitations of the competing ultra-low carbon options. The time horizon considered is 2030 and the specific questions studied are:
• What are the potential emissions savings from a realistic penetration of biofuels considering supply constraints on sustainable biofuels?
• What cost does this add to the energy system? What is the cost effectiveness of
CO2 reduction of biofuel pathways?
• How do biofuels compare with a more aggressive rollout of plug-in vehicles10 in terms of costs of emissions savings?
3 80% reduction in greenhouse gas emission by 2050 compared to 1990 levels, Climate Change Act
2008. Transport accounts for 21% of UK GHG emissions, with cars responsible for 55% of that share
4 HM Government, The Carbon Plan: Delivering our low carbon future, December 2011
5 Influences on the low carbon car market 2020-2030, Element Energy for the LowCVP, 2010; An
affordable transition to sustainable and secure energy for light vehicles in the UK, Energy Technologies Institute, June 2013
6 An affordable transition to sustainable and secure energy for light vehicles in the UK, Energy
Technologies Institute, June 2013
7 UK H
2Mobility Phase 1 report, 2013 8
Powering ahead, the future of low-carbon cars and fuels, Ricardo-AEA for the RAC Foundation, April 2013
9
As defined in the UK Bioenergy Strategy: “Biofuels produced through application of advanced conversion processes to dedicated energy crops and the lignocellulosic parts of residues, or using novel feedstocks such as algae and bacteria”. In this study, advanced biofuels considered are ethanol/butanol made from cellulosic feedstock and drop-in fuels.
10
7
2 Methodology and biofuel pathways
2.1 Modelling the uptake of vehicle technologies
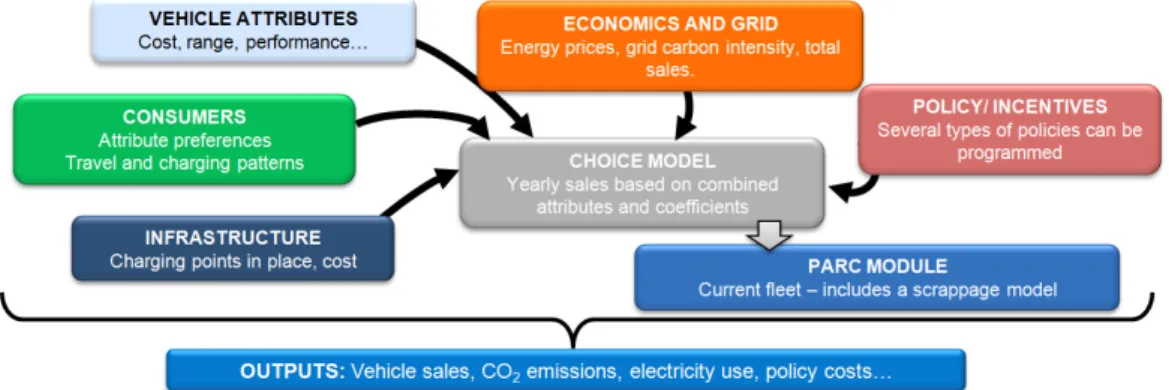
Understanding the deployment of new powertrain technologies requires understanding both the evolution of the costs and performance of the vehicles and the way customers respond to different vehicle attributes such as price and driving range. In this study we use ECCo2 (Electric Car Consumer Model), the latest version of a consumer choice model developed by Element Energy for the ETI in 2010-11 and extended and updated for the Department for Transport (DfT) in 2012. The model includes cost performance data for a wide range of powertrains and fuels and uses consumer preference data from a survey of 2,700 UK new car buyers.
ECCo2 allows for a comparative study of the future costs of deploying vehicle technologies, by providing a holistic approach to the cost of meeting CO2 targets across
the car parc, i.e. taking in consideration the cost of infrastructure roll-out as well as the consumer acceptance of the capital vs. running cost trade-off. In addition, non-financial attributes of different powertrains, such as limited range or sparse refuelling/recharging infrastructure are quantified as a perceived financial penalty; using stated preference data from a choice experiment in the survey mentioned above. Figure 2 provides an overview of the model inputs and outputs.
Figure 2 Overview of ECCo (Electric Car Consumer Model)
2.2 Biofuel pathways
For this study, the representation of biofuels in the model has been enhanced by using improved data on fuels performance and costs. Four new pathways were developed to represent a range of possible biofuels futures:
• A LOW BIOFUELS case where biofuel blending stays low (E10 and B7) and relies on conventional biofuels
• A MEDIUM BIOFUELS case where E20 is introduced from 2020 and ethanol is increasingly made from cellulosic feedstock.
• A HIGH BIOFUELS case that represents a stretch case: high blending of butanol as well as use of drop-in fuels11, to the limit of identified supply constraints. Butanol presents the advantage of being more energy dense than ethanol, as well as being compatible with gasoline engines at higher blends than ethanol.
11 Drop-in fuels can be blended with fossil fuels without altering the fuel specification; they can be
blended at high levels without requiring vehicle engine modification or pipe work protection. Butanol can be considered to be drop-in but is distinguished from other drop-in gasoline fuels in this report as not all engines currently on the road would be compatible with high butanol blends.
8 Underpinning the pathways is the consideration of sustainability of biofuels and the EU Renewable Energy Directive (RED) targets. Supply constraints are taken into account and are consistent with estimates of sustainable biofuel volumes from the Department of Energy and Climate Change and estimates of advanced biofuel availability from the International Energy Agency. These considerations are discussed below, before the assumptions used for the WTW emission savings and the cost of biofuels are presented.
2.2.1 Biofuels sustainability and supply constraints
Sustainable biofuel volumes available to the UK
A key prerequisite for biofuels to contribute to the UK GHG emission reduction is to deliver genuine emission reduction. In an effort to support only such fuels, the RED defines sustainability criteria, outside which fuels are not eligible for incentives member states might put in place and do not account towards the target of 10% renewable transport fuel by 2020. The UK has played a role in the improvement of biofuels policy by raising awareness to lifecycle biofuels emissions and Indirect Land Use Change (ILUC) issues through the Gallagher review12, as well as introducing a pioneering biofuels emission calculator and reporting mechanism.
In 2012, DECC, the Department for Transport (DfT) and the Department for Environment, Food and Rural Affairs (Defra) undertook an exhaustive review of the role of bioenergy in the UK energy strategy.13 Their analysis of biofuel feedstock supply is based on literature as well as the Committee on Climate Change Bioenergy review. Recognising the land use change impacts of bioenergy crops, the feedstock supply is limited to land that may became available through better farming practices and increased productivity of land that would not be used for food/feed production.
The DECC analysis concludes that sufficient sustainable resources can be available to provide up to 14% of UK’s primary energy demand in 2030. Sustainable in the Bioenergy Strategy is defined as “biomass feedstocks that have not been sourced from high carbon stock land (e.g. peat land or virgin forest) or land that is required for competing uses (e.g. food)”. It is thus assumed that the bioenergy production would not induce significant Indirect Land Use Change (ILUC).
For road transport, the Bioenergy Strategy analysis concludes that, in a medium supply scenario14, the sustainable bioenergy available for light duty vehicles is 90PJ in 2020 and 216 PJ in 203515. The HIGH BIOFUELS pathway modelled in this study has been designed to meet these identified sustainable volumes.
Recognising the uncertainty over land use, DECC also developed a ‘Highly Restrictive Sustainability Standards’ scenario under which risk of ILUC is further reduced, by restricting further the biomass supply. This scenario (90PJ in 2020 and 180 PJ in 2035) has been used as an upper cap for the MEDIUM BIOFUEL pathway.
12 The Gallagher Review of the indirect effects of biofuels production, Renewable Fuel Agency, 2008 13
DECC, DfT and Defra, 2012, UK Bioenergy Strategy. Available at
https://www.gov.uk/government/publications/uk-bioenergy-strategy
14
“Medium biomass prices with medium constraints to deployment of feedstocks and medium (business as usual) international development. UK has access to 10% of the global traded volumes that could be available up to 2020, reducing to 2% in 2050. Global planting rates of energy crops are delayed by 5 years compared to the AEA assumptions reflecting near term uncertainties on the global development of energy crops.”
15 Medium resource supply case, Figure 12 of UK Bioenergy Strategy. 2020 and 2035 numbers are
9
Advanced biofuels production capacity and availability for the UK
While the UK Bioenergy Strategy notes that advanced biofuels16 could play a role in reducing road emissions from the 2020s, the production capacity of such fuels available to the UK has not been estimated explicitly.
The IEA has studied the international supply of such biofuels and developed projections of production volumes, in its 2011 technology roadmap17. The projected global capacity production for cellulosic ethanol is 460PJ in 2020 and 1840PJ in 2030. In this study, these are converted into a supply limit for the UK of 9PJ and 37 PJ for cellulosic ethanol and butanol, based on the UK’s share of gasoline among OECD countries (ca. 2%).
It is important to note that the projected 2030 advanced biofuels volume represent a significant (30 fold) increase over currently announced capacity. The IEA roadmap defines policy milestones and stakeholders actions require to meet that challenge, including but not limited to: the implementation of sound sustainability criteria for biofuels, based on internationally agreed indicators; long-term targets and support policies that stimulate investments in sustainable biofuel production and ensure that advanced biofuels reach commercial production; increased and sustained RD&D funding to promote cost and efficiency gains for conventional and advanced biofuels; and development of systems to monitor and avoid (indirect) land-use change.
2.2.2 Fuel WTW emission and blend level assumptions
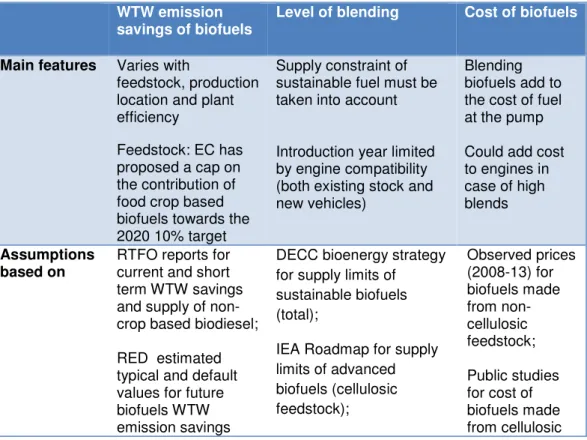
Table 1 gives a high level summary of considerations and assumptions used on the development of the biofuels pathways. Pathways are presented in more detail next.
Table 1 Summary of considerations and references used to build biofuel pathways
WTW emission savings of biofuels
Level of blending Cost of biofuels
Main features Varies with
feedstock, production location and plant efficiency
Feedstock: EC has proposed a cap on the contribution of food crop based biofuels towards the 2020 10% target
Supply constraint of sustainable fuel must be taken into account
Introduction year limited by engine compatibility (both existing stock and new vehicles)
Blending biofuels add to the cost of fuel at the pump Could add cost to engines in case of high blends
Assumptions based on
RTFO reports for current and short term WTW savings and supply of non-crop based biodiesel;
RED estimated typical and default values for future biofuels WTW emission savings
DECC bioenergy strategy for supply limits of sustainable biofuels (total);
IEA Roadmap for supply limits of advanced biofuels (cellulosic feedstock); Observed prices (2008-13) for biofuels made from non-cellulosic feedstock; Public studies for cost of biofuels made from cellulosic 16
From feedstock such as waste, animal fat and lignocellusolic biomass, offering greater WTW emissions savings than ‘first generation’ biofuels and less land use change impact but not produced at commercial scale yet
10 RED sustainability
criteria for biofuels
SMMT findings on current ICEV stock compatibility with E10 and OEM announcements for future compatibility
feedstock; Cost of biofuels are assumed constant to 2030
In the new biofuel pathways, the contributions of different fuels and feedstocks evolve over time in-line with fuel availability and well to wheel (WTW) emissions improve over time reflecting these changing fuels and feedstocks. Biofuels considered are ethanol, butanol, non drop-in biodiesel and drop-in fuels.
The choice of feedstock and level of blend is determined by constraints on sustainable supply as well as ICEV compatibility. The approach taken can be summarised as follows:
• New higher blends are introduced when technically possible without incurring extra capital cost for vehicles and when most vehicles in stock are compatible. Lower blends (hence lower emission savings) are attributed to non-compatible vehicle in the stock – see Appendix 7.2.1 for details
• The choice of feedstock (cellulosic or non-cellulosic) as well as blend levels are set so that the resulting biofuel use does not exceed the supply constraints identified in the DECC UK Bioenergy Strategy and IEA roadmap – as discussed in the previous section, see also Appendix 7.2.2 for output graphs.
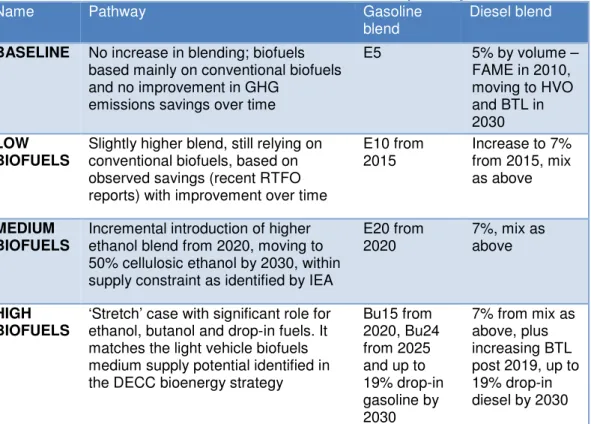
The pathways are summarised in Table 2 in terms of blend level and feedstock assumptions. The assumption on biofuels WTW emission savings and resulting blend WTW emissions are presented next.
Table 2 Overview of the baseline and the four new biofuel pathways
Name Pathway Gasoline
blend
Diesel blend
BASELINE No increase in blending; biofuels
based mainly on conventional biofuels and no improvement in GHG
emissions savings over time
E5 5% by volume – FAME in 2010, moving to HVO and BTL in 2030 LOW BIOFUELS
Slightly higher blend, still relying on conventional biofuels, based on observed savings (recent RTFO reports) with improvement over time
E10 from 2015 Increase to 7% from 2015, mix as above MEDIUM BIOFUELS
Incremental introduction of higher ethanol blend from 2020, moving to 50% cellulosic ethanol by 2030, within supply constraint as identified by IEA
E20 from 2020 7%, mix as above HIGH BIOFUELS
‘Stretch’ case with significant role for ethanol, butanol and drop-in fuels. It matches the light vehicle biofuels medium supply potential identified in the DECC bioenergy strategy
Bu15 from 2020, Bu24 from 2025 and up to 19% drop-in gasoline by 2030 7% from mix as above, plus increasing BTL post 2019, up to 19% drop-in diesel by 2030
11
Gasoline blends
Figure 3 shows the assumptions on WTW emission saving for ethanol and butanol and the resulting gasoline blend WTW emissions, for each biofuel pathway. The rationale for the assumptions is as follows:
• For 2010, the WTW savings are set at 48%, based on Renewable Transport Fuel Obligation (RTFO) 2011/2012 data18. The 2012/2013 RTFO data shows ethanol used in UK transport achieved improved savings, with an increase to 55% savings19, this number is applied from 2015 in the model.
• From 2020, it is assumed the WTW savings will have increased from the current 55% to 60% due to a combination of new production plants that have an improved performance and an increase in the use of sugarcane or lignocellulosic feedstock, in line with the RED targets20. For comparison, sugarcane ethanol currently used in the UK achieves 61% savings on average19 and the RED default values for ethanol from lignocellulosic feedstock range from 70 to 85%.
• By 2030, in the medium to high pathways, it is assumed ethanol and butanol are made from a mix of cellulosic and non-cellulosic feedstock with the following characteristics:
o Fuels based on non-cellulosic feedstock would be limited (e.g. through regulation) to
only the most efficient on a WTW basis and achieve 70% savings, as per the typical sugar cane value reported in the RED and observed value in the UK for sugarcane fuel imported from South America21.
o Cellulosic fuels achieve the default typical value set in the RED (76% savings).
The share of cellulosic fuel is capped (at 50% and 61% for ethanol and butanol respectively) in order to respect the production capacity limits identified in the IEA roadmap22. Based on these assumptions, savings are greater than 70%.
Figure 3 Ethanol and butanol WTW emission savings and resulting gasoline blend WTW emissions
The resulting WTW emissions for the gasoline blend are 8% lower in 2030 relative to 2010 values in the medium biofuel pathways, 32% for the high biofuels case (76 gCO2e/MJ and
56 gCO2e/MJ respectively). Savings are significantly higher in the high biofuel pathway
18 Department for Transport statistics; Biofuel statistics: Year 4 (2011/12), report 5 XLS tables. 19 Department for Transport statistics; Renewable Transport Fuel Obligation statistics: obligation
period 5, 2012/13, report 2 data tables
20 Article 17 of the RED stipulates that from January 2017, the biofuel WTW emission savings must
be at least 50% to count towards the national targets (and benefit from associated financial support that might be in place). From January 2018, the threshold is raised to 60% for plants that started production in 2017.
21 Department for Transport statistics; Renewable Transport Fuel Obligation statistics: obligation
period 5, 2012/13, report 2 data tables
22 Blend level set after an iterative process to achieve a consumption under but close to the supply
12 thanks to a share of drop-in gasoline set at 19% by 203022. Drop-in fuels are assumed to achieve 93%, as per the RED default value for farmed wood Fischer-Tropsch diesel.
Diesel blends
There are stronger constraints on sustainable feedstock availability for biodiesel than for ethanol or butanol23. As a result we have retained a low biodiesel blend (maximum 7%) to reflect this limitation.
The assumptions for biodiesel and diesel blends are shown in Figure 4. The same feedstock mix is assumed across the low and medium pathways, biodiesel WTW emission savings are therefore the same. They are based on the assumptions presented in Table 3. • For 2010-2015, the latest RTFO data on biodiesel WTW emission savings are used,
they are over 60%24. This is based on non-food crop biodiesel representing the majority of the mix.
• For future savings, it is assumed the current volume of non-crop biodiesel25 continues to be available to the UK, while the increased share of crop-based fuel achieves the WTW saving target set by the RED (50%) from 2020. To limit the use of crop-based biodiesel, F-T fuel is introduced in the biodiesel mix, with a share of 5% by 2030. The resulting overall reduction in the diesel blend on the low to medium pathways is modest (2% lower in 2030 compared to 2010) as the share of biodiesel is only 7%. In the high biofuel pathway, the 2030 diesel WTW emissions are markedly lower (66 gCO2e/MJ,
-20% compared to 2010) due to the high share of drop-in fuel (19%).
Figure 4 Biodiesel WTW emission savings and resulting diesel blend WTW emissions
Table 3 WTW emission savings assumptions for biodiesel
2010-2015 From 2020 Source
Non food crop biodiesel
83% 83% RTFO 2011/2012 report, based on
tallow and Used Cooking Oil Food crop
biodiesel
37% 50% RTFO (37% in 2011/2012) and RED
2017 target (50%, see footnote 20) BTL biodiesel Not in the
mix
93% RED (default value for farmed wood Fischer-Tropsch diesel)
23
An affordable transition to sustainable and secure energy for light vehicles in the UK, Energy Technologies Institute, June 2013
24 Department for Transport statistics; Biofuel statistics: Year 4 (2011/12), report 5 XLS tables 25
13
2.2.3 Cost of biofuels
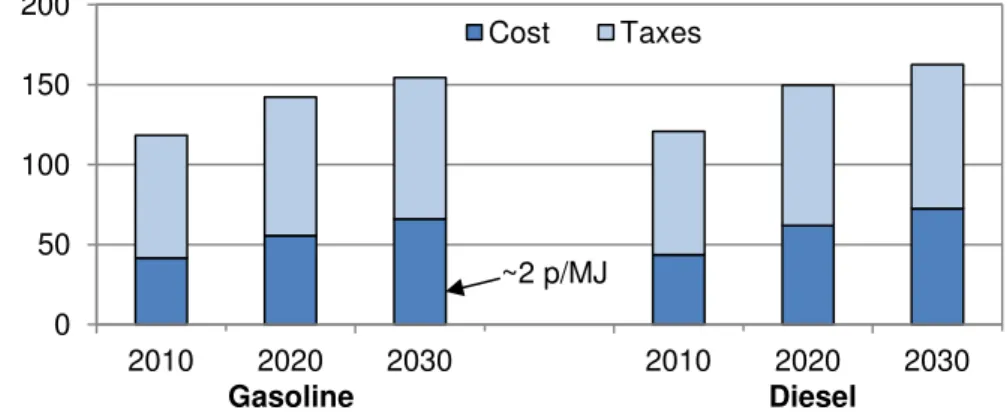
The cost of supplying biofuels is accounted for through a premium spread over all liquid fuels. The conventional fuels prices are based on 2012 DECC central retail price projections; these are shown in Figure 5 for 2010, 2020 and 2030. The cost premium of biofuels is calculated from the biofuel costs and spread over both gasoline and diesel supply, based on the previous year use of fuel. The premium is then added to the price of gasoline and diesel; this ensures the cost of RTFO compliance is represented in the overall system cost.
Figure 5 Price of fuels in ECCo (DECC 2012 central projections converted into 2010 prices) – baseline price before addition of biofuel cost premium
The biofuel costs used in the calculation of the cost premium of biofuel blending are presented in Table 4. These costs are significantly higher than the current untaxed gasoline and diesel prices, as described below.
Conventional biofuels
A cost of 2.335 p/MJ for conventional ethanol (based on observed prices over 2008-13) represents a difference of over 80% with current gasoline (and 15% with projected 2030 gasoline prices) – see Figure 6. Butanol (introduced from 2020) is assumed to cost the same as ethanol on an energy basis. Likewise, based on observed FAME prices, conventional biodiesel (and HVO from 2020) is set more expensive than diesel, with a premium over fossil fuel of 50% by 2010, but reaching cost parity with diesel by 2030.
Advanced biofuels
Advanced biofuels are not produced at commercial scale yet and thus it is uncertain when the projected costs will be reached. Developing the feedstock supply chain and ramping up production volumes will take time and above all, a policy and regulatory framework that gives the industry the level of confidence needed for investment in high capex plants. Cellulosic ethanol/butanol and drop-in fuels are set at 1.795p/MJ and 1.945 p/MJ, based on publicly available studies– this is slightly cheaper than the projected fossil fuel cost by 2030 (see Table 4).
Table 4 Cost of biofuels as used in the model (constant from 2010 to 2030)
Fuel p/MJ Source *
Ethanol and butanol (conventional)
2.335 Ethanol 5 year average Jan 2008 - Jan 2013 FOB Rotterdam (Platts)
Ethanol and butanol (cellulosic)
1.795 NREL, May 2011, Conversion of Lignocellulosic Biomass to Ethanol. Volume assumed 230 Ml/year 0 50 100 150 200 2010 2020 2030 2010 2020 2030 Cost Taxes P e n c e /l it re Gasoline Diesel ~2 p/MJ
14 Biodiesel (FAME and
HVO)
1.945 FAME 5 year average Jan 2008 - Jan 2013 FOB Rotterdam (Platts)
FT diesel and drop in gasoline
1.945 BP/EPC contractor, 2011, Wood to wheels study. Volume assumed 650 Ml/year
* Converted with €1=£0.87 and $1=£0.67
Biofuel costs are not decreased through time but assumed constant to 2030, reflecting the uncertainty over cost reduction opportunities for conventional biofuels and uncertainty over the speed of deployment of advanced fuels. By 2030, these costs translate into biofuels being at cost parity or slightly more expensive than conventional fuels – as shown in the figure below. This is consistent with the IEA roadmap that notes that production costs will decrease through scale and efficiency improvements to the extent that most biofuels could be competitive with fossil fuels by 2030, or slightly more expensive in the case of production costs strongly linked to oil prices.
Figure 6 Cost premium of biofuels over fossil fuels on an energy basis
2.2.4 Impact of biofuels on consumer proposition
Unlike plug-in vehicles, vehicles running on blended fuels offer the same refuelling experience to drivers as current ICEVs.
The fuel cost premium added by the blending of biofuels is the only difference perceived by consumers in the model across biofuel pathways. There is no extra cost added to the vehicle purchase as new blends are introduced when technically possible without incurring extra capital cost for vehicles. Vehicles concerned are ICEVs, hybrid and plug-in hybrid vehicles, for both gasoline and diesel models.
Table 5 summarises the highest blends available at the pump. Appendix 7.2.1 details the assumptions on stock compatibility with new blends. In the biofuel pathways, it is also assumed that new gasoline vehicles will be compatible with E85 from 2020. The consumption of E85 is however capped, at 10% of total gasoline energy consumption, constant over all scenarios, to reflect the limits brought by the rollout of the distribution chain. -20% 0% 20% 40% 60% 80% 100% Ethanol and butanol -conventional Ethanol and butanol - cellulosic Biodiesel - FAME and HVO Biodiesel - BTL C o s t p re m iu m 2010 2030
15
Table 5 Summary of highest blends available at the pump and level of drop-in fuel
2010 2015 2020 2025 2030 BASELINE E5 B5 LOW BIOFUELS E5 E10 B5 B7 MEDIUM BIOFUELS (WITH BUTANOL) E5 E10 Bu15 B5 B7 MEDIUM BIOFUELS E5 E10 E20 B5 B7 HIGH BIOFUELS
E5 E10 Bu15 Bu24
Drop-in fuel: 0% 5% 19%
B5 B7 B5 B7
16
3 Results: emission savings and cost impact of biofuels
3.1 Emission savings
Under the baseline assumptions26, ECCo results suggest a strong role for ICE vehicles to 2030 and hence a continued demand for liquid fuels. Figure 7 shows that by 2030, more than 90% of the stock is still ICE or hybrid (left) and that most plug-in vehicles are PHEVs (right). As a result, ca. 98% of the total 530PJ energy demand is met through liquid fuels.
S h a re o f th e c a r s to c k
Figure 7 ECCo base case result – GB car stock breakdown (left) and share of plug-in vehicles in the stock (right)
This reliance on liquid fuel means a high deployment of biofuels reduces emissions for the majority of the car parc. Figure 8 shows the annual WTW emissions of the GB car parc under the biofuel pathways. The MEDIUM BIOFUELS pathway achieves 9% (4Mt) lower emissions by 2030 compared to the baseline case (5% blends). In the extreme case of the HIGH BIOFUELS pathway, 12 Mt (27%) of CO2 are saved in 2030 compared to the base
case.
In the biofuel pathways, as in the base case, plug-in vehicles capture a market share of 11% by 2030, amounting to 2.6 million on the road by 2030. The plug-in vehicle market share is unchanged by the biofuel cost premium as it applies to all vehicles, except BEVs. The high capital cost of BEVs and consumer preference for higher range vehicles however means the biofuel cost premium is not enough to increase their relative attractiveness.
Figure 8 WTW emissions in Mt CO2e (tailpipe emissions plus fuel and electricity
production emissions)
26 Improvement of ICE, cost reduction and improvement of plug-in vehicles, enforcement of EU CO 2
target, see Appendix 7.1.
0% 20% 40% 60% 80% 100% 2010 2015 2020 2025 2030
ICE Hybrid Plug-in vehicles
0% 3% 6% 9%
2020 2030
PHEV/ REEV BEV
0 10 20 30 40 50 60 70 2020 2025 2030 M t C O2 e BASELINE LOW BIOFUELS MEDIUM BIOFUELS HIGH BIOFUELS
17
3.2 Cost impact and cost effectiveness
Achieving emission savings through biofuel blending comes at a cost, namely the cost of blending biofuels that are more expensive than gasoline and diesel. This cost is however modest: the premium added to the fuel price at the pump is around 2p/l by 2030 in the MEDIUM BIOFUELS pathway – see Figure 9. Taking into account the improvement in ICEV efficiency, this translates into an added £13 per year to the fuel spending of a medium size car.
Figure 9 Annual biofuel premium (p/l)
This additional cost for supply of biofuels is used to calculate the overall cost effectiveness of a pathway in reducing emissions. An additional cost is the conversion of some fuel stations to supply E85. From 2020, E85 represents up to 10% of the gasoline consumption. Meeting the resulting E85 demand (peaking at 36PJ and decreasing as a result of improved fuel efficiency to 26PJ by 2030) would require 1,600 stations to offer E85 fuel based on current stations throughput; for comparison they are currently ca. 8,900 fuel stations in GB. Based on a station conversion cost of £33,000,27 this represents a capital infrastructure cost of ca. £53million.
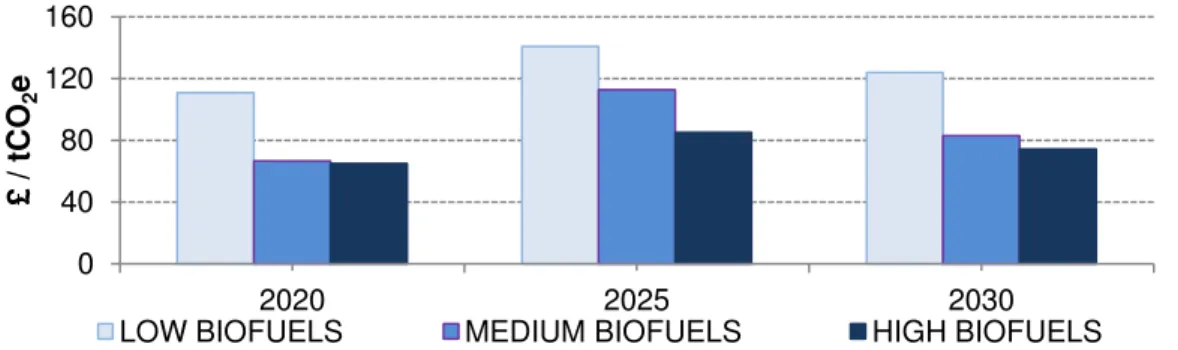
The annual emission savings (Mt) and additional cost (£m; biofuel cost premium and E85 stations) are calculated relative to the baseline pathway; Figure 10 shows the resulting cost of emissions reductions. Between 2020 and 2025, costs increase with a transition to higher blends. Post 2025, costs decrease due to higher share of advanced biofuels that are cheaper and have low WTW emissions.
Overall, the medium and high biofuels are much more cost effective than the low biofuel pathway, at around £80 versus £125 per tonne of CO2 avoided.
Figure 10 Annual cost effectiveness of emission reduction (£/tCO2e)
27
NREL, 2008. Average of reported range, converted to 2010 prices.
0 2 4 6 2020 2025 2030 p /l
LOW BIOFUELS MEDIUM BIOFUELS HIGH BIOFUELS
Biofuel premium increases due to higher blend in 2025 0 40 80 120 160 2020 2025 2030 £ / t C O2 e
18
4 Comparison with other powertrains
4.1 Cost effectiveness of emission savings
Complementarity of biofuels and hybrid powertrains
Figure 11 shows the WTW emissions of a mid-size car for hybrid, plug-in hybrid and electric powertrains, under different biofuel pathways. It shows that higher biofuel blends provide an additional 3 to 15g/km CO2 saving for a PHEV in 2030 relative to a 5% blend
and 6 to 27g/km CO2 saving for a HEV.
Thanks to their potential to lower emissions of PHEVs and HEVs (the most popular powertrains post-2020), biofuels are complementary to efforts to electrify transport in the medium term. Biofuels, PHEVs and HEVs could provide a transition to a future high BEV scenario, when technology cost reduction makes them cost competitive.
Figure 11 WTW emissions (gCO2e/km) of BEV, PHEV and HEV (segment C car,
gasoline model for PHEV and HEV)
Comparing cost effectiveness of BEVs and hybrid powertrains
Battery electric vehicles can deliver strong CO2 savings with a decarbonised grid, but are
expected to have significantly higher costs than ICEVs to 2030 as well as hybrid cars, the most popular model by 2030. Based on the grid carbon intensity projections from DECC of 102gCO2/kWh in 2030, a mid-size BEV would deliver 86% emission reduction compared
with a gasoline hybrid powertrain.28 The price before taxes of BEVs is however expected to be higher than HEVs by ca. £5,000 in 2030.29
On the other hand, biofuels deliver more modest emission savings but rely on a conventional powertrain and hence do not incur additional capital costs. In 2030, an E20 blend in an HEV can achieve a 10% emission savings compared to an HEV running on E5, for an annual fuel cost premium of £1330.
28 Assuming gasoline WTW emissions at 83g/MJ (E5 blend) and BEV 2.5 times more efficient than
the gasoline HEV on a MJ/km basis.
29 Based on cost from “A review of the efficiency and cost assumptions for road transport vehicles to
2050, AEA for the Committee on Climate Change, 2012. Adding 24% margin to vehicle cost.
30 Based on biofuel pathway ‘Medium biofuels’, costs and WTW emission assumptions presented in
Section 2.2 0 20 40 60 80 100 120 2015 2020 2025 2030 g C O2 e /k m
Most popular powertrains – with potential for lower emissions through biofuel
Lowest emissions from BEV but cost challenge for uptake
19 Despite achieving significant fuel cost reduction, the BEV capex premium means saving emissions through BEVs costs significantly more than with an HEV running on biofuels: £195 versus £13 for the annualised cost of emission savings to drivers31.
Figure 12 shows how these numbers translate into cost effectiveness, for three levels of grid decarbonisation for 2030: the aforementioned DECC projection of 102g/kWh and the sensitivity values used by DECC (50g/kWh and 200g/kWh)32. It shows biofuels have lower cost of emissions savings for the consumer than BEVs even with a highly decarbonised grid:
• The annual cost of emissions reduction for BEVs in 2030 is £170/tCO2, down to £160/tCO2 with the low grid carbon intensity
• Under the medium biofuels pathway, an ICE (running with E20) offers WTW emissions reduction at a 40% lower cost than BEV.
It is important to note that these results are sensitive to the assumptions on 2030 fossil fuel costs and BEV capital cost, both uncertain today. The differential under the latest cost projections however suggests biofuels blending is cost competitive for emissions reductions. For example, a 12% increase in fuel price brings the cost £/t of BEV to parity with the HEV running on E20. Likewise, a battery price 12% higher than assumed increases the BEV capital cost by ca. 4% and brings the cost effectiveness of BEV to £275/tCO2 (or £190/tCO2 with higher fuel prices).
Figure 12 Annualised cost of emission savings in 2030, segment C car, £/tCO2
(Includes extra capex annualised over 10 years, fuel savings and biofuel premium)33
31 Cost annualised over 10 years, no discounting applied to future cost or savings. Cost and
emission assumptions as described above, with added tax (20% VAT on vehicle capex and fuel, 5% VAT on electricity), 13,800 km p.a.
32
Gas Generation Strategy, DECC, December 2012
33 Based on figures presented above, the annualised cost is divided by the annual emission savings,
compared to an HEV running on E5 blend.
£202
£93 £171
£158
BEV HEV (MEDIUM BIOFUELS)
200gCO2e/kWh 102gCO2e/kWh2
20
4.2 Cost to the UK
Achieving emission savings through high level of plug-in vehicles
In the baseline scenario, the uptake of plug-in vehicles is low, for BEV in particular, because of their cost premium as well as consumers’ preferences in terms of range, technology and infrastructure access. In order to compare the cost effectiveness of a high penetration of plug-in vehicles versus the biofuel pathways, some high plug-in vehicle cases were modelled by relaxing customer constraints and applying strong vehicle price reductions.
Table 6 lays out the differences in the baseline model and high plug-in vehicle cases. In the latter, plug-in vehicles characteristics (e.g. charging time) are not considered in the purchase decision i.e. consumers choose vehicles only on the basis of total costs of ownership. In addition, in the ‘BEV support’ case, consumers see a price reduction (e.g. through subsidy or discounting) beyond the cost reductions through technology improvements for BEVs in 2015-2234. In the ‘Plug-in vehicle support’ case, the price reduction applies to all plug-in vehicles.
Table 6 Comparison of attributes part of the car purchase decision
Baseline Consumers compare vehicle costs as well as non-financial
attributes in their purchase choice (acceleration time, driving range, charging time and level of access to infrastructure). Consumers also display technology preferences towards non-plug-in vehicles.
High plug-in vehicle cases
Consumers make their purchase choice based on total costs of ownership (TCO) only, i.e. no technology preferences and no penalty for range/infrastructure limitations.
BEV support Consumers see a price reduction for BEVs in 2015-22
Plug-in vehicle support Consumers see a price reduction for all plug in vehicles in 2015-2022
Figure 13 compares the share of plug-in vehicles between the baseline case and the high plug-in vehicle cases described above. Relaxing consumer constraints and supporting BEVs lift the share from 7% to 15%, while supporting all plug-in vehicles achieves a 16% fleet share (5.25 million vehicles).
Figure 13 Share of plug-in vehicles in GB fleet in 2030
34
Starting in 2015 to follow on the current Plug-in Car Grant
0% 5% 10% 15% 20%
BASELINE BEV support Plug in vehicle support BEV
21 The price intervention on plug-in vehicle was set using an iterative process so that the resulting fleet achieves comparable emissions savings to the medium biofuels scenario – see Figure 14.
The required price reduction was of £5,000 until 2022. This suggests that significant price interventions (either incentives or manufacturer cross-subsidy) over the next decade are required to increase plug-in vehicle uptake beyond the baseline level.
Figure 14 WTW emissions (Mt CO2e) 35
Comparing the cost to the UK
The cost to the UK of saving emissions through the use of biofuels is calculated by comparing the fleet capital and energy expenditure in biofuel pathways to the baseline case (5% blend). In biofuel pathways, a fuel premium arises from the blending of ethanol, butanol, biodiesel and drop-in fuels that are more expensive than conventional gasoline and diesel. In the medium biofuels pathway, the total premium cost reaches £336m in 2030 for WTW emission savings of 4.1Mt/y – see Figure 15.
In the plug-in vehicle support scenarios, the capital expenditure is higher but running costs are lower than in the baseline case. The comparative added cost of plug-in vehicles is around £1,230m by 2030 for WTW emissions savings of 3.15Mt/y, i.e. three times the cost of the medium biofuels pathway.
Based on these numbers, the cost effectiveness of medium biofuels pathway is 4 times better than plug-in vehicles scenarios: £82/tCO2 vs. £390/tCO2. This includes significant reductions in battery costs36 and suggests further reductions would be required if BEVs are to offer similar cost effectiveness to biofuels.
For the high biofuels, the cost effectiveness is £74/tCO2 (the 2030 figures are £880m and 11.9Mt/y).
35 ‘BEV support’ and ‘Plug in vehicle support’ scenarios use the same biofuel pathway than the
baseline scenario, i.e. E5 and B5 blends.
36
$210/kWh for a BEV pack in 2030, a 70% reduction compared to 2011 levels,– see Appendix 7.1
0 10 20 30 40 50 60 70 2020 2025 2030 M t C O2 e
22
Figure 15 Additional cost to the UK (£million)37
5 The role of biofuels in the UK
Lowering the risk of not delivering emission savings
The UK transport sector must decrease its carbon emissions significantly in the next decades to meet the 2050 target of 80% reduction across sectors. Relying exclusively on ultra-low emission vehicle technologies for long term emission reduction introduces a risk of not meeting targets as uptake might be lower than expected due to cost and consumer acceptance.
By reducing emissions from all ICE vehicles, advanced biofuels could lower this risk, offering a cost-effective hedging strategy, as they do not preclude the introduction of plug-in vehicles and brplug-ing advantages even if high plug-plug-in vehicles sales are achieved plug-in medium term. Figure 16 compares the 2030 fleet WTW emissions when plug-in vehicles make up 7% of the national fleet (left) with emissions when their share is doubled (14% of the fleet, right). In both cases, the biofuel pathways offer significant emission reduction: 4Mt for the medium pathway, 11Mt for the high biofuel pathway.
Figure 16 2030 WTW emissions (Mt CO2e)
37
Additional costs in graphs are calculated against baseline scenario. Additional costs arise from the supply of biofuels (fuel premium – biofuel pathway case) and plug-in vehicles sales (accounting for fuel cost savings – support scenarios case). WTW savings achieved in 2030: low biofuels 2.1 Mt; medium biofuels 4.1Mt; high biofuels 11.9Mt; support scenarios 2.8Mt (BEV) to 3.15Mt.
0 500 1,000 1,500 2,000 2,500 3,000 2020 2023 2025 2028 2030 £ m ill io n
LOW BIOFUELS MEDIUM BIOFUELS
HIGH BIOFUELS BEV support
Plug in vehicle support
43.5 39.4 31.6 41.2 37.5 30.2 0 5 10 15 20 25 30 35 40 45 BASELINE MEDIUM BIOFUELS HIGH BIOFUELS BASELINE MEDIUM BIOFUELS HIGH BIOFUELS M t C O2 e
~ 7% plug-in vehicles in the parc ~ 14% plug-in vehicles in the parc
Price intervention for plug-in vehicles stops in 2022
23 The cost effectiveness of biofuels and complementarities with plug-in vehicles was noted in a recent report from the Energy Technologies Institute.38 Their analysis finds that gasoline plug-in hybrids are part of the least risk and least cost pathway to meeting the UK 2050 emission reduction target and recommends making new vehicles available now ready for high blend biofuels in the mid2020s.
Hydrogen fuel cell vehicles (FCVs) are also part of the ULEV portfolio and will contribute to the UK 2050 emission targets39. FCVs, although coming to the market soon, are not expected by the vehicle and gas industry to reach significant fleet penetration before the late 2020s40, and have not been explicitly included in the modelling. However, the contribution of FCVs can be estimated for comparison purposes based on recent data from UK H2Mobility. Based on the latest projections of 1.6 million FCVs on the road in the
UK by 2030, FCVs could bring a reduction of the order of 1.5 Mt41. It should be noted that the emissions from biofuels described in this study would be unaffected by the deployment of this number of FCEVs, since liquid fuels would remain the dominant transport fuel and hence be able to absorb significant volumes of sustainable biofuels.
Delivering the biofuels potential
The previous sections have discussed how biofuels could provide cost effective emission savings for the UK car fleet. A key assumption underlying the effectiveness of biofuels is biofuels meeting sustainability criteria and targets set by the Renewable Energy Directives. As outlined in the UK bioenergy strategy, the emissions related to Indirect Land Use Change are uncertain but potentially significant. This study however shows that, even under the ‘Highly Restrictive Sustainability Standards’ supply scenario (that goes beyond current RED criteria), there is scope for significant and cost effective emissions savings. Beyond the measurement of sustainability and enforcement of the sustainability criteria, policy signals must be in place for the supply chain of advanced biofuels to develop at a national level and provide a major contribution to emission reductions in the 2020s. As with any new technology, investors require clarity and certainty over the policy landscape. The introduction of emission policies based on WTW performance (as opposed to TTW) could be a lever to support the introduction of advanced biofuels, as well as being consistent with the expected vehicle technology shift to plug-in vehicles. As highlighted by a recent study on lifecycle emissions commissioned by the LowCVP42, tailpipe emissions will become increasingly inadequate in comparing vehicle emissions, in the context of increasing sales of plug-in vehicles and options for higher biofuel blending.
38 An affordable transition to sustainable and secure energy for light vehicles in the UK, Energy
Technologies Institute, June 2013
39 DECC 2050 Pathway Analysis 40
UK H2Mobility Phase 1 Report, 2013
41 Fleet projection and emissions level (35 gCO
2/km WTW): Ibid. Based on FCVs replacing vehicles
with average WTW emissions (115 gCO2/km - baseline case). 42 Life cycle CO
2e emissions assessment of low carbon cars 2020-2030, PE International for the
24
6 Conclusions
This study looked at the contribution of biofuels to the reduction of GHG emissions of the UK car fleet. Several biofuels pathways (set of assumptions on feedstock, blend level and resulting WTW emission savings) have been developed, based on conventional biofuels and transitioning towards advanced biofuels (made from cellulosic feedstock). The level of blending has been set to respect technical limits (engine compatibility), sustainable biofuel supply constraint as estimated in the UK Bioenergy Strategy and production capacity of advanced biofuels as identified by the IEA.
The key findings are:
1. High level of biofuels blending can be achieved within supply constraints
and achieves significant emission savings (up to 4Mt/year in medium
pathway). Advanced biofuels technologies allow this high level of blending, and reduce lifecycle GHG emissions from the biofuels mix.
2. At vehicle level, blending biofuels in fuels is a cheaper way to reduce
emissions than using BEVs in the timeframe to 2030: biofuels translate into an
average £13 annual cost increase for consumers compared to £195 annualised cost for BEVs. This translates into costs of £95/tCO2 versus £170/tCO2.
3. Achieving savings through high plug-in vehicles uptake results in an additional cost to the UK of £1,230m against a fuel premium of £336m in biofuel
pathways in 2030.
4. Biofuel pathways are complementary to HEVs and PHEVs, which are
expected to dominate low carbon powertrains during the 2020s. This means that there is a low risk of technology lock-in to pursuing increased use of biofuels alongside continued efforts to electrify road transport.
5. Advanced biofuels address emissions of both new and existing vehicles, thus reducing emissions earlier than new powertrains and abating the risk of relying
solely on longer term deployment of new technology.
This study has shown the UK has the opportunity to significantly reduce the fleet emissions by 2030, ahead of the market maturity of zero tailpipe emission vehicles. Increasing the role of advanced biofuels in road transport has a low risk of technology lock-insince the majority of vehicles, including PHEVs, benefit from biofuel blending. To capture the benefits of advanced biofuels, the UK must however put in place policy signals for the advanced biofuel supply chain to develop and provide a major contribution to emission reductions in the 2020s.
The current debate at EC level on the revision of the sustainability criteria and rules around the 10% target of 2020 is of particular importance. Reaching an agreement will allow for policy makers and the industry to have the certainty required for the deployment of biofuels – and thus for the UK to capture the emission savings potential identified in this study.
25
References
BP and EPC contractors, 2011, Wood to Wheels –The Challenges of Large Scale Forest Biomass to Liquids Conversion, presented at the International Biomass Conference, St Louis, May 3rd 2011
DECC, DfT and Defra, 2012, UK Bioenergy Strategy.
Available at https://www.gov.uk/government/publications/uk-bioenergy-strategy DECC, 2012, Bioenergy Strategy Analytical Annex.
Available at https://www.gov.uk/government/publications/uk-bioenergy-strategy
Element Energy, 2011, Influences on the low carbon car market 2020-2030, report for the Low Carbon Vehicle Partnership. Available at
http://www.element- energy.co.uk/wordpress/wp-content/uploads/2012/05/Influences-on-the-Low-Carbon-Car-Market-from-2020-2030-Final-Report-010811_pdf.pdf
Element Energy, 2012, Cost and performances of EV batteries, report for the Committee on Climate Change. Available at
http://www.element-energy.co.uk/wordpress/wp- content/uploads/2012/06/CCC-battery-cost_-Element-Energy-report_March2012_Finalbis.pdf
Energy Technologies Institute, 2013, An affordable transition to sustainable and secure energy for light vehicles in the UK. Available at
http://eti.co.uk/downloads/related_documents/2920_Transport_Report.pdf IEA, 2011, Technology Roadmap Biofuels for Transport. Available at
http://www.iea.org/publications/freepublications/publication/biofuels_roadmap.pdf NREL, 2008, Cost of Adding E85 Fueling Capability to Existing Gasoline Stations: NREL Survey and Literature Search. Available at http://www.afdc.energy.gov/pdfs/42390.pdf NREL, 2011, Process Design and Economics for Biochemical Conversion of
Lignocellulosic Biomass to Ethanol.
Available at http://www.nrel.gov/biomass/pdfs/47764.pdf
Official Journal of the European Union, Directive 2009/28/EC of the European Parliament and of the Council of 23 April 2009 on the promotion of the use of energy from renewable sources, L 140/16. Available at
http://eur-lex.europa.eu/LexUriServ/LexUriServ.do?uri=OJ:L:2009:140:0016:0062:EN:PDF UK H2Mobility Phase 1 report, 2013. Available at
https://www.gov.uk/government/uploads/system/uploads/attachment_data/file/192440/13-799-uk-h2-mobility-phase-1-results.pdf
26
7 Appendix
7.1 Model inputs and key assumptions
This study uses the Electric Car COnsumer model V2 (ECCo2), a model originally developed in 2010-2011 for the ETI and extended and updated for the Department for Transport (DfT) in 2012. ECCo2 is a consumer choice model that can combine the cost performance data of vehicles, energy prices and incentives in place with the consumer purchase preference data to estimate the future market share of each vehicle technology. Under the baseline assumptions, it is assumed the EU CO2 legislation will be enforced
with targets of 95g/km in 2020, decreasing to 70g/km in 2030, based on tailpipe emissions and a penalty set at £76 per g/km. Other CO2 based policies include national taxes such
as the Vehicle Excise Duty and company car tax. Other key model inputs include: • Consumer behaviour: based on quantitative survey on 2,700 new car buyers • Biofuel emissions and costs: biofuel pathways proposed by BP, checked against
supply constraint, costs from public sources – presented in section 2.2.
• Energy prices and grid carbon intensity: fossil fuel prices, electricity prices and grid intensity based on latest DECC projections.
• Cost of battery for plug-in vehicles based on latest Element Energy work; they are assumed to decrease by ca. 50% by 2020 compared to 2011 levels, and 70% by 2030 – see figure below. Costs are projected to decrease through scaling of production and improvement of electrode material leading to improved energy density.
Figure 17 Battery pack cost ($/kWh)43
43 Element Energy, 2012, Cost and performances of EV batteries, report for the Committee on
Climate Change $-$200 $400 $600 $800 $1,000 $1,200 $1,400 2011 2020 2030 $ /k W h -b a tt e ry p a c k BEV PHEV/REEV
27
7.2 Biofuel pathways: engine compatibility assumptions and
consumption outputs
7.2.1 Assumptions on ICEV compatibility with biofuel blends
The model can track the share of vehicle stock compatible with new blends to then attribute the highest compatible blend to cars. This is based on compatibility assumptions described below.
Stock from pre-2010 sales
Figure 18 shows the number of gasoline ICEVs on the road that is not compatible with blends such as E10, or E20 and Bu24. In the model, these vehicles are never attributed E10 or higher blends, to avoid overestimating the emission savings achieved by the introduction of higher blends.
The projection for E10 is based on a conservative 13% figure as identified by SMMT in 2012.44 The projection for E15/Bu2445 and E20 is based on assuming 50% (of which 11% is already accounted above) of cars sold before 2010 are not compatible. This is a conservative estimate based on all VW engines being E20 compatible since 201046, and the 2008 US based study that found no compatibility issues over selection of top selling models.47
All diesel vehicles are assumed compatible with B5 and B7 blends.
Figure 18 Number of gasoline ICEVs on the road from pre-2010 GB stock non compatible with E10 and with E15/Bu24 & E20
Assumptions for cars sold from 2010
All gasoline and diesel cars are assumed compatible with, respectively, E10 / Bu15 and B7 blends.
Figure 19 shows the assumption for E15/Bu24 and E20 compatibility: the share of new cars compatible increases from 20% in 2010 to 100% in 2015 – based on findings discussed above, this is a conservative estimate.
44
9% incompatible and 4% to be confirmed – SMMT analysis for the LowCVP Passenger Car Group
45
Bu15 is equivalent to E10 in terms of engine compatibility, and Bu24 is equivalent to E15.
46 VW press release, November 2012
47 “The Feasibility of 20% Ethanol Blends (vol) as a Motor Fuel”, conducted at the Minnesota State University Mankato and the University of Minnesota, with cooperation from the State of Minnesota, 2008 0 2 4 6 8 10 12 2010 2015 2020 2025 2030 M il li o n s c a rs
Incompatible with E10
28 The only high blend considered in this study, E8548, is introduced from 2020, when all gasoline cars are assumed to be compatible. The consumption is however limited at 10% of all gasoline use on an energy basis.
Figure 19 Share of new cars compatible with E15/Bu24 and E20
7.2.2 Consumption outputs and sustainable biofuel supply limits
Supply constraints and validation process
Two reports have been used to ensure the level of biofuels consumption modelled in this study is consistent with the total available volume of sustainable biofuels and projected advanced fuel production capacity: the 2012 UK Bioenergy Strategy published by DECC, DfT and DEFRA and the IEA Technology Roadmap Biofuels for Transport (2011).
These reports have been commented on in Section 2.2.1. Table 7 below summarises the results used in this study.
Table 7 Assumptions used a maximum limit for total sustainable biofuel volume and advanced biofuels volume
Total sustainable biofuel for UK light duty vehicles UK Bioenergy strategy
Global advanced biofuel production capacity [UK use share]
IEA Roadmap Medium supply Highly restrictive sustainability standards Cellulosic ethanol 2020 90 90 460 [9] 2025 132 120 1130 [22] 2030 174 150 1840 [37] 2035 216 180
Comments 2025-30 values interpolated from 2020 and 2035 values
UK share estimated based on current UK share of OECD gasoline use (ca. 2%). These findings have been used in the development of biofuel pathways, to adjust the blend level so that the resulting biofuel consumption does not exceed these supply constraints. Figure 20 illustrates the iterative process used to validate the biofuel pathways.
48 E85 is a gasoline blend with up to 85% ethanol (vol). It is however modelled at 75% (vol) to
account for seasonal variations in blending.
0% 20% 40% 60% 80% 100% 2010 2015 2020 2025 2030 S h a re o f n e w c a rs
29
Figure 20 Process to validate a biofuel pathway in terms of sustainable biofuel supply constraints
Biofuel consumption results
Total biofuel use
Figure 21 shows the total biofuel used by UK cars under the model runs for medium to high biofuel pathways, as well as the supply constraint on sustainable biofuels, as identified in the UK Bioenergy Strategy (figures presented above).
This comparison highlights that the high biofuels pathway is a stretch case, exceeding the supply identified under ‘Highly restrictive sustainability standards’ as well as being very close to the medium supply case. This high level of use implies no biodiesel is left for light commercial vehicles (that are mostly only fitted with diesel engines).
On the other hand, under the medium biofuel pathways, the biofuel consumption falls well within the supply constraints, leaving scope for biofuel use in light commercial vehicles. In these scenarios, the biofuels demand decreases as the overall gasoline consumption drops, a result of improvements in vehicle fuel efficiency.
Cellulosic ethanol and butanol
Results relative to the use of cellulosic ethanol and butanol are plotted in Figure 22. It shows the supply constraints derived from the aforementioned IEA Roadmap (dashed line) are not exceeded.
Drop-in fuels
In the High biofuel pathway, a significant share of conventional fuel is replaced by drop-in gasoline and drop-in diesel (BLT diesel). Although there are no projections of drop-in gasoline capacity available, the total drop-in fuel consumption falls within the potential identified by the IEA: around 37MJ drop-in gasoline and 43PJ drop-in diesel fuels are
Exceeded: revise feedstock mix
Define feedstock mix and blend
level
Run ECCo2 model
Compare with supply constraints
Input: WTW savings and cost of biofuels
Output: MJ biofuels used
Not exceeded: pathway validated