Chapter
10:
Transportation
Services
E
xecutive
S
ummary
Description
Kansas Medicaid provides transportation services for beneficiaries who need emergency transport or lack transportation services to access routine health care. In 2007, approximately 37,500 con-sumers utilized Medicaid transportation services resulting in expenditures of $9.6 million. Medi-caid reimburses five different types of transportation: commercial non-emergency medical trans-portation (CNEMT), non-commercial and non-emergency medical transtrans-portation (NEMT), emergent ground ambulance (EGA), non-emergent ground ambulance (NEGA) and air ambulance (AA). For transportation providers to be reimbursed, they must adhere to specific criteria for the specific type of transportation. Payment for transportation services is paid for on a fee-for-service (FFS) basis.
Key Points
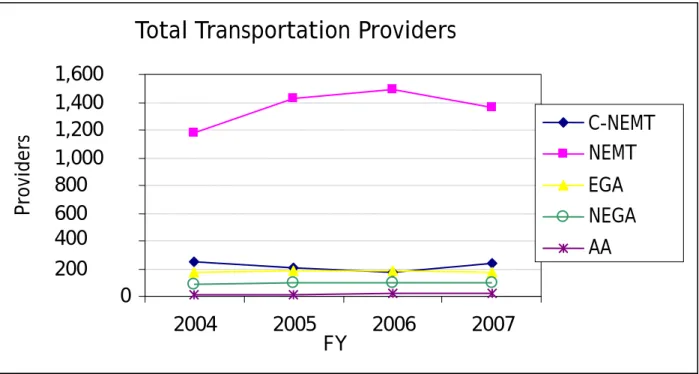
The total number of transportation providers participating in Medicaid was lower in fiscal year (FY) 2007 than in 2005 and 2006.
The limited growth in expenditures for transportation services may be attributable to: (1) more stringent participation rules for providers; (2) increased program scrutiny and manage-ment; (3) and a shift of approximately 50,000 low-income families from the fee-for-service HealthConnect program to the capitated managed care Medicaid program HealthWave.
Transportation service expenditures for the aged and disabled populations continue to in-crease. The Social Security Income (SSI) disabled population account for the majority of Medicaid expenditures and costs for this population have increased significantly since 2005.
Due to the large volume of transportation services, growing documentation requirements from the federal government, and participation by numerous small-scale providers (including beneficiaries themselves) the Kansas Health Policy Authority (KHPA) recognizes the need to expand oversight of transportation services, The increased oversight activity will ensure ap-propriate and cost-effective use of transportation services.
Although rising gasoline prices are a major concern for transportation providers, gas com-prises only a portion of transportation service costs. Absent a competitive process for reim-bursing providers, KHPA lacks a mechanism to directly link increased gas prices to service costs and reimbursement rates.
Other states have engaged transportation brokers to outsource transportation services in or-der to increase competition and promote program efficiencies.
KHPA dedicates approximately one full time staff member for transportation program management.
A private transportation broker would apply additional personnel resources and achieve program efficiencies through economies of scale.
Recommendation
Issue a request for proposal (RFP) to outsource management and contracting for Medicaid transportation benefits to a private broker. This would generate modest net savings to the state
Five year savings associated with outsourcing transportation services
O
verview and
B
ackground
Program Description
Transportation is a critical access to care issue for low-income and/or disabled populations. Medi-caid is one of the few health insurance programs that provide reimbursement for transportation services. Because Medicaid beneficiaries are by definition low-income, providing transportation for beneficiaries to medical appointments and for emergency services is essential to ensure appro-priate access to care. Medicaid beneficiaries often have inadequate access to private vehicles and many beneficiaries live in areas with limited public transportation. This program review ex-amines transportation services reimbursed on a fee-for-service basis. Both HealthWave capitated managed health plans, UniCare and Children’s Mercy Family Health Partners, sub-contract trans-portation services to a broker, who then contracts with individual providers and reimburses for services. Those services are not a part of this review.
Definitions
Five types of transportation services are provided to Medicaid beneficiaries in Kansas. These five types of transportation, described in more detail below, are:
Commercial Non-Emergency Medical Transportation
Non-Commercial, Non-Emergency Medical Transportation
Ground Ambulance, Emergent
Ground Ambulance, Non-Emergent
Air Ambulance FY 2009 FY 2010 FY 2011 FY 2012 FY 2013 5 Year Total State General Fund (SGF) $0 $-200,000 $-220,000 $-230,000 $-240,000 $-890,000 Total $0 $-500,000 $-530,000 $-560,000 $-590,000 $-2,180,000
For transportation providers to be reimbursed, they must adhere to specific criteria for the spe-cific type of transport, outlined below:
Commercial Non-Emergency Medical Transportation (C-NEMT) is covered when:
The beneficiary is transported to a Medicaid enrolled provider in order to receive Medicaid covered medical service.
The Medicaid beneficiary is present in the vehicle. For example, Medicaid does not reim-burse the transportation provider for the cost of driving to pick up the beneficiary.
Non-Commercial, Non-Emergency Medical Transportation (NEMT) is covered when:
Prior authorization has been given
The Medicaid beneficiary is present in the vehicle
The beneficiary is transported to a Medicaid enrolled provider in order to receive a Medi-caid covered medical service.
Only those consumers who are enrolled as an active Non-Commercial, Non-Emergency Medical Transportation provider will be considered for transportation related reimburse-ment.
Transportation is not covered for MediKan consumers.
Ground Ambulance, Emergent (EGA) is covered when:
The medical condition of the consumer necessitates ambulance transportation.
If the beneficiary’s health is in serious jeopardy.
If the beneficiary’s accident/injury/illness could cause serious impairment to bodily functions.
If the beneficiary’s accident/injury/illness could result in serious dysfunction of any bodily organ or part.
Ground Ambulance, Non-Emergent (NEGA) is covered when:
The beneficiary’s condition is such that a car or regular van cannot be used.
If the beneficiary is unconscious.
If the beneficiary cannot sit up.
If oxygen or other life support is required.
If the beneficiary is extremely obese or position of cast(s) or restraints are required.
Air Ambulance (AA) is covered when:
The beneficiary’s medical condition requires immediate and rapid ambulance transporta-tion.
Medically necessary documentation is provided.
S
ervice
U
tilization and
E
xpenditures
Transportation service expenditures in the fee-for-service program increased 13.1% in FY 2005 and 22.1% in FY 2006. In contrast, expenditures increased only 1.0% in FY 2007 (see Figure I and Table 6). Low growth in expenditures for transportation services in FY 2007 are likely to be attribut-able to increased program oversight and a transfer of approximately 50,000 beneficiaries from the fee-for-service HealthConnect program to the capitated managed care programs (HealthWave) in January 2007.
Figure 1 depicts the total fee-for-service expenditures for transportation claims for FY 2004 through FY 2007.
Figure 1
Figure 2 depicts fee-for-service transportation expenditures for FY 2004 through FY 2007. Pay-ments for commercial transportation are routinely higher than any other type, and command most of the attention in this year’s transportation program review.
Commercial transportation providers transport Level I and Level II beneficiaries. Level I benefici-aries are those who are ambulatory or able to walk. Level II beneficibenefici-aries are those who are non-ambulatory or need wheelchairs. Changes in spending differ markedly by provider type, with no-ticeable increases in the air and emergency ambulance categories. The increase in expenditures in FY 2006 of $1.7 million corresponds to increases in reimbursements for both air and emergency ground ambulances.
Total Transportation Expenditures by FY
$-$2,000,000 $4,000,000 $6,000,000 $8,000,000 $10,000,000 $12,000,000 2004 2005 2006 2007 FY E x p e ndit u re s
Figure 2
KEY
C-NEMT – Commercial non-emergent medical transportation NEMT – Non-emergent medical transportation
EGA – Emergency ground ambulance NEGA – Non-emergent ground ambulance AA – Air ambulance
Figure 3 delineates the number of providers by type of transportation services for FY 2004 through FY 2007. The number of non-emergent medical transportation providers decreased in 2007 by (.96%).
Figure 3
Transportation Expenditures by Provider Type
0
1,000,000
2,000,000
3,000,000
4,000,000
5,000,000
6,000,000
2004
2005
2006
2007
FY
Dollars
C-NEMT NEMT EGA NEGA AATotal Transportation Providers
0 200 400 600 800 1,000 1,200 1,400 1,600 2004 2005 2006 2007 FY Providers C-NEMT NEMT EGA NEGA AA
Figure 4 depicts the number of Non-Emergency Medical Transporation (NEMT) beneficiaries by provider type during FY 2004 through FY 2007. There has been steady growth in the number of beneficiaries receiving transportation services, despite the shift of 50,000 beneficiaries from the FFS to the HealthWave transportation program.
Figure 4
Figure 5 illustrates the transportation use by population. During FY 2004 through 2007 three populations used NEMT services the most and accounted for approximately three-fourths of Medicaid fee-for-service transportation costs.
Figure 5
Population refers to the Medicaid eligibility category: SSI Dis: Social Security Income disabled population MN Dis: Medically Needy Disabled
Low Income Families
Transportation Consumers by Provider Type
2004 2005 2006 2007 FY 0 2,000 4,000 6,000 8,000 10,000 12,000 14,000 16,000 18,000 Cons umers C-NEMT NEMT EGA NEGA AA
Transportation Expenditures by Population
$0 $1,000,000 $2,000,000 $3,000,000 $4,000,000 $5,000,000 2004 2005 2006 2007 FY Expenditures SSI Dis MN Dis Low Income Families
This breakout of expenditures by population type indicates that FFS transportation costs increased in FY 2007 for the Social Security Income (SSI) disabled population and the MS disabled population. As explained previously, expenditures for low-income families decreased as this population was transferred into HealthWave which uses subcontractors to provide transportation services.
P
rogram
E
valuation
In 2006, Center for Medicare and Medicaid Services (CMS) conducted a review of Kansas’ Non-emergency Medical Transportation (NEMT) program. This Financial Management Review (FMR) concluded that the oversight controls in place may not be sufficient to assure that payments for NEMT services are necessary and reasonable. This review was part of a nationwide emphasis on improving program integrity in this service area. In response to increased federal oversight, Kan-sas made a number of program improvements to the transportation program.
Revisions to Transportation Forms
Several revisions to transportation forms have reduced confusion and improved communication with transportation providers.
Updates were made to the C-NEMT Provider Manual in the General NEMT Requirements, Cov-ered Services, and Transportation Services Never CovCov-ered sections of the manual. These changes will reduce billing errors and over payments which require recoupment of disbursed funds. Additional requirements were added to promote a better understanding by transporta-tion providers of the qualifying requirements for Medicaid-covered services before they trans-port a Medicaid beneficiary.
The “Certification by Medical Provider for Transportation Services Form” has also been re-vised. This form allows the physician to classify the beneficiary as Level I (ambulatory; able to walk) or Level II (non-ambulatory; cannot walk). Previously, the billing system allowed a bene-ficiary to be either Level I or II, but not both. Problems arose when, for example, a benefici-ary would go into a dialysis treatment able to walk, but would be weak and need a wheelchair after treatment. Providers using the old form were only able to bill the same level of trans-portation for both trips, even though a wheelchair was only needed for the return trip. The newly revised form will allow a beneficiary to be classified as both Level I and II during a single trip.
The “Medical Necessity Form” was revised to clarify what constitutes a referral. The form clarifies that to refer a patient is to “transfer their medical care from one clinician to an-other.” The clarification will help physicians understand when to use referrals and limit re-coupment in audits by ensuring a more accurate referral system from primary care physicians to other physicians.
An The Provider Manual was amended to clarify billing unit descriptions in all applicable sec-tions. These revisions were necessary to make the billing unit description clear to providers and eliminate payment inconsistencies identified in our review.
Ongoing review and modifications should continue to improve communication with transporta-tion providers and beneficiaries.
Strengthening C-NEMT Provider Qualifications
In response to the federal review in 2006, Kansas Medicaid also put in place new policies that em-phasized enforcement of stricter criteria for new applicants and enrollees, as well as current transportation providers. This new increased enforcement policy will screen and monitor transpor-tation providers and drivers to ensure that beneficiaries are transported in safe, licensed and in-sured vehicles.
For applicants and new enrollees, the stricter criteria have allowed Kansas Medicaid to be more discerning when reviewing application forms and information on new drivers as well as terminating some current providers who did not meet the new standards. Greater scrutiny was used in the following areas:
-Requiring KBI criminal background checks on all drivers. -Requiring a valid driver’s license.
-Requiring proof of insurance and validating it by calling the insurance company. -Requiring vehicle inspections.
-Requiring photos of vehicles enrolled to transport Medicaid beneficiaries.
-Listing standard driver and vehicles guidelines, along with specific criminal history guidelines in the C-NEMT Provider Manual.
Enforcing these criteria has prevented former providers who have defaulted on payment to Medicaid to re-enroll under a new business name. In the past, C-NEMT enrollment applicants were not matched up with those providers who defaulted on recoupment payments to re-enroll under a new name. Electronic Data System (EDS), KHPA’s contracted fiscal agent for the Medi-caid program, has been asked to develop a spreadsheet that would provide disclosure of own-ership of present and terminated C-NEMT providers that would then be used in making enroll-ment decisions.
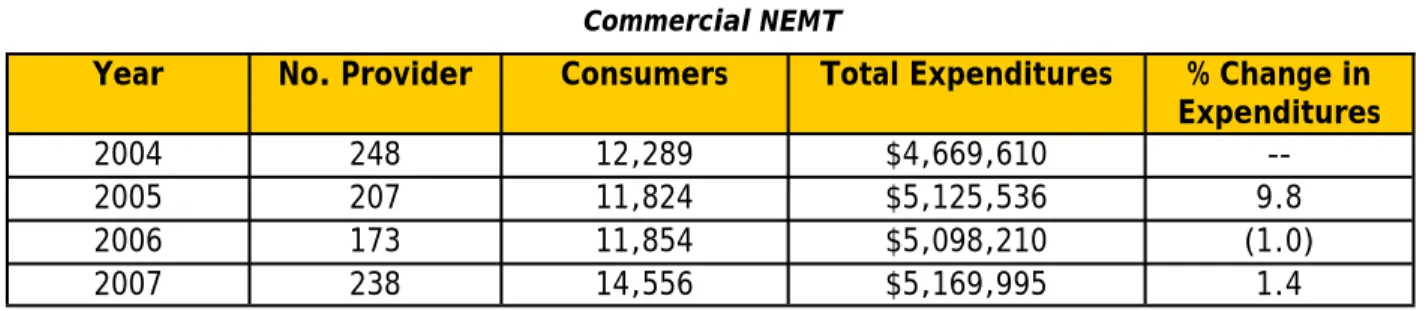
Implementation of these criteria for current providers has proven to be beneficial in ensuring quality and safety for beneficiaries. For example, enforcing the new standards has exposed providers who have not fulfilled their provider agreements. Medicaid was also able to identify providers who employ drivers with criminal records. Administrative reconsiderations, pre-hearings, and fair hearings have all increased in the past year. As well as have the number of recoupments. Trends observed in Figure IV suggest that this increased scrutiny over participa-tion in the transportaparticipa-tion program reduced the number of providers in FY 2004-2006, but that the number of C-NEMT providers increased significantly in FY 2007. C-NEMT expenditures in-creased 9.8% in FY 2005, but dein-creased 1% in FY 2006 before increasing again in FY 2007. The pattern suggests a substantial reduction in enrollment and spending on C-NEMT services in FY 2006, the year many of the stricter criteria for C-NEMT providers and billing were put in place.
Addressing Transportation Costs through Increased Reimbursement
Transportation program costs have increased for a number of reasons. Some of these increased costs result from improvements made to the program, such as improved access for beneficiaries, and increases in reimbursement when necessary. Targeted rate increases during the previous three years were needed to maintain provider participation in the program and ensure access for beneficiaries.
Observed increases in the number of consumers (see Figure 4) could be due in part to both in-creased staff outreach and to improved reimbursements. Efforts to replace Medicaid-financed private transportation with lower cost public transportation seem promising, but have not yet shown savings. Van passes for the local transportation authority were made available for Medicaid beneficiaries in the Wichita area, which have the potential to save the program some money, but enlisting participants has been slow and many beneficiaries are reluctant to switch transportation providers.
The costs to providers have also increased with rising gasoline prices. According to the Energy In-formation Administration, who produces the official energy statistics from the federal govern-ment, average regular retail gasoline prices for the Midwest over the last three years were as fol-lows: 2005 gas prices were $2.218; 2006 gas prices were $2.517; 2007 gas prices were $2.785, and; gasoline prices in 2008 have been as much as a dollar per gallon more than they were in 2007. After key C-NEMT providers communicated to KHPA that increases in business expenses threatened their operating and could lead them to possibly pull out of the transportation program, limited rate increases for C-NEMT providers were implemented in January 2008. Code A0130 (Level II, non-ambulatory) for wheelchair van transport increased from $20 per unit to $30 per unit. Two other codes for less complex transportation services did not increase. Additional reim-bursement codes will need to be considered for increases this coming year.
C
onclusions
Fee-for-service transportation programs are an area of fiscal vulnerability in Medicaid programs across the country. Costs continue to increase and audits routinely identify concerns with the in-tegrity of services and the accuracy of payments. This program review has documented the need for a new direction in the management of Medicaid transportation services in Kansas:
Enhanced oversight of transportation providers and billing practices has had a significant impact on provider participation and overall expenditures since FY 2005. Nevertheless, the underlying trend in both participation and spending was positive in FY 2007.
Fuel costs have caused some providers to threaten to exit the program, placing Medicaid beneficiaries at risk.
Program managers do not have enough time to ensure the program’s integrity, and internal audits continue to reveal concerns about provider compliance with transportation billing requirements.
KHPA policies place significant demands on transportation providers to serve as both man-agers and providers of transportation services. A broker for Medicaid transportation ser-vices would ease this requirement for providers as the responsibility to collect the required information and verify the legitimacy of transportation services would be streamlined.
R
ecommendations
1. Reconsideration of Reimbursement Rates
Transportation expenditures for 2009 will be impacted by fuel costs, maintenance, insurance costs and other factors. While rising gasoline prices are a major concern, gasoline comprises only a por-tion of transportapor-tion service costs, and KHPA lacks informapor-tion enabling a direct translapor-tion of increasing gasoline prices into service costs for the purpose of updating reimbursement rates.
Given the emphasis on re-organizing the delivery of transportation services (referenced in the fol-lowing recommendation), KHPA anticipates that future increases in fuel costs will be addressed through competitive outsourcing rather than direct fee-for-service (FFS) rate increases.
Nevertheless, KHPA is increasingly concerned about maintaining access to transportation services in light of the dramatic increases in the price of gasoline since 2008.
2. Transportation Broker
Over the past year, the KHPA has investigated the possibility of outsourcing the management and provision of transportation services using a broker that would be reimbursed through a risk-based contract. Staff have met with vendors, visited another state’s broker and have begun planning for procurement process. Some of the benefits to hiring a broker include:
A broker is expected to reduce overall costs by applying active scrutiny to services pro-vided, and by ensuring the minimum rates necessary to maintain access for beneficiaries. Conservative estimates project a 3% reduction in spending, or approximately $287,051 in FY 2010. However, additional savings should be realized by avoiding post pay recoupments. Approximately $400,000 has been identified for recoupments in each of the last two fiscal years.
The broker is the gate keeper for transportation services and storehouse for all the required transportation forms.
All trips are verified prior to payment. This should reduce recoupments.
The broker is responsible for obtaining Kansas Bureau of Investigation (KBI) background checks, vehicle inspections, and other documentation on all providers.
Access is nearly 24 hours a day, 7 days a week and should improve customer service broadly.
Brokers facilitate a more competitive market among providers for Medicaid transports by allowing KHPA to have an arms-length relationship with providers.
A broker would also address the administrative burden currently applied to transportation ser-vices that is placed on KHPA to increase program integrity and lower costs. The level of ad-ministrative oversight is limited by the number of dedicated program staff at KHPA
(approximately 1 FTE). Greater oversight is expected to reduce overall expenditures due to the impact on service costs, but additional staff is unavailable for this purpose. Transportation brokers providing services to Medicaid programs in other states would apply approximately 15 FTEs to manage a program of this size.
D
ata
T
ables
Table 1 Commercial NEMT
Year No. Provider Consumers Total Expenditures % Change in Expenditures
2004 248 12,289 $4,669,610
--2005 207 11,824 $5,125,536 9.8
2006 173 11,854 $5,098,210 (1.0)
Table 2
Non-Commercial NEMT
Table 3
Ground Ambulance - Emergent
Table 4
Ground Ambulance – Non-Emergent
Table 5 Air Ambulance
Table 6
Transportation Summary Table
Year No. Provider Consumers Total Expenditures % Change in Expenditures
2004 1,183 1,846 $462,821
--2005 1,425 2,343 $635,836 37.4
2006 1,489 2,428 $656,703 3.3
2007 1,364 2,274 $574,992 (12.4)
Year No. Provider Consumers Total Expenditures % Change in Expenditures
2004 170 11,751 $1,075,527
--2005 180 14,555 $1,332,053 23.9
2006 179 15,336 $2,608,924 95.9
2007 175 16,853 $2,679,799 2.7
Year No. Provider Consumers Total Expenditures % Change in Expenditures
2004 85 1,716 $67,344
--2005 94 2,825 $71,924 6.8
2006 92 2,499 $73,333 2.0
2007 98 3,004 $74,785 2.0
Year No. Providers Consumers Total Expenditures % Change in Expenditures
2004 16 645 $604,732
--2005 16 762 $615,314 1.7
2006 19 838 $1,066,908 73.4
2007 19 841 $1,068,807 0.2
Year No. Providers Consumers Total Expenditures % Change in Expenditures
2004 1,702 28,247 $6,880,024
--2005 1,922 32,309 $7,780,663 13.1
2006 1,952 32,955 $9,504,078 22.1
Table 7
Top 10 C-NEMT Providers of 2007
+C-NEMT Providers no longer in business.
Transportation Company Total Expenditures
First Class Transportation $390,477.50
Assisted Transportation Services, Inc. $281,072.50
A & A Medical Transportation $242,775.00
G & B Enterprises, Inc. $241,830.00
M Transportation $157,807.72+
Gordon Transportation $112,708.50
Best Choice Transportation $104,707.00
Capitol City Taxi, Inc. $100,132.76
GED Specialized Transport $ 89,337.50+