More than Robots:
An Evaluation of the FIRST Robotics Competition
Participant and Institutional Impacts
Prepared by:
Alan Melchior, Faye Cohen, Tracy Cutter, and Thomas Leavitt
Center for Youth and Communities
Heller School for Social Policy and Management
Brandeis University
Waltham, MA
Prepared for:
FIRST
Manchester, NH
T
ABLE OFC
ONTENTSChapter One: Introduction and Key Findings 1
Chapter Two: Participants in the FRC Study Sample 15
Chapter Three: The First Experience – Team Members’ Perspectives 19
Chapter Four: Education, Career, and Developmental Outcomes 31
Chapter Five: Institutional Context for FIRST: Impacts on
Participating Schools, Teachers, and Mentors 43
Chapter Six: Conclusion 57
Appendices
Using Propensity Scores to Create a Matched Comparison Group FRC Survey
Team Profiles
Acknowledgements
We would like to thank the many FIRST staff members, team leaders, mentors and program participants who assisted with this study. In particular, we want to thank David Brown, former Executive Director of FIRST, John Abele, FIRST’s Chairman of the Board, and Paul Allaire, FIRST Chairman Emeritus, who initiated the study; Paul Shay, FIRST’s current Executive Director, who has been supportive of the evaluation and patient in waiting for the results; Greg Gross, Cindy Abrams Randall and Dia Stolnitz, who oversaw the work for FIRST and have provided ongoing advice and support; Ana Martinez, Ian McEwan, and Susan Lawrence, who helped in recruiting the initial sites and arranging site visits; and most importantly, the FIRST team leaders who dug into their files to help identify FIRST alumni and, in some cases, helped to locate and contact former participants for the study.
More than Robots Evaluation of the First Robotics Competition April 2005
Center for Youth and Communities, Brandeis University 1
C
HAPTERO
NEI
NTRODUCTION ANDK
EYF
INDINGSA reminder, the FIRST competition is more than robots. It's about people, it's about learning to work together, it's working together toward a shared goal, doing teamwork, it's about finding and using each individual's unique talent to make the project team greater than the sum of its parts. It's about applying skills that will lead to success in whatever you do in life.
John Abele, Chairman of the Board, FIRST
INTRODUCTION
The FIRST Robotics Competition (FRC) is a high school robotics program designed to build not only science and technology skills and interests, but also self-confidence, leadership, and life skills among high school-aged youth. The FIRST Robotics Competition challenges teams of students and their mentors to solve a common problem in a six-week timeframe using a standard "kit of parts" and a common set of rules. Teams build robots from the parts and enter them in a series of competitions that involve not only the operation of the robots, but also presentation of a variety of other associated team activities, including computer animations, activities to increase the appreciation of science and technology throughout the school and community, and
involvement in community service activities. The goals of the program include an increased awareness and interest in science and technology, increased college going and potentially a focus on science and engineering careers, and the development of a set of attitudes and skills described by the program as “gracious professionalism” – the ability to work together within a team and to work cooperatively with those on other teams, including potential competitors.
In late 2002, FIRST contracted with Brandeis University to conduct an evaluation of the FIRST Robotics Competition. The goal of the evaluation was to begin to address three basic questions: What is the impact of the FIRST Robotics Competition on program participants in terms
of academic and career trajectories? Are FIRST participants more likely to graduate high school, go to college, and take courses or pursue a career in science and technology than similar, non-participating students? What impact does FIRST have on low income, women, and minority students who are often under-represented in science and technology programs and careers?
What can we learn about the implementation of FIRST in schools, both in terms of better understanding program impact and identifying “best practices”? How do sites vary in ways they organize their teams and the experience they provide participating students? Are some practices and/or experiences particularly important in determining impact? Are there
More than Robots Evaluation of the First Robotics Competition April 2005
Center for Youth and Communities, Brandeis University 2
‘best practice’ lessons that can be identified that can help to guide and strengthen new teams as they join the program?
What kinds of impact has participation in FIRST had on participating schools and partnering organizations? Has participation in FIRST helped to improve the climate of participating schools, strengthen math or science teaching, or led to broader partnerships with local companies and higher education institutions? Has participation in the program had an impact on program sponsors and the community, in terms of increased involvement in the schools, creation of new opportunities for youth, and/or changed attitudes towards students and schools?
Another key goal of the study was to focus the evaluation on schools in urban communities and/or serving high proportions of low income and minority students. One of the goals of FIRST has been to expand the involvement of low income and minority youth in FRC, and the
evaluation was seen as an opportunity to explore the impacts of the program on those groups in particular.
To address these questions, Brandeis conducted a two-part study. First, in order to assess the longer-term impacts on program participants, Brandeis conducted a retrospective survey of program participants who graduated from the program between 1999 and 2003, largely focused on students from teams in schools from two metropolitan areas: New York City and the
Detroit/Pontiac metropolitan area.1 The schools/teams were selected to ensure the inclusion of schools serving low income, urban or minority students.The surveys were designed to gather information on post-high school education and career experiences of program participants, as well as data on the participants’ own retrospective assessments of their program experience and the impact of the program on them. In order to provide a comparison with youth who had not been in FIRST, the study was designed to allow the comparison of FRC survey data with comparable data from an existing national dataset: the Beginning Postsecondary Student (BPS) Survey, a national sample of college-going students available through the U.S. Department of Education. 2
Second, in order to provide feedback on program implementation and institutional impacts, the evaluation also conducted site visits and interviews with team representatives in 10 participating high schools in the two communities. Those visits were designed to gather information on the implementation of the program and impacts on participating schools and program sponsors. The purpose of this report is to convey the final results from both the retrospective survey and site visits. The report is organized into six major sections. This initial chapter provides a
1 The initial program design called for inclusion of schools from a third area: the San Jose/San Francisco
metropolitan area. Because of difficulties in obtaining participant data from those teams, only one California team ended up in the study. Also, because several of the schools that were included in the study had contact information for participants several years prior to 1999, those earlier participants were also included in the study.
2 The Beginning Postsecondary Students Study provides data on approximately 12,000 students who entered college
during the 1995-96 school year and were tracked over a six-year period (through 2001). For background on the BPS study, see National Center for Educational Statistics, Beginning Postsecondary Students Longitudinal Study: 1996-2001 (BPS: 1996/2001), Methodology Report (Washington, D.C.: U.S. Department of Education, National Center for Educational Statistics, Technical Report (NCES 2002-171), 2002.
More than Robots Evaluation of the First Robotics Competition April 2005
Center for Youth and Communities, Brandeis University 3
summary of key findings and an overview of the methodology used in the study. Chapter Two discusses the characteristics of the FRC participants and schools involved in the study. Chapter Three presents the participants’ assessments of their FIRST experience, based on the FRC survey data. Chapter Four examines key education, career and developmental outcomes, also based on the survey data and data from the matched comparison group. Finally, Chapter Five reviews the site visit and interview findings, including discussions of institutional impacts, assessments of the mentor experience, and discussions of challenges and lessons learned. Chapter Six provides final conclusions for the study.
KEY FINDINGS
Key findings from the study include the following: Program Participants
The FIRST alumni in the study represent a diverse group, including substantial numbers of students who are minorities, women, and from families with a limited educational
background. Fifty-five percent of the respondents were non-white (African-American, Asian, Hispanic, and multi-racial); 41% were female; and 37% came from families where neither parent had attended college (including community college).
At the same time, participants were relatively successful students in high school. The mean high school Grade Point Average for alumni in the sample was 3.5 (B+) and 84% had a B average or above. Average SAT and ACT scores and participation in high school math and science classes among respondents were both above the national averages. What is not clear (and cannot be answered in this study) is whether this strong performance in high school was the result of involvement in FRC, or whether FRC attracted strong students, or both.
Team Members’ Assessments of FIRST
Based on the survey responses, FIRST provided a positive experience that gave participants an opportunity to be involved in a challenging team activity, build relationships, learn new skills, and gain a new understanding of and interest in science and technology.
Almost all participants felt FIRST had provided them with the kinds of challenging
experiences and positive relationships considered essential for positive youth development.
- Eighty-nine percent indicated they had “real responsibilities;” 76% felt they had a chance to play a leadership role; and 74% reported that students made the important decisions. Ninety-six percent reported having fun.
- Ninety-five percent reported getting to know an adult very well, and 91% felt they learned a lot from the adults on the team. Ninety-one percent felt they “really belonged” on the team.
Most participants also reported a positive impact on their attitudes towards teamwork, interest in science and technology, and how they saw themselves. Participants reported:
More than Robots Evaluation of the First Robotics Competition April 2005
Center for Youth and Communities, Brandeis University 4
- An increased understanding of the value of teamwork (95%) and the role of “gracious professionalism” (83%).
- An increased understanding of the role of science and technology in everyday life (89%), increased interest in science and technology generally (86%), and increased interest in science and technology careers (69%).
- Increased self-confidence (89%) and an increased motivation to do well in school (70%). FIRST also helped increase participants’ interest in serving others: 65% of respondents
reported that, as a result of FIRST, they wanted to help younger students learn about math and science; 52% reported that they had become more active in their community.
The large majority of participants also reported that FIRST had helped them gain
communications, interpersonal, and problem-solving skills, and how to apply academic skills in real-world settings.
- More than 90% reported learning important communications skills, such as how to listen and respond to other people’s suggestions (94%) and how to talk with people to get information (94%). Seventy-three percent reported learning how to make a presentation in front of people they did not know.
- Students also learned teamwork and interpersonal skills. Ninety-two percent reported learning how to get along with other students, co-workers, teachers and supervisors; 90% learned to work within the rules of a new organization or team; 88% reported learning new ways of thinking and acting from others; and 73% learned ways to stop or decrease conflicts between people.
- Students learned problem-solving and time management skills: how to solve unexpected problems (93%); how to manage their time under pressure (90%); how to weigh issues and options before making decisions (94%); and how to gather and analyze information (88%).
- Students also learned to apply traditional academic skills in real-world setting: 68% reported learning how to use computers to retrieve and analyze data, and 67% reported learning about using practical math skills such as using graphs and tables or estimating costs.
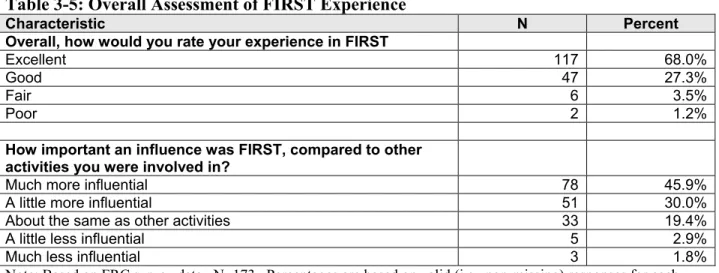
Overall satisfaction with the program was high. Ninety-five percent of the alumni rated their experience as “good” or “excellent” (27% and 68% respectively). Forty-six percent of respondents indicated that FIRST had been “much more influential” than their other activities during high school.
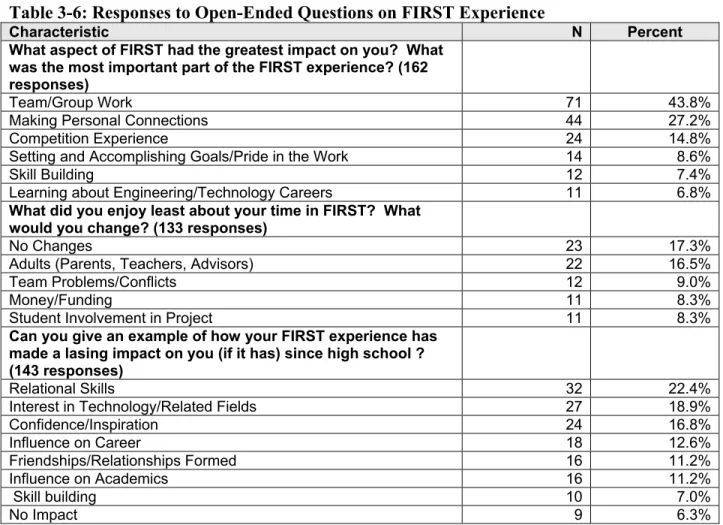
Finally, response to open-ended questions on the survey tended to reinforce these findings: participants cited the team experience as particularly influential and cited team skills, new relationships, an increased focus on science and engineering, and increased self-confidence and motivation, among others, as long-term impacts from the program.
More than Robots Evaluation of the First Robotics Competition April 2005
Center for Youth and Communities, Brandeis University 5
Education, Career and Developmental Outcomes
While participant assessments provide one measure of FIRST’s impact, the ultimate measures of FIRST’s effectiveness are the degree to which alumni go on to have productive educational experiences, careers, and lives in their communities. The analysis of the alumni survey data indicate that FIRST alumni are making a successful transition to college, and are much more likely to pursue their interests in science and technology and become involved in their
communities than is the case for college-going students generally or for the matched group of comparison students.
The large majority of FIRST alumni graduated high school and went to college at a higher rate than high school graduates nationally.
- Among those responding to the survey, 99% reported graduating high school and 89% went on to college. At the time of survey, 79% were still in college; most of the others were employed. (Only 5.5% of the alumni reported that they were unemployed.) These figures compare favorably to the national average where (based on U.S. Census data) 65% of recent high school graduates went to college.
- The high levels of college-going applied across the board to both men and women and across racial and ethnic groups in FIRST. Seventy-seven percent of female FRC alumni were in college, 68% of African-American alumni, and 78% of Hispanic alumni – all above the national averages for those groups.
Once in college, a substantial proportion of FIRST alumni took courses and participated in jobs and internships related to science, math and technology.
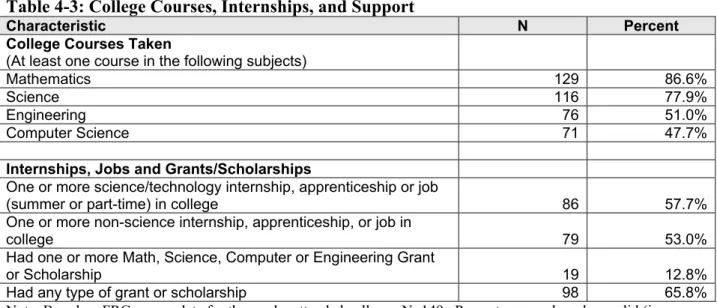
- Eighty-seven percent took at least one math course and 78% took at least one science course in college. Perhaps more striking, 51% took at least one engineering course.
- Nearly 60% of FIRST alumni had at least one science or technology-related work experience (internship, apprenticeship, part-time or summer job). Thirteen percent received grants or scholarships related to science or engineering; and 66% reported receiving any kind of grant or scholarship.
- High proportions of women and minorities also participated in math/science/technology courses and internships. Forty percent of female alumni took engineering classes, 59% had a science/technology internship or job. Forty-six percent of African-American alumni and 53% of Hispanic alumni took engineering courses. Sixty-four percent of African-American alumni (but only 29% of Hispanic alumni) had science/technology internships or jobs.
FIRST alumni were also substantially more likely to major in Engineering than the average college student nationally.
- Of those FIRST alumni reporting a college major, 41% reported they had selected
More than Robots Evaluation of the First Robotics Competition April 2005
Center for Youth and Communities, Brandeis University 6
Postsecondary Student study, FIRST alumni were nearly seven times as likely to become Engineering majors as the average college student nationally (41% for FRC alumni vs. a national average of 6%). FIRST alumni were also twice as likely to enroll as Computer Science majors (11% vs. 5% nationally).
- Women and minority alumni also majored in Engineering at comparatively high rates. Thirty-three percent of the female FRC alumni, 27% of the African-American alumni, and 47% of the Hispanic alumni reported majoring in Engineering (compared to national averages of 2%, 5% and 6% respectively).
Finally, FIRST alumni were also substantially more likely to aspire to higher levels of education than the average college student nationally. Seventy-eight percent of FIRST alumni reported expecting to attain a post-graduate degree, either a Master’s degree (47%) or another terminal degree such as a Ph.D., MD, or MBA (32%). Only 2 participants in the study (1.4%) reported that they did not expect to attain any kind of degree. Nationally, 60% of students in the Department of Education’s BPS study aspired to completing a Masters degree or higher and 4.4% did not expect to receive any degrees.
The positive education and career outcomes for FIRST participants were also evident in an analysis that compared FIRST participants with a matched comparison group of students drawn from the national Beginning Postsecondary Student survey data. As noted, the comparison students were matched with FRC alumni in terms of their demographic characteristics and their high school academic backgrounds, including similar levels of high school math and science course-taking. Major findings from that comparison group analysis reinforce the positive outcomes associated with participation in FRC. FIRST alumni were:
Significantly more likely to attend college on a full-time basis than comparison students (88% vs. 53%);
Nearly two times as likely to major in a science or engineering field (55% vs. 28%) and more than three times as likely to have majored specifically in engineering (41% vs. 13%);
Roughly 10 times as likely to have had an apprenticeship, internship, or co-op job in their freshman year (27% vs. 2.7%); and
Significantly more likely to expect to achieve a postgraduate degree (Master’s degree or higher: 77% vs. 69%).
More than twice as likely to expect to pursue a science or technology career (45% vs. 20%) and nearly four times as likely to expect to pursue a career specifically in engineering (31% vs. 8%).
In each case, these differences were statistically significant. The differences in engineering majors and careers also applied to female and non-white FIRST participants, who were
significantly more likely to declare engineering majors or expect to enter an engineering career than students in the comparison group.
More than Robots Evaluation of the First Robotics Competition April 2005
Center for Youth and Communities, Brandeis University 7
FIRST alumni were also significantly more likely to be involved in community service and to express a commitment to several positive goals and values than the members of the matched comparison group. FRC alumni were more than twice as likely to perform some type of volunteer service in the past year as were students in the matched comparison group (71% vs. 30%), and were significantly more likely to provide some of the specific types of service that might be associated with FIRST team efforts: tutoring, coaching or mentoring with young people (such as helping another team or a younger team), fundraising, and neighborhood improvement. In each of those specific categories of service, FRC alumni reported levels of volunteer service that were four to ten times as high as those of the comparison students. Finally, the only outcomes in which the data indicate that FRC students did significantly worse than the comparison students were in receipt of grants and scholarships in their freshman year and across all four years of college. This is a somewhat surprising result given FIRST’s active efforts to raise scholarship monies for FRC participants and the fact that 66% of FRC
participants reported some form of grant or scholarship in college. However, it suggests that, as of the time these FRC students were going on to college (1999-2003), those efforts had not yet resulted in a relative advantage for FRC participants in grant or scholarship funding when compared to students with similar backgrounds.
In sum, the data from the FRC survey shows FIRST as having a strong, positive impact on participating youth, including women and minorities. FIRST alumni appear more likely to go to college and to continue to pursue their interests in science and technology, with a striking proportion pursuing studies in Engineering. Young people in the program also report positive impacts on understanding of science, attitudes towards themselves and others, and a variety of work-related skills. In short, based on the data from this study, FIRST appears to be meeting its goals of providing a positive and engaging developmental experience for young people and is succeeding in its efforts to increase the interest and involvement of participating youth in science and technology.
Institutional Contexts: Impacts on Schools, Teachers, and Mentors
Based on data gathered through site visit interviews and observations, FIRST has also had a positive impact on participating schools and teachers, though that impact was limited in scope.
- Involvement in FIRST has led to creation of new courses and/or integration of robotics instruction into existing classes in 8 of the 10 schools visited. FIRST has also helped teachers to develop or exercise new skills (primarily planning and management skills) and has had a positive effect on school spirit in a number of schools (one team leader attributed an increase in school enrollment to FRC’s impact on school reputation).
- At the same time, involvement in FRC has not led to broader changes in teaching or curriculum, or to the establishment of broader partnerships with FRC sponsors. In most cases, this was not seen as a goal for the program.
Mentors played an important role in almost all of the teams visited, with the specific roles varying widely.
More than Robots Evaluation of the First Robotics Competition April 2005
Center for Youth and Communities, Brandeis University 8
- Most teams reported mentors provided assistance through a combination of topic-based technical workshops for team members and hands-on guidance with individual students. In some cases, mentors also helped students with homework and worked to develop positive relationships with students on the teams. None of the mentors reported receiving any training in preparation for their role, though only two felt that it was needed.
- Some sponsors took additional steps, including working with multiple teams, establishing workshops for teams in a region, allowing multiple teams to use workshop space, and in some cases branching out to start new or work with new teams.
- At least 3 of the 10 teams in the study also had FIRST alumni working as mentors.
- Mentors generally reported positive impacts, including opportunities for career
advancement, increased morale and job satisfaction, access to new hires, and a sense of satisfaction and connection to students on the team.
- In general, company-wide impacts on the sponsoring companies were limited. While some firms did include their involvement in FIRST in promotional materials, most did not. Similarly, while individuals within firms recruited interns from among FIRST participants, most recruiting and hiring of FRC participants took place on an ad hoc basis rather than through consistent company policy.
Site visit interviews also identified a number of barriers and challenges faced by the teams. Some of those challenges include the following:
- Start-up challenges: learning how to organize and run the team.
- Meeting space: access to space and equipment to build the robot.
- Transportation and safety: transporting students to and from team meetings, particularly during competition season when the team might work until late at night.
- Financial challenges: obtaining and maintaining sources of funding was overwhelmingly reported to be the primary challenge in doing FRC, with travel (to tournaments) as the biggest cost.
- Burnout: most coaches noted burnout as a danger and suggested strategies that included dividing the workload among several coaches and “over-organizing” to ensure smooth team operations.
- Working with sponsoring corporations: several teams reported challenges working with sponsoring companies, including limited team control over the budget and pressure on the mentors to win from the company CEO.
- Recruiting mentors: experiences varied widely, with Michigan teams generally reporting greater corporate support (most had been approached by companies) and those in NYC
More than Robots Evaluation of the First Robotics Competition April 2005
Center for Youth and Communities, Brandeis University 9
reporting greater challenges in securing the interest of sponsors and mentors.
- Recruiting teachers: another ongoing challenge, but an important step for teams to take in order to share the workload. In some cases recruitment was difficult because non-FRC teachers were resentful of the attention received by those already involved in FRC or saw the FRC team as “owned” by a particular teacher.
- School administrative and district support: support varied, from strong administrative support and access to resources, to more reluctant support. Similarly, district support ranged from little or none (because of budget cuts) to active support (funding for travel, etc.). One key is making the benefits of participation clear.
- Parent support: most teams indicated they have only low levels of parent volunteer support.
Several additional challenges were also identified by the mentors who were interviewed as particularly important in working with underserved schools. Those included:
- Turnover of school administrators: high levels of turnover at urban schools required that administrator ‘buy-in’ be renewed on a regular basis.
- Attendance of team members at meetings: the need of some team members to balance team participation with after-school responsibilities, including work and child care for siblings, made consistent involvement difficult for students on some teams.
Transportation to and from meetings also presented a problem for some team members.
- Addressing the needs of students from underserved areas: while positive about their experiences, some mentors did note the additional challenges involved in working with students, i.e., difficult personal lives or limited experiences and social skills.
- Working with school staff: gaining consistent teacher participation, challenges in communicating with teachers, and differences in operating philosophies.
Recommendations
The principal findings of this study provide strong support for the continued growth and
expansion of the FIRST robotics programs, particular into communities serving low income and minority youth. The major recommendations are to continue to document the effectiveness of the program and to build a broader base of evidence for the program’s impacts through two mechanisms: a larger-scale longitudinal study that would allow for a more comprehensive
analysis of participant impacts, and the development of a participant registration process for FRC that would make it easier to keep in touch with FIRST alumni and to track the longer-term career trajectories of former participants.
More than Robots Evaluation of the First Robotics Competition April 2005
Center for Youth and Communities, Brandeis University 10
METHODOLOGY
As noted above, the evaluation of the FIRST Robotics Competition is based on two major sources of data: a retrospective survey of FRC participants and site visits and interviews in a number of FRC sites. In both cases, the goal of the study was to provide multiple perspectives on the FIRST experience and to be able to address a wide range of potential impacts on program participants, participating institutions, and program partners.
FRC Retrospective Survey. The primary source of data on participant impacts is a survey of former FRC program participants from schools largely in the Detroit/Pontiac and New York City metropolitan areas. Initially, thirty schools/teams were invited to participate in the study. One of the major challenges for the study was the absence of program records and useable contact information for many of the sites originally included in the sample. As a result, construction of a sufficient sample took considerably longer than originally anticipated and a number of
schools/teams were never able to provide information on former team members. Ultimately, fourteen teams were able to provide identifying information on approximately 360 former FIRST participants.
Survey Administration. Surveys were then distributed by mail and email beginning in April 2004. Respondents were offered the option of completing the surveys online in a web-based version, by returning a paper version in a postage paid envelope, or through a telephone interview. Participants were also offered an incentive payment of $20 for completion of the survey. Evaluation staff conducted multiple rounds of outreach and follow-up activities to encourage a response, including email messages, reminder postcards, letters to parents, and telephone reminders to those students where a phone number was available. Where mailed materials were returned as undeliverable, an effort was made to update the contact information through program staff, college directories, and online telephone directories. Altogether,
completed surveys were received from 173 former participants, an overall response rate of 48%. When those participants for whom a valid address or telephone number could not be found are excluded from the count (61 participants), the final response rate increases to 57%.
Survey Content. As noted above, the surveys were designed to gather information on
participants’ post-high school education and employment experiences, as well as information on their involvement in the FIRST Robotics Competition and their retrospective assessment of the impact of the program. Major elements of the survey included the following:
Graduation from high school College attendance
College courses and majors
Internships, scholarships, and part-time or summer jobs Post-high school employment
Involvement in community service Involvement in FIRST activities Self-reported FIRST impacts
More than Robots Evaluation of the First Robotics Competition April 2005
Center for Youth and Communities, Brandeis University 11
The surveys also collected data on each student’s high school academic background and
demographic characteristics. Those data were designed to provide a profile of the young people in the sample to allow for examination of differences by key demographic characteristics (for example, race/ethnicity or gender). The demographic data and the high school academic data, however, were also intended to be used to develop a matched comparison group sample drawn from the U.S. Department of Education’s Beginning Postsecondary Student (BPS) Survey. Matched Comparison Group. One of the key elements of the study design was the use of a matched comparison group drawn from an existing national dataset in order to compare selected outcomes for FIRST participants to those of young people with similar demographic
characteristics and high school academic backgrounds. The goal of the comparison group process (known as a “quasi-experimental” design) is to be able to distinguish the outcomes that were a result of participation in the program from those that would have occurred if students had not been in FIRST. This is accomplished by comparing the experience of FIRST participants to similar, non-participating young people. Generally, a comparison group is formed by identifying a similar group of students at the time a program is taking place, or by randomly assigning applicants to a program into “treatment” and “control” groups. However, because of the
retrospective nature of this study, that process could not be used. Instead, it was decided to use a comparison group drawn from an existing national dataset – the Beginning Postsecondary
Student Survey. While the use of an existing dataset offers some challenges, it does provide an opportunity to create a well-matched comparison group where other types of comparison group procedures are not possible.3
In this instance, the Beginning Postsecondary Survey offered the opportunity to generate a well-matched comparison group. BPS data included extensive information on the demographic and high school academic background of students in the dataset, making it possible to select a comparison group that came from similar socioeconomic backgrounds and had similar levels of academic achievement in high school. At the same time, the BPS dataset provided information on key outcomes of interest for FIRST, including college major, expected career choice, and
3 There are several major challenges in using an existing dataset to construct a comparison group. The first is that it
limits the questions that can be addressed to those already available in the existing dataset. In this instance, for example, the BPS dataset included information on students’ college major (a key outcome for FIRST), but not on college courses or the types of jobs students had during college. As such, while the BPS data can be used to compare FRC participants with BPS students on some outcomes, there are other outcomes for which no comparison data are available.
Similarly, the “baseline” data that can be used in constructing the comparison group is also limited. In this case, for example, participants and comparison students can be compared in terms of demographic characteristics and academic background. However, it is possible that FRC participants differ from comparison students on some unmeasured characteristics, such as motivation, that could affect their outcomes. As such, the opportunity to use a matched comparison group provides a much higher degree of control than comparisons to the student population at large, but the absence of a full set of baseline controls needs to be recognized.
The other key issue involved in using an existing database like BPS is that of the timing of the data collection. In this instance, the BPS dataset includes students who began college in 1995-96 (the most recent year for which this type of comparison data was available); the FRC students generally graduated high school several years later (1999-2003). While there is nothing to suggest that the trends in key college outcomes (majors, etc.) changed significantly during that time period, it is important to recognize that the “match” between participants and the national
More than Robots Evaluation of the First Robotics Competition April 2005
Center for Youth and Communities, Brandeis University 12
college internships and grants, as well as several measures of community involvement and personal goals. While the BPS data could not provide a match for every measure of interest for FIRST (for example, all students in the BPS dataset attended college, so the data could not be used to assess relative levels of college-going), it did make it possible to construct a matched comparison for a number of core outcomes for FIRST.
Table 1-1 provides a list of the variables that were used in creating the matched comparison group for this study. To accomplish that, the respondents to the FRC survey were matched to students with similar demographic and academic backgrounds in the BPS dataset through a process known as “propensity score matching.” Under that procedure, a single, summary “propensity score” was created for each FRC survey respondent and each student in the BPS dataset based on the demographic and academic measures listed in Table 1-1. That score was then used to match each FRC respondent to an individual in the BPS dataset with the same or closest available propensity score.4 In the end, usable matches could be made for 147 FRC participants and an equal number of students from the BPS dataset. That group of 294 cases was used for the comparative analysis.5
Table 1-1: Variables Used in Creating the Matched Comparison Group
Demographic Background Measures High School Academic Background Measures
Race (White/Non-White)
Gender (Male/Female)
English as a second language
Parent’s education (whether at least one parent attended college)
Economic status of the high school (percent of students eligible for free/reduced cost lunches)
Whether students had taken following courses:
honors math class
one honors science class
at least one math class (from a list that included Algebra 1 and 2, Trigonometry, Geometry, Calculus, etc.)
at least one science class (from a list that included Biology, Chemistry, Physics, etc.)
Participant Outcomes Analysis. Given the availability of a matched comparison group for the analysis of some, but not all of the outcomes in the study, the participant outcome analyses in Chapters 3 and 4 looks at participant outcomes in three ways:
Participant perspectives. Chapter 3 focuses on the participants’ own assessments of the quality of their program experience and the impact of the program on their interests and
4 Propensity scores have become a widely used method of creating matched samples and/or adjusting for differences
in baseline characteristics among samples in evaluation studies. See, for example, the recently released evaluation of the national AmeriCorps program, Abt Associates, Inc., Serving Country and Community: A Longitudinal Study of Service in AmeriCorps (Washington, D.C.: Corporation for National and Community Service, December 2004). A number of scholars, however, have highlighted the limits of propensity score matching, reminding users that propensity scores cannot adjust for unobserved or unmeasured differences between groups. A recent paper by Roberto Agodini and Mark Dynarski reinforces that point and argues caution in using propensity scores in place of more traditional, random assignment approaches. See Robert Agodini and Mark Dynarski, “Are Experiments the Only Option? A Look at Dropout Prevention Programs,” Mathematica Policy Research, August 2001. Available at
www.mathematica-mpr.com/publications/PDFs/experonly.pdf.
5 Approximately 26 FRC students were dropped from the matching process because of missing data for one or more
of the matching variables. It is worth noting that a number of other variables were considered for use in the matching process, including SAT/ACT scores and participation in specific academic classes, such as Physics or Calculus. However, in each case, missing data on those variables from the FRC cases would have reduced the size of the sample too much to work with.
More than Robots Evaluation of the First Robotics Competition April 2005
Center for Youth and Communities, Brandeis University 13
skills, based on participant responses to questions on the FRC survey.
Comparisons to National Averages. The first part of Chapter 4 then looks at a variety of more objective career, education, and developmental outcomes, including measures of college-going, college major, and educational aspirations, and where possible, compares them to available national averages for all students or for students in appropriate
demographic groups (race and gender). In this instance, the national data provide one useful benchmark for interpreting the FRC results, comparing outcome for FRC alumni to all students. However, it is important to recognize that this is a relatively rough comparison since the national averages include a wide range of students, including those with different socioeconomic and academic backgrounds. As such, they are not as accurate a comparison as a matched comparison group, but for a number of measures, they are the best point of comparison available.
Matched Comparison Group Analysis. The second part of Chapter 4 then examines a smaller set of career, education, and developmental outcomes in comparison to those of the matched comparison group to assess the relative impact of the program. While all three types of analysis (participant perspectives, national averages, and matched comparison group) provide useful data for assessing the impact of the program, this matched comparison group analysis provides the most rigorous and reliable assessment of the impact of FRC on the students in the study.
Site Visit Interviews. The other major element of the study was a series of site visits to
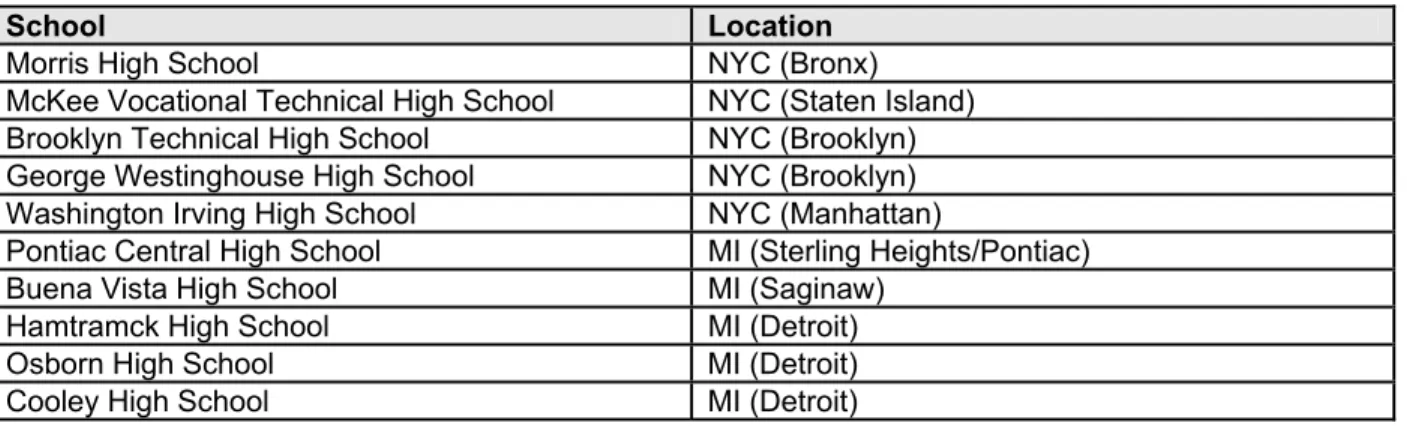
approximately 10 FIRST teams in New York and the Detroit/Pontiac metropolitan areas (Table 1-2 lists the schools visited). Site visits generally lasted up to a day in length and included interviews with team leaders, school administrators, mentors, and students. Major topics for the site visits included the following:
Team operations and best practices FRC impact on the schools
Impacts on team leaders
Mentor roles and impacts on mentors and the sponsoring organizations
In each case, the goal of the site visit was to help better understand the context in which the FIRST Robotics Competition took place and to determine whether involvement in FRC had impacts beyond those on the participating youth.
More than Robots Evaluation of the First Robotics Competition April 2005
Center for Youth and Communities, Brandeis University 14
Table 1-2: Site Visit Locations
School Location
Morris High School NYC (Bronx) McKee Vocational Technical High School NYC (Staten Island) Brooklyn Technical High School NYC (Brooklyn) George Westinghouse High School NYC (Brooklyn) Washington Irving High School NYC (Manhattan)
Pontiac Central High School MI (Sterling Heights/Pontiac) Buena Vista High School MI (Saginaw)
Hamtramck High School MI (Detroit) Osborn High School MI (Detroit) Cooley High School MI (Detroit)
More than Robots Evaluation of the First Robotics Competition April 2005
Center for Youth and Communities, Brandeis University 15
C
HAPTERT
WOP
ARTICIPANTS IN THEFRC
S
TUDYS
AMPLEOne of the key goals for this study was to document the impact of the FIRST Robotics Competition on students from schools serving predominantly low income and minority communities. This reflected the desire on the part of FIRST to expand the program in those communities and to involve more low income and minority young people in the program. As such, an assessment of the effectiveness of the program in those underserved schools, as well as others, was seen as an important element in the program’s growth. As a result of this, the design for the study called for the evaluation to focus on schools with substantial numbers of students who were low income and/or minority and to do so by drawing its sample from teams in major metropolitan areas.
To accomplish this, approximately 35 teams from New York City, the Detroit/Pontiac metropolitan area, and the San Jose/San Francisco Bay area were invited to participate in the study. The teams included in the original sample included all of the teams in each area that had been in operation for two or more years, and most reported relatively high proportions of low income or minority students. Ultimately, fourteen teams, primarily from the Michigan and New York areas agreed to participate in the study and were able to provide contact information for past participants in the FRC program. The teams that declined to participate generally did so either because the school was no longer actively involved in FIRST or because the team could not provide any information on former participants.
CHARACTERISTICS OF SCHOOLS IN THE STUDY
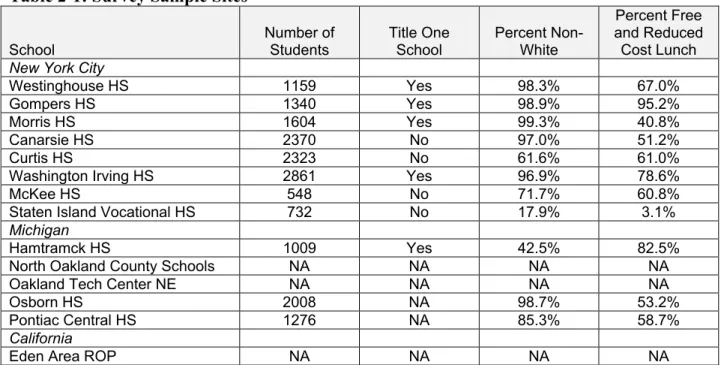
Table 2-1 provides an overview of the demographic characteristics of the schools involved in the study, based on data from the U.S. Department of Education, National Center for Educational Statistics database. In large part, the teams in the study met the criteria that they be located in schools serving large percentages of low income or minority students. Of the sites with available school-wide data, nine of eleven had more than 60% non-white students, and 6 were over 95% non-white. Nine of eleven schools with available data had more than 50% of their students eligible for the federal free and reduced price lunch program, a widely used indicator for services to low income families. 6 At least a third of the schools were also Title I eligible, another
benchmark indicating high proportions of low income and/or educationally disadvantaged students.
6 Federal guidelines provide that students in families with incomes below 130% of the federal poverty level qualify
for the federal free lunch program; students in families with an income below 185% of the poverty rate qualify for the reduced cost lunch program. Data on race and ethnicity and free lunch status were not available for three teams/schools. The Eden Area Regional Occupational Program (Alameda County, CA) and Oakland (Michigan) Northeast Tech Center are regional technical schools that draw students from a variety of area schools, and the North Oakland County (Michigan) schools team drew students from a consortium of schools.
More than Robots Evaluation of the First Robotics Competition April 2005
Center for Youth and Communities, Brandeis University 16
Table 2-1: Survey Sample Sites
School Number of Students Title One School Percent Non-White
Percent Free and Reduced Cost Lunch
New York City
Westinghouse HS 1159 Yes 98.3% 67.0%
Gompers HS 1340 Yes 98.9% 95.2%
Morris HS 1604 Yes 99.3% 40.8%
Canarsie HS 2370 No 97.0% 51.2%
Curtis HS 2323 No 61.6% 61.0%
Washington Irving HS 2861 Yes 96.9% 78.6%
McKee HS 548 No 71.7% 60.8%
Staten Island Vocational HS 732 No 17.9% 3.1%
Michigan
Hamtramck HS 1009 Yes 42.5% 82.5%
North Oakland County Schools NA NA NA NA Oakland Tech Center NE NA NA NA NA
Osborn HS 2008 NA 98.7% 53.2%
Pontiac Central HS 1276 NA 85.3% 58.7%
California
Eden Area ROP NA NA NA NA
Note: Data from the National Center on Educational Statistics, U.S. Department of Education, Common Core of Data, 2002-2003, available on the NCES website: http://nces.ed.gov. Additional data on New York City schools drawn from individual school “Report Card” data available at http://www.nycenet.edu. NA indicates data not available.
PARTICIPANT CHARACTERISTICS
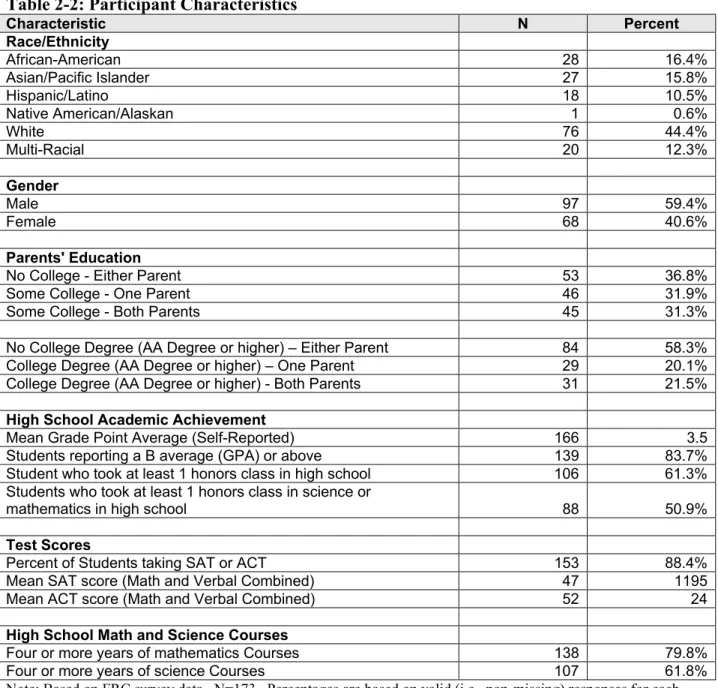
The FIRST participants who responded to the survey also meet the study criteria, representing a diverse group that includes a substantial proportion of minority students, women, and young people from families with a limited educational background. As Table 2-2 shows:
The team members who responded to the survey were a racially and ethnically diverse group: overall 44% of the survey respondents were white, and 56% were African-American, Asian, Hispanic, Native American, or multi-racial.
Fifty-nine percent of the respondents were male, 41% female.
Thirty-seven percent of the respondents came from families where neither parent had attended college, including 2-year or community college; another 32% came from families where only one parent attended college. Looking at the data another way, less than one quarter (22%) of the team members came from families where both parents graduated from a two or four-year college.
At the same time, the FIRST participants in the study were also largely successful students in high school. According to the grades and test scores they reported on the survey, the average team member in the study had a high school Grade Point Average of 3.5 (roughly a B+) and more than 80% reported a ‘B’ average or above for their high school years. Sixty one percent of the students took at least one honors course in high school, and slightly more than half (51%) of all students in the sample took an honors course in math or science.
More than Robots Evaluation of the First Robotics Competition April 2005
Center for Youth and Communities, Brandeis University 17
Table 2-2: Participant Characteristics
Characteristic N Percent
Race/Ethnicity
African-American 28 16.4%
Asian/Pacific Islander 27 15.8%
Hispanic/Latino 18 10.5%
Native American/Alaskan 1 0.6%
White 76 44.4%
Multi-Racial 20 12.3%
Gender
Male 97 59.4%
Female 68 40.6%
Parents' Education
No College - Either Parent 53 36.8%
Some College - One Parent 46 31.9%
Some College - Both Parents 45 31.3%
No College Degree (AA Degree or higher) – Either Parent 84 58.3% College Degree (AA Degree or higher) – One Parent 29 20.1% College Degree (AA Degree or higher) - Both Parents 31 21.5%
High School Academic Achievement
Mean Grade Point Average (Self-Reported) 166 3.5 Students reporting a B average (GPA) or above 139 83.7% Student who took at least 1 honors class in high school 106 61.3% Students who took at least 1 honors class in science or
mathematics in high school 88 50.9%
Test Scores
Percent of Students taking SAT or ACT 153 88.4% Mean SAT score (Math and Verbal Combined) 47 1195 Mean ACT score (Math and Verbal Combined) 52 24
High School Math and Science Courses
Four or more years of mathematics Courses 138 79.8% Four or more years of science Courses 107 61.8% Note: Based on FRC survey data. N=173. Percentages are based on valid (i.e., non-missing) responses for each item.
SAT and ACT participation was also high, as were the average scores among those who reported them. Nearly 90% of the team members in the survey reported taking the SAT or ACT exams, reflecting a high degree of interest and intention in going to college. Among those who reported SAT scores, the average score was 1195 for combined verbal and math (out of a possible 1600);
More than Robots Evaluation of the First Robotics Competition April 2005
Center for Youth and Communities, Brandeis University 18
on the ACT the average scores was 24 out of a possible 36.7 In both cases, students in the sample scored well above the national averages for the SAT test (1026) and for the ACT (20.9).8 Finally, a high proportion of students in the survey reported taking math and science classes throughout high school. Overall, 80% of the team members took a full four years of math
classes and 62% took four years of science. In both cases, these figures were roughly 10% above the national averages for college-oriented students.9
In sum, the team members in the study represent, on average, a group of relatively high achievers in high school, but they also represent a diverse set of backgrounds, including a high proportion of students from underserved schools and from families where neither parent was a college graduate. That mix of characteristics sets an important context for understanding the post-high school careers of the FIRST alumni.
One of the questions that cannot be answered here (because we do not know about students’ academic performance before involvement in FIRST) is the relationship between student
achievement in high school and involvement in the FIRST Robotics Competition. Were students motivated to a higher level of achievement in high school as a result of participation in FIRST, or did FIRST tend to attract and admit students who already had a record of high achievement, or something between? The interviews conducted during the site visits for this study suggest that the students in FIRST represented a mix of backgrounds, interests, and capabilities – not just students who were each schools’ high achievers. In a number of sites, team leaders did establish a set of minimum grade requirements for participation in the program (similar to the requirement for a passing grade to participate in varsity sports). In some cases, those requirements may have created a barrier to participation by lower achieving students. In other cases, engagement in FIRST, reinforced by those requirements, may have helped to motivate students to do well in school in order to stay on the team. In still other cases, FIRST may have provided an outlet or a new challenge for students who were already successful in school. Future studies may help sort out these mechanisms more clearly. In the meantime, the survey results reported here suggest that for most of the students in FIRST, the longer-term results of the FRC connection were positive.
7 It is worth noting that only half of those who reported taking the SAT or ACT exams also reported their total score
on the survey. As such, the average scores need to be treated with some caution. However, even assuming some degree of upward bias in the reporting, the test scores suggest that the FIRST participants in the sample represented a group of students with a solid academic background.
8 National averages are for 2004. See The College Board. 2004 College Bound Seniors; A Profile of SAT Program
Test Takers (2004) and “Average ACT Scores by State: 2004 ACT-Tested Graduates” on the ACT website:
http://www.act.org/news/data/04/states.html.
9 National averages are based on data for high school seniors who took the SAT in 2004. See College Board,
College Bound Seniors: A Profile of SAT Program Test-Takers (2004). Nationally 71% of SAT-takers in 2004 reported four or more years of mathematics in high school; 52% reported four or more years of science.
More than Robots Evaluation of the First Robotics Competition April 2005
Center for Youth and Communities, Brandeis University 19
C
HAPTERT
HREET
HEFIRST
E
XPERIENCE–
T
EAMM
EMBERS’
P
ERSPECTIVESRegardless of background, for the young people in the study, FIRST provided a positive experience that gave them an opportunity to be involved in a team activity, build relationships, learn new skills and gain a new understanding of and interest in science and technology. Based on the survey responses, FIRST provided many participants with the kinds of experiences that are considered important to effective youth development (detailed later), and for a substantial number of alumni, was seen as one of the most influential experiences in their high school careers.
INVOLVEMENT IN FIRSTACTIVITIES
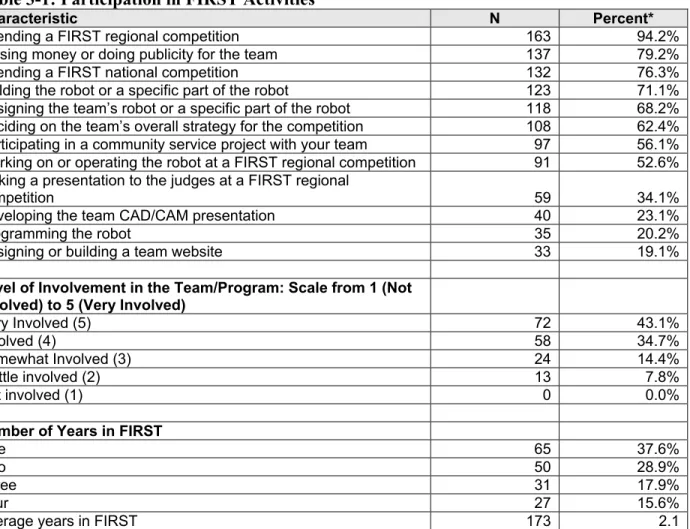
According to the team members’ surveys, the FIRST experience varied widely from participant to participant, both in terms of the level of overall involvement in the program and the specific tasks that team members were involved in during their time on the team. On average, team members in the study were involved in FIRST for two years, most commonly during their junior and senior years in high school (Table 3-1). During those years, students varied widely in the types of activities in which they were involved. The most common activity, reported by over 90% of the survey respondents, was attending a FIRST regional event. Apparently, even for teams in lower income communities (where travel funds might be limited), most team members had an opportunity to directly experience an FRC regional competition.
However, there was considerable variation in the degree of participation in the team members’ other activities:
Roughly 60% to 70% of the team members reported involvement in the core team activities of deciding on the overall team strategy (62%), designing the robot or a specific part (68%) and building the robot or a part of the robot (71%).
Involvement in more specialized tasks, or direct involvement in the Competition activities, was generally lower. Only 20% of the team members reported involvement in programming the robot; 53% reported working on or operating the robot at the competition; and 34% reported making a presentation to the judges at the
competition. Similarly, the percentage of team members involved in preparing a computer animation (23%) or in building a team website (19%) were relatively small. Finally, more than half of the team members reported participating in what might be
characterized as team-related activities. Specifically, most alumni reported being involved in raising money or promotional activities for the team (79%); a smaller but still substantial proportion (56%) participated in team community service activities.
More than Robots Evaluation of the First Robotics Competition April 2005
Center for Youth and Communities, Brandeis University 20
Table 3-1: Participation in FIRST Activities
Characteristic N Percent*
Attending a FIRST regional competition 163 94.2% Raising money or doing publicity for the team 137 79.2% Attending a FIRST national competition 132 76.3% Building the robot or a specific part of the robot 123 71.1% Designing the team’s robot or a specific part of the robot 118 68.2% Deciding on the team’s overall strategy for the competition 108 62.4% Participating in a community service project with your team 97 56.1% Working on or operating the robot at a FIRST regional competition 91 52.6% Making a presentation to the judges at a FIRST regional
competition 59 34.1%
Developing the team CAD/CAM presentation 40 23.1%
Programming the robot 35 20.2%
Designing or building a team website 33 19.1%
Level of Involvement in the Team/Program: Scale from 1 (Not Involved) to 5 (Very Involved)
Very Involved (5) 72 43.1%
Involved (4) 58 34.7%
Somewhat Involved (3) 24 14.4%
A little involved (2) 13 7.8%
Not involved (1) 0 0.0%
Number of Years in FIRST
One 65 37.6%
Two 50 28.9%
Three 31 17.9%
Four 27 15.6%
Average years in FIRST 173 2.1
Note: Based on FRC survey data. N=173. Percentages are based on valid (i.e., non-missing) responses for each item. * Percent of respondents who indicated involvement in the specified activity in at least one year in high school.
Much of the variation in program involvement likely reflects the division of labor that takes place on many teams as team members are split off into groups focused on designing, building, programming, or operating the robots, or in pursuing other team components like the website. However, despite the variations, most team members saw themselves as actively involved in the program. When asked to assess their overall involvement, 78% had rated their level of
involvement as a 4 or 5 on a scale of 1 to 5, with 5 indicating “very involved.” Forty-three percent had checked off the top level of involvement on their surveys.
QUALITY OF THE FIRSTEXPERIENCE
For most participants, FIRST was also a fun and engaging experience that provided opportunities to take on real responsibilities, work as a team, and gain a sense of belonging. These aspects of FIRST are particularly important because they parallel the types of experiences that research has indicated are associated with effective youth development programs. According to the National
More than Robots Evaluation of the First Robotics Competition April 2005
Center for Youth and Communities, Brandeis University 21
Research Council’s recent report, Community Programs to Promote Youth Development, effective programs provide young people with some or all of the following characteristics:10
A safe environment (a physically and socially safe setting) Appropriate structure (clear rules and expectations) Supportive relationships (caring, support, guidance) Opportunities to belong
Positive social norms (including obligations for service)
Support for efficacy and mattering (youth decision-making, making a real difference, responsibility and challenges)
Opportunities for skill building
Integration of family, school and community.
Based on the alumni surveys, FIRST was seen by participants as providing many of these types of experiences (Table 3-2):
Alumni felt that FIRST involved them in real and challenging tasks. Seventy-four percent reported that students made the important decisions, 89% indicated that they had ‘real responsibilities,” and 76% reported that they had a chance to play a leadership role on the team.
Most felt they had a chance to do a variety of tasks (87%) and to learn new skills while on the team (94%).
FIRST also gave students a chance to belong and to experience supportive relationships with caring adults: 95% reported getting to know an adult very well and 91% indicated they felt they learned a lot from the adults on the team. Ninety-one percent felt that they “really belonged on the team.”
Finally, FIRST provided an opportunity to enjoy working as a team (96% reported having fun) and to experience a sense of competency and success: 92% reported almost always feeling like they had a chance to win.
The only finding of concern in this context is that 50% of the alumni reported that the adults on the team did most of the difficult jobs involved in building the robot.11 This is always a concern in this kind of competitive environment, and one that requires a balance between the desire to win on all sides and the need to provide team members with a hands-on, empowering experience. One area FIRST may want to continue to work on is in providing guidance to team leaders and
10 See Jacquelynne Eccles and Jennifer Appleton Gootman, Editors, Community Programs to Promote Youth
Development (National Research Council and Institute of Medicine, 2002).
11 This issue was also identified by survey respondents in responses to an open-ended question about what they like
least about FIRST. Twenty two of the 133 responses to that question (17%) mentioned issues with adults working with the team. The most common of these concerned adults “hoarding” the design and construction process, not enough hands-on work for students, or adults who were overly-concerned with winning. Other concerns raised included team conflicts, problems raising funding, the short build season, etc., with each category mentioned by roughly 5-12 of the respondents. Responses to the open-ended questions are discussed in more detail later in this chapter.
More than Robots Evaluation of the First Robotics Competition April 2005
Center for Youth and Communities, Brandeis University 22
mentors on appropriate roles for adults and how best to support team members while allowing them to do more of the work on the Competition.
Table 3-2: Quality of the FIRST Experience
Characteristic N Percent*
I had fun working on the FRC team. 164 95.9% I had a chance to get to know at least one of the adults on my
team very well. 163 95.3%
I learned new skills while working on the team. 161 94.2% I almost always felt that my team had a good chance to win
something at the regional competition. 157 91.8% I felt like I learned a lot from the adults on my team. 157 91.0% I felt like I really belonged on my team. 155 90.6% I had real responsibilities on my team. 153 89.0% I had a chance to do lots of different jobs on my team. 150 87.2% I had a chance to play a leadership role on my team. 131 76.2% Students on my team made the important decisions, not the adults. 127 73.8% The adults on my team did most of the difficult jobs in building the
robot. 86 50.0%
Note: Based on FRC survey data. N=173. Percentages are based on valid (i.e., non-missing) responses for each item. * Percent of respondents who “agreed” or “strongly agreed” with the statement.
IMPACTS ON KNOWLEDGE AND BEHAVIOR
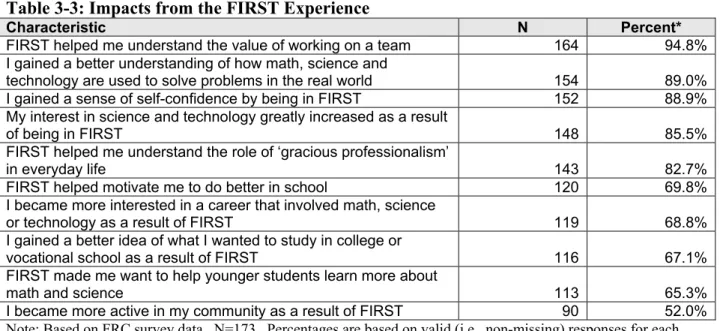
FIRST participants also reported a variety of positive impacts from their participation in the program, ranging from an increase in self-confidence to a better understanding of math and science and an increased interest in math, science or technology careers (Table 3-3). According to the surveys, FIRST helped young participants:
Increase their understanding of the value of teamwork (95%) and of the role of ‘gracious professionalism’ in everyday life (83%).
Increase their understanding of the role of science and technology in everyday life (89%), their interest in science and technology generally (86%), and their interest in science and technology careers (69%)
Increase their sense of self-confidence (89%) and their motivation to do well in school (70%).
Finally, FIRST also helped to increase participants’ interest in serving others, with 65% of participants reporting that they wanted to help younger students learn about math and science, and with more than half (52%) reporting that, as a result of FIRST, they had become more active in their community.
More than Robots Evaluation of the First Robotics Competition April 2005
Center for Youth and Communities, Brandeis University 23
Table 3-3: Impacts from the FIRST Experience
Characteristic N Percent*
FIRST helped me understand the value of working on a team 164 94.8% I gained a better understanding of how math, science and
technology are used to solve problems in the real world 154 89.0% I gained a sense of self-confidence by being in FIRST 152 88.9% My interest in science and technology greatly increased as a result
of being in FIRST 148 85.5%
FIRST helped me understand the role of ‘gracious professionalism’
in everyday life 143 82.7%
FIRST helped motivate me to do better in school 120 69.8% I became more interested in a career that involved math, science
or technology as a result of FIRST 119 68.8% I gained a better idea of what I wanted to study in college or
vocational school as a result of FIRST 116 67.1% FIRST made me want to help younger students learn more about
math and science 113 65.3%
I became more active in my community as a result of FIRST 90 52.0% Note: Based on FRC survey data. N=173. Percentages are based on valid (i.e., non-missing) responses for each item. * Percent of respondents who “agreed” or “strongly agreed” with the statement.
IMPACTS ON PARTICIPANT SKILLS
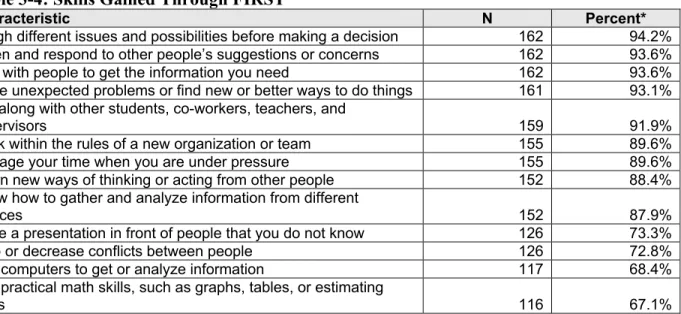
The large majority of participants also reported that FIRST had helped them gain a variety of communications, interpersonal, and problem-solving skills. Overall, more than two-thirds of the participants (and in most cases well over 80%) reported that FIRST had helped them “a lot” (the highest response category) in learning a wide variety of skills (Table 3-4):
More than 90% reported learning important communications skills, such as how to listen and respond to other people’s suggestions (94%) and how to talk with people to get information you need (94%). A smaller, but still substantial percentage (73%) reported learning how to make a presentation in front of people they did not know.
Students also learned teamwork and interpersonal skills. Ninety-two percent reported learning how to get along with other students, co-workers, teachers and supervisors; 90% learned to work within the rules of a new organization or team; 88% reported learning new ways of thinking and acting from others; and 73% learned ways to stop or decrease conflicts between people.
Students learned problem-solving and time management skills as well. Students reported learning how to solve unexpected problems or how to find new or better ways of doing things (93%); how to manage their time under pressure (90%); how to weigh issues and options before making decisions (94%); and how to gather and analyze information (88%).
Finally, students also learned to apply traditional academic skills in real-world settings: 68% reported learning how to use computers to retrieve and analyze data, and 67% reported learning about using practical math skills such as using graphs and tables or estimating costs.