Is there a Dark Side to Incentive Compensation?
*DAVID J. DENIS
Krannert Graduate School of Management Purdue University
West Lafayette, IN 47907-1310 [email protected]
PAUL HANOUNA
Krannert Graduate School of Management Purdue University
West Lafayette, IN 47907-1310 [email protected]
ATULYA SARIN
Leavey School of Business Santa Clara University Santa Clara, CA 95053
March, 2005
* The authors are grateful for helpful comments received from an anonymous referee, Diane Denis, Stu
Gillan (the editor), Randall Thomas and participants in the Law and Business Workshop at Vanderbilt University.
Is there a Dark Side to Incentive Compensation?
Abstract
We report a significant positive association between the likelihood of securities fraud allegations and a measure of executive stock option incentives. This relation is robust to the inclusion of other components of the compensation structure and to other possible determinants of fraud allegations. In addition, we find that the positive relation between the likelihood of fraud allegations and option intensity is stronger in firms with higher outside blockholder and higher institutional ownership. These findings support the view that stock options increase the incentive to engage in fraudulent activity, and that this incentive is exacerbated by institutional and block ownership.
Is there a Dark Side to Incentive Compensation?
1. Introduction
Equity-based compensation, primarily in the form of executive stock options, has become increasingly common among U.S. top executives in recent years. Using data derived from Hall and Liebman (1998) and Hall and Murphy (2002), Hall (2003) reports that in 1984, fewer than half of the CEOs of publicly traded U.S. corporations were granted stock or stock options in a given year and equity-based compensation comprised less than one percent of total CEO pay for the median company. By 2001, equity-based compensation accounted for approximately two-thirds of total pay for the median firm. Furthermore, data reported in Murphy (1999) and Core and Guay (2002) indicate that by the late 1990s, changes in the value of executive stock and stock options were as much as fifty times as large as annual changes in cash compensation.
The growth in the use of stock options in executive compensation has become increasingly controversial in recent years. Proponents argue that because options link the compensation of CEOs with changes in shareholder wealth, options increase shareholder wealth by reducing agency problems. Detractors argue, however, that (i) the convexity of options gives managers the incentive to take excessive risk, (ii) the usefulness of stock options as incentive devices is mitigated by their limited downside risk and the tendency of companies to “reprice” underwater options, and (iii) they give managers the incentive
to fraudulently manipulate the company’s stock price in order to enhance the value of the options.1
We contribute to this debate by empirically examining the association between the likelihood of fraud allegations and the firm’s compensation structure. Specifically, we examine whether the likelihood of a fraud allegation is related to the option intensity of the chief executive officer’s (CEO’s) compensation, where option intensity is defined as the sensitivity of the value of the executive’s stock option portfolio to changes in the firm’s stock price.
A related issue is whether the association between fraud and option intensity depends on other characteristics of the firm’s governance structure, such as the proportion of independent outsiders on the board of directors and whether the firm has large institutions and blockholders among the company’s shareholders. We hypothesize that the expected payoffs to managers from commiting fraud are higher in firms with high institutional holdings and in those with large blockholders because there is a greater likelihood that managers in these firms will be dismissed if firm performance is poor. Consequently, the association between fraud likelihood and option intensity will be stronger in firms with large blockholdings and higher institutional shareholdings. By contrast, we hypothesize that monitoring by outside directors is likely to increase the likelihood of fraud detection, thereby reducing the probability of fraud occurring. Consequently, the association between fraud likelihood and option intensity will be lower in firms with a high proportion of independent outside directors.
1 For example, see Alan Greenspan’s testimony before the Senate Committee on Banking, Housing and
Urban Affairs, July 16, 2002 and “Economist Group Seeks Repeal of Executive Pay Curb.” Wall Street
Our sample consists of 358 companies in which there is an allegation of fraud between 1993 and 2002 and for which there is compensation data available on Compustat’s ExecuComp database. Over 90% of the fraud allegations allege “material misrepresentations” or misstated financial results. To limit the costs of hand-collecting data on board composition and blockholders, we match sample companies to peers (based on industry and size) for which there was no allegation of fraud over the same time period.
We find that CEOs of fraud firms have greater option-based compensation than their control firms, where option-based compensation is measured by the option intensity measure described above. In logistic regressions, the likelihood of fraud is positively related to option intensity. This result continues to hold if we control for other possible determinants of fraud, for other components of compensation, and if we control for other determinants of compensation structure in a two-stage procedure. In addition, the positive association between option intensity and fraud allegations is robust if we test the association using the ExecuComp universe rather than our matching procedure, and if we employ an alternative measure of option intensity.
We also find that the strength of the association between the likelihood of fraud and option intensity depends on characteristics of the firm’s equity ownership structure. Specifically, we report that the positive relation between option intensity and the likelihood of fraud is significantly greater for firms with higher blockholder and institutional ownership. However, there is no evidence that the strength of the relation between option intensity and fraud likelihood depends on the fraction of independent outsiders on the board of directors.
We interpret our findings as being consistent with the view that there is a “dark side” to incentive compensation. That is, because increases in equity-based compensation increase the incentive for CEOs to maximize the company’s stock price, the CEO has greater incentive to engage in fraudulent activities in order to accomplish this objective. This incentive appears to be exacerbated by institutional and block equity owners, possibly because these owners exert additional pressure on the firms to meet earnings targets.
We caution that our findings should not be interpreted as an overall indictment of the use of equity incentives in executive compensation plans. As we point out in Section 2, a substantial body of research supports the view that equity-based compensation provides top executives with financial incentives to increase the intrinsic value of their firm’s shares. Our findings imply that these benefits of equity-based compensation must be balanced against the potential costs of increasing the incentive to commit fraud.
Several other recent studies examine the incentive to misstate or misrepresent corporate earnings. Beneish (1999) studies 64 firms that are the targets of SEC enforcement actions. He finds that relative to a control sample, CEOs of firms that overstate earnings are more likely to redeem stock appreciation rights during the period in which earnings are overstated. Johnson, Ryan, and Tian (2003) examine a sample of 43 cases of corporate fraud. Like us, they find that fraud firms have significantly greater equity-based compensation than do executives at industry and size-matched control firms. Peng and Roell (2003) also find a significant association between options pay and the likelihood of litigation. However, their focus is on the link between option incentives and discretionary accruals. Finally, Burns and Kedia (2004) examine the association
between accounting restatements and components of the chief executive’s compensation package. Their focus is on the differences in the incentive to misstate earnings between options and other components of the compensation package, such as salary and bonus, long-term incentive plans, restricted stock, and equity ownership. Our study complements and extends these prior studies by (i) examining a large sample of fraud allegations, (ii) by controlling for other determinants of compensation structure, and (iii) by examining the role of other attributes of governance structure.
The remainder of the paper is organized as follows. In Section 2, we develop testable hypotheses for the relation between fraud likelihood and compensation structure. We also discuss possible roles for board structure and ownership structure in determining the strength of the relation between fraud likelihood and CEO compensation structure. In Section 3, we describe our sample selection procedure and report descriptive statistics for the sample and control firms. Sections 4 and 5 report our empirical results and Section 6 concludes.
2. Hypothesis Development and Relation to Prior Literature
Our empirical tests are motivated by a framework in which executives choose to commit fraud when the expected payoffs from the fraud exceed the expected costs associated with detection of the fraud. These expected costs in turn depend on the product of the probability of detection and the costs incurred by the executive conditional on detection. The conditional costs of detection depend on the legal environment (i.e. anti-fraud laws and their enforcement) and ex post settling up in the managerial labor market. We assume that these costs are constant across firms and are, therefore,
independent of the firm’s compensation, board, and ownership structures.2 Consequently, our tests focus on those factors that potentially influence the expected payoff from fraud and the probability of detection. We hypothesize that the expected payoffs are affected by compensation structure and equity ownership structure, while the probability of detection is affected by the composition of the board of directors.
2.1. Expected payoffs from fraud
Equity-based compensation provides executives with the financial incentive to increase the company’s stock price. This can be accomplished either through increasing the intrinsic value of the company’s shares, through manipulating the market’s perception of the value of the shares through fraudulent activity, or both. We focus our discussion and subsequent tests on option compensation for two reasons. First, as noted in the Introduction, stock options are the dominant form of equity-based compensation in U.S. firms and are at the center of most of the controversy over executive pay. Second, as articulated in Burns and Kedia (2004), options provide different incentives than do other forms of compensation due to the convexity of their payoffs and the lack of control implications from their sale. Our subsequent tests do, however, control for other elements of the compensation structure.
A substantial body of prior work documents the incentive benefits of stock options. Yermack (1995) and Mehran (1995) report that firm performance (as measured
2 While it seems reasonable to assume that the legal environment is constant across firms, one might argue
that the conditional costs of detection depend on the firm’s ownership structure and board composition. For example, perhaps managers committing fraud are more likely to be fired if the fraud is detected in firms with larger proportions of outside directors and higher percentages of blockholder or institutional ownership. If so, this introduces noise into some of our subsequent tests. In particular, it will be less likely that we find evidence that the strength of association between fraud and option intensity depends on the firm’s equity ownership structure.
by Tobin’s q ratio) is positively correlated with stock option grants. Frye (1999) also finds evidence that employee stock options result in firms having a higher Tobin’s Q. Hillgeist (2003) reports evidence that firms with unexpectedly high levels of options incentives exhibit significantly higher levels of firm performance.
More recently, several studies report a link between executive compensation and accounting choices. For example, Gaver, Gaver, and Austin (1995), Healy (1985), and Holthausen, Larcker, and Sloan (1995) study the effect of annual bonus plans on the shifting of income through time. Bergstresser and Philippon (2002) and Gao and Shrieves (2002) examine the relation between executive compensation structure and earnings management. These studies imply that managerial choices are influenced by compensation structure for reasons other than the incentive to maximize the intrinsic value of the company’s shares.
As the use of stock options increases, the expected payoff from fraud increases. Therefore, ceteris paribus, we expect a positive relation between measures of option incentives and the likelihood of fraud. It is also possible that this sensitivity of fraud to compensation structure is influenced by the firm’s ownership structure. Prior evidence in Denis, Denis, and Sarin (1997) reveals that the sensitivity of top executive turnover to firm performance is stronger in firms with large outside blockholdings. Consequently, managers of poorly performing firms might have a greater incentive to commit fraud in firms with outside blockholdings in order to avoid dismissal. This effect potentially reinforces the compensation effect. That is, in firms with higher option compensation, managers benefit in two ways from fraudulent activity. First, they benefit directly from an increase in their compensation. Second, they benefit indirectly by lowering the
probability of dismissal. In firms with low equity-based compensation, managers retain the indirect benefits of fraud, but the direct benefits are lower. This discussion implies that the positive relation between the sensitivity of fraud and equity-based compensation is stronger in firms with large outside blockholdings.
Similar predictions can be made regarding institutional ownership. It is often alleged that institutional investors overreact to negative earnings news and, therefore, force managers to be overly concerned about short-term earnings [see Colvin (1998)]. Consistent with this view, Hotchkiss and Strickland (2003) report that the market reaction to negative earnings announcements is stronger in firms with greater institutional ownership. If negative earnings news is more likely to result in large stock price declines in firms with higher institutional ownership, managers have greater incentive to commit fraud in these firms in order to avoid the possible labor market penalties associated with a stock price decline. Again, this effect is likely to reinforce the financial incentives from equity-based compensation. Thus, we hypothesize that the positive relation between the sensitivity of fraud and option compensation is stronger in firms with larger institutional holdings.
Studies by Bethel, Liebeskind, and Opler (1998) and Hartzell and Starks (2003) report evidence consistent with the view that blockholders and institutions play an important role in limiting agency costs between managers and other investors. Note, however, that although these studies imply that blockholders and institutional investors serve a valuable monitoring role, they do not contradict our hypotheses. Unlike standard examples of agency problems (e.g. shirking, empire building, etc.), the alleged fraudulent activities do not represent activities that transfer wealth from the existing shareholders to
the managers. Rather, all existing shareholders have the potential to benefit from the higher share price that results from the alleged fraudulent activity.
2.2. Probability of detection
The principal monitors of managerial behavior are the board of directors. A substantial body of research has been devoted to studying the effectiveness of board monitoring. For the most part, this literature argues that independent outside directors are more effective monitors of managerial behavior and performance than are inside directors or outside directors that are affiliated with the top management team.3
If independent outsiders are more effective monitors, we expect that the likelihood of fraud detection is greater in firms in which independent outsiders comprise a greater proportion of the board of directors. This increased probability of detection presumably leads to a reduction in the likelihood that fraud is committed in the first place. Consequently, we hypothesize that the positive relation between the sensitivity of fraud and option compensation is weaker in firms with a greater proportion of independent outside directors.
3. Sample Description
Our sample begins with the universe of firms that were the subject of a class action lawsuit identified through the Securities Class Action Alert and the Stanford Securities Class Action Clearinghouse. The Securities Class Action Alert and the Stanford Securities Class Action Clearinghouse provide detailed information regarding
the filing date, class period (i.e. the period over which the alleged fraudulent behavior occurred), nature of the complaint, and settlement terms. Because our source for executive compensation data, ExecuComp, begins in 1993, we limit our sample of class action lawsuits to the post-1992 period. After eliminating multiple complaints for the same firm during the same calendar year, we identify 2,141 unique complaints filed between 1993 and 2003. After further limiting the sample to those firms covered by the ExecuComp database, we are left with 473 firms that are the subject of a class action lawsuit between 1993 and 2002.
Because of the need to hand-collect data on equity ownership and board structure, we match each sample firm with a control firm that is not the subject of a class action lawsuit. These control firms are obtained by first identifying all firms in ExecuComp having the same four-digit SIC code as the sample (“fraud”) firm. From this set, we select that firm having a market value of equity (measured at the fiscal year end overlapping the litigated firm’s class period) closest in value to that of the sample fraud firm. The market value of the sample firm is measured as of the fiscal year ending just prior to the filing of the class action suit. If the market value of the matched firm is not between 90% and 110% of the market value of the sample firm, we repeat the process, but increase the sample of potential matches by identifying all firms having the same three-digit SIC code. If this does not produce a match, we identify firms with the same two-digit SIC code, then, if necessary, by one-digit SIC code.4
4 As an alternative matching procedure, we require the control firm to have the same 4-digit SIC code, then
choose that control firm that is nearest in market value of equity to that of the sample firm. The results using this alternative procedure are qualitatively identical.
From our original sample of 473 fraud firms, we are unable to identify control firms in 36 cases. Control firms are matched at the 4-digit SIC level in 156 cases, at the 3-digit level in 59 cases, at the 2-digit level in 123 cases, and at the 1-digit level in 99 cases. Finally, we remove 79 firms with complaints pertaining to the allocation of IPO shares or to analyst coverage. IPO allocation complaints generally allege that underwriters engaged in undisclosed practices in connection with the distribution of certain IPO shares. The analyst coverage complaints allege that brokerage firm analysts falsely provided favorable coverage for certain issuers. These complaints taken together do not allege that issuers have engaged in fraud when describing their own business or financial circumstances. Our final sample thus consists of 358 firms facing fraud allegations and 358 firms matched on size and industry for which there are no fraud allegations.
Panel A of Table 1 reports a time profile of the sample. Perhaps not surprisingly, 47% of the sample observations come from the 1999-2001 period. This period corresponds with the dot-com bubble and subsequent market collapse [See Hendershott (2004)]. Outside of these three years, there is no obvious clustering of the data.
Panel B provides details on the nature of the primary alleged fraud in each complaint. Over 90% of the complaints allege either a material misrepresentation (65.7% of the sample) or misstated financial results (25.7% of the sample). Misstated financial results are a special case of material misrepresentation that involve errors in the financial statements (i.e. an inappropriate booking of earnings).5 These categories are clearly
5 As an example of an alleged material misrepresentation that does not involve misstated financial results,
consider the case of JDS Uniphase. According to the complaint, JDS represented to investors that demand for their product was accelerating and that the Company’s only problem was its ability to manufacture enough product.
alleged attempts to fraudulently boost the company’s stock price. Other complaints include breach of fiduciary duties, misstatements in offering prospectus, and complaints related to the adoption of poison pill provisions. These other complaints do not necessarily correspond to alleged attempts to fraudulently manipulate the company’s stock price; however, our findings are not sensitive to the inclusion of these observations in the sample.
Finally, in Panel C of Table 1, we report the frequency of complaints by industry and compare this frequency to that in the ExecuComp universe of firms. The sample lawsuits appear to be disproportionately represented in four industry groups: Computer Programming, Computer and Office Equipment, Drugs, and Communications Equipment.
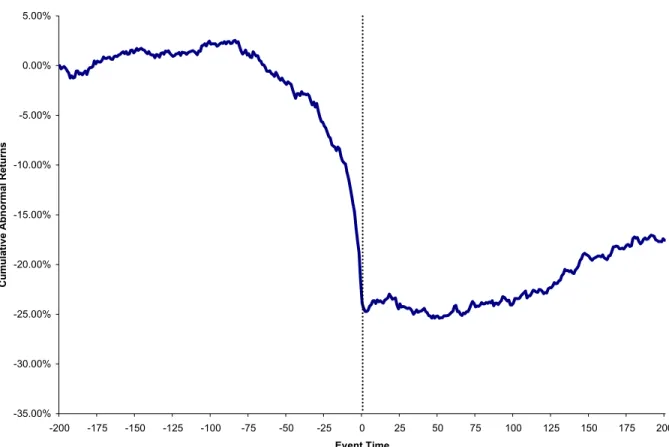
Table 2 reports summary statistics for the duration of the class period and the cumulative abnormal returns (CARs) for the sample firms over the duration of the class period. The CARs are also depicted graphically in event-time in Figure 1. It is evident that the fraud allegations are associated with economically large losses in shareholder wealth. CARs over the period from the beginning to the end of the class period, (on average, 286 days) average -46.22%. Most of these shareholder losses take place in the period immediately surrounding the end of the class period – i.e. the announcement of the fraud allegations. CARs average -25.40% over the six trading days beginning five days prior to the end of the class period.
Table 3 reports summary statistics for selected firm characteristics (Panel A) and selected ownership, board, and CEO characteristics (Panel B) for the sample and control firms. Firm characteristics are obtained from Compustat and ownership, board, and CEO characteristics are obtained from corporate proxy statements. We report means and
medians as well as p-values of pairwise differences between the two sets of firms. All characteristics are measured as of the year ending just prior to the filing of the lawsuit.
The data in Panel A indicate that the sample firms are quite similar to the control firms in size (as measured by market value of equity and total assets), leverage, number of business segments, and ratio of book value to market value. There is some evidence that the sample firms with alleged fraud have lower return on assets. One interpretation of this finding is that the poor operating performance of the sample firms is a motivation for the alleged fraud. However, the difference is statistically significant at only the 0.08 level. Moreover, we find no difference in profitability if it is measured as return on equity.
Similarly, the data reported in Panel B of Table 3 reports few differences between the sample and control firms. In terms of board structure, there are no significant differences in the number of directors, the number of outside directors, or the fractions of affiliated outside, or independent outside directors. The average fraction of inside directors is significantly greater at the 0.05 level for the sample firms than the control firms; however the median difference is statistically insignificant.
In terms of equity ownership structure, we find no significant differences between the sample and control firms in the percentage equity ownership of the CEO, the officers and directors, outside blockholders, affiliated blockholders and institutions. There is also no difference in the proportion of firms in which the company founder is still a member of the top management team. The only significant difference that we find is that mean and median age of the CEO is slightly lower in the firms with the alleged fraud. However, even this difference seems economically small. The median CEO in the
alleged fraud sample is 53 years old, versus 54 years old in the control sample. The bottom line is that the sample and control firms appear to exhibit very similar characteristics.
4. The Relation between Option Incentives and Fraud Allegations
In this section, we examine the association between the use of equity based compensation, primarily stock options, and the likelihood of fraud allegations. Because we are primarily interested in stock option incentives, we begin by describing our summary measure of those incentives. We then report univariate comparisons of compensation structure between the sample and control firms, and estimate logit models that include other possible determinants of fraud allegations and other determinants of compensation structure.
4.1. Measuring option incentives
Our measure of option incentives, labeled “option intensity,” is the change in the value of the executive’s option portfolio from a $1,000 change in the value of the firm’s equity. This measure, originally developed by Jensen and Murphy (1990), captures the degree to which the option portfolio gives the executive the incentive to increase the firm’s stock price. We later test the robustness of our findings to an alternative measure developed by Guay (1999) that measures the change in option compensation for a one percent change in stock price.
A top executive’s portfolio of options consists of options granted in the current year and previously granted options. Previously granted options, in turn, consist of those
options that are vested (i.e. exercisable) and those that are non-vested (i.e. unexercisable). To estimate the option intensity of the portfolio, we first categorize the option portfolio into three components, grants in the current year, exercisable options, and unexercisable options. The intensity of the option portfolio is the sum of sensitivities of each of these three components.
For each of these groups of options, we calculate the intensity using the Black-Scholes [1973] formula for valuing European call options, as modified by Merton (1973) to account for dividends. Specifically, the sensitivity of options is defined as:
(option value) Number of Options Granted
Option Intensity= $1,000
(price) Number of Shares Outstanding ∂
× ×
∂
or,
Number of Options Granted
Option Intensity= ( ) $1,000
Number of Shares Outstanding dT
e− N Z × ×
where Z = [ln(S/X) + T(r - d + σ2/2)]/ST(1/2) ; N is the cumulative probability function for the normal distribution; S is the price of the underlying stock; X is the exercise price of the option; σ is the expected stock-return volatility over the life of the option; r is the natural logarithm of risk-free interest rate; T is the time to maturity of the option in years; and d is the natural logarithm of expected dividend yield over the life of the option
Specifically, to estimate the option intensity of options granted in the current year, the risk free rate is obtained from the Chicago Federal Reserve website and all remaining inputs are available from COMPUSTAT’s ExecuComp Database. For previously granted options, we estimate the exercise prices and times-to-maturity using the approximation proposed by Core and Guay (2002). In broad samples of actual and simulated CEO
option portfolios, Core and Guay (2002) show that these approximations capture more than 99% of the variation in option sensitivities.
To estimate the exercise prices, we use the realizable values (excess of stock price over exercise price) available in ExecuComp for both the unexercisable and exercisable options. We divide the unexercisable (excluding new grants) and exercisable realizable values by the number of unexercisable and exercisable options to obtain the average amount each of these groups of options are “in the money.” Subtracting the average in the money amount per option from the firm’s stock price generates estimates of the average exercise price of the unexercisable and exercisable options. As Core and Guay (2002) point out, ExecuComp does not report the number of options that are out-of-the-money, and therefore it is not possible to determine the extent to which the exercise price exceeds the stock price for the the-money options. As a result, we assume out-of-the-money options have exercise prices equal to the stock price.
We assume that if the firm grants options in the most recent fiscal year, the time-to-maturity of previously granted unexercisable options is equal to the time-time-to-maturity of the recent option grant minus one year. Previously granted exercisable options for these firms are assumed to have a remaining time-to-maturity of three years less than that of the unexercisable options. If no grant is made in the most recent fiscal year, the times-to-maturity of unexercisable and exercisable options are assumed to be nine and six years, respectively.
4.2. Univariate comparisons of compensation structure
Table 4 reports differences in CEO compensation between the sample and control firms. All compensation variables are measured as of the fiscal year ending prior to the filing of the lawsuit. Our choice of measurement period reflects a tradeoff of two factors. Our objective is to identify the compensation structure in place during the period of time in which the alleged fraud was taking place – i.e. the class period. If we measure compensation as of the fiscal year ending prior to the class period, we increase the possibility that compensation is measured well before the alleged fraud and, therefore, may not be representative of the compensation structure in place at the time of the alleged fraud. On the other hand, our procedure of measuring compensation as of the fiscal year ending just prior to the lawsuit raises the possibility that some of the alleged fraud took place prior to the measurement of compensation. If so, it is more difficult to draw inferences regarding the incentive commit fraud. We note, however, that even using our procedure, compensation is measured prior to the class period in 49% of the cases. Moreover, we obtain similar results if we restrict the measurement of compensation to be prior to the start of the class period in all of the sample cases. We are, thus, confident that our findings are not driven by our choice of measurement period.
From Table 4, there is a significant difference between the incentives from options of the sample firms and those of the control firms. The average option intensity is $3.59 per $1000 change in shareholder wealth for the sample firms and $3.04 per $1000 change in shareholder wealth for the control firms. The difference is significant at the 0.04 level using a pairwise t-test. Median option intensity is also larger in the sample firms ($1.84 vs. $1.70). However, this difference is not statistically significant.
Importantly, the difference in option intensity appears to be economically relevant. To gauge economic significance, we first compute the difference in stock price from its highest value during the class period to its value following the class period. We then compute an industry-adjusted change as the difference between the firm’s change in stock price and that of the median firm in the same industry. Finally, we multiply this industry-adjusted change in stock price times the firm’s number of shares to arrive at an industry-adjusted change in equity value. Under the admittedly simplistic assumption that the stock price high during the class period is a consequence of fraud, whereas the post-class price is a measure of the “true” stock price, the industry-adjusted difference represents a measure of the change in equity value due to the alleged fraud. The average industry-adjusted drop in equity value is $8.37 billion. The average difference in option intensity between the sample and control firms is 0.56. Thus, on average, the CEO of the sample firm stands to gain an extra $4.65 million (8.37 bill. x 0.56 / 1000) from the alleged fraud. In other words, the differences in option intensity appear to be large enough to have a meaningful influence on the incentive to commit fraud.
Table 4 also reports data on other components of compensation structure, such as cash compensation (salary and bonus), long-term incentive plans (LTIPs), and restricted shares. Because salary levels are, by definition, not linked with changes in stock price, we expect no association between salary and the likelihood of fraud. However, if bonuses are paid on the basis of stock price performance, they might generate an incentive to commit fraud. Whether bonuses are, in fact, tied to stock price performance is debatable, however. Jensen and Murphy (1990) argue that the sensitivity of cash compensation to stock price performance is economically small.
LTIPs represent payments to the top executive for company performance over an extended period of time (usually three years). The metric for measuring performance can vary across firms and is not specified in ExecuComp. Like options, LTIPs link the wealth of the CEO with the performance of the firm. However, as described in Burns and Kedia (2004), there are reasons why we would not expect LTIPs shares to be as strongly associated with fraud as are options. Specifically, it is more difficult for the manager to take advantage of any short-term price discrepancy caused by fraud. LTIPs pay managers on the basis of firm performance over a multi-year period, while restricted shares typically have 3-5 year vesting requirements. This lengthening of time horizon reduces the manager’s ability to cash out when the stock price is artificially high.
Similarly, in the case of restricted shares, the manager is exposed to downside risk. Thus, if the manager cannot cash out when the stock price is artificially high, he/she is exposed to the price decline associated with the detection of the fraud. This exposure is greater than that observed with options.
The data in Table 4 reveal few differences in cash compensation, LTIPs, and restricted shares between the sample and control firms. We find that the mean (median) salary of the litigated firms is $624 (528) million, which is not statistically different from the mean (median) salary of the control firms. There is weak evidence that the control firm CEOs are paid a higher bonus. Surprisingly, the median bonus for the control firms is $346 million, as compared to $226 million for the sample firms. The difference is significant at the 0.06 level. However, average bonuses do not differ between two groups.
The median payout under long-term incentive plans is zero for both the sample and control firms, indicating that these are not primary components of the compensation structure. The average payout is higher in the control firms than in the sample firms ($321 thousand vs. $223 thousand). However the difference is not statistically significant.
As is the case with LTIPs, the median number of restricted shares held by the sample and control firm CEOs is zero. This again indicates that this component of the compensation structure is not particularly important. Nonetheless, we compute a measure of restricted share intensity that is similar to the option intensity measure. That is, it measures the extent to which the value of the restricted shares changes for a $1000 change in the value of the firm’s equity. More specifically,
Number of Restricted Share Held
Restricted Share Intensity= ×$1,000
Number of Shares Outstanding
As reported in Table 4, average restricted share intensity is higher in the sample firms than in the control firms. Again, however, the difference is not statistically significant.
4.2 Logit Analysis
Our findings to this point are suggestive of a link between option incentives and the likelihood of alleged fraud. To explore this possibility further, we estimate logit models in which the dependent variable is equal to one if the company is the target of a fraud allegation and zero otherwise. We test for an association between the likelihood of alleged fraud and the option intensity of the top executive’s compensation package. We also attempt to control for other possible determinants of fraud. Wang (2004) presents a model in which the firm’s propensity for fraud is positively related to growth prospects
and negatively related to the profitability of the firm’s current assets. The intuition for these predictions is that firms with good growth opportunities and low cash flow have a high need for external finance. Misreporting the firm’s prospects benefits shareholders by enabling the firm to raise capital on more favorable terms. Moreover, because growth opportunities might decrease the valuation precision of the firm’s cash flows, the probability of fraud detection is lower in high-growth firms.
To control for these effects, we include as independent variables the firm’s ratio of book value to market value and return on assets (net income divided by the book value of total assets.). In addition, following Erickson, Hanlon, and Maydew (2004), we control for firm size, leverage, risk of financial distress, and the need for external financing. Firm size is measured as the log of the book value of total assets. Leverage is measured as the ratio of total debt to the book value of total assets. The risk of financial distress is measured using Altman’s Z-score.6 The desire for external financing is a dummy variable equal to one if the company’s free cash ratio (Free-Cash) is less than -0.5 and zero otherwise. Free-Cash is equal to the difference between cash from operations and average capital expenditures over the prior three years, all divided by current assets. Dechow, Sloan, and Sweeney (1996) hypothesize that as Free-Cash
becomes more negative, the firm is more likely to manipulate earnings. A Free-Cash
ratio equal to -0.5 implies that, absent external financing, the firm will exhaust all of its current assets within two years. Finally, in some specifications, we control for unobserved industry effects by including industry dummy variables. All independent
6 Because leverage and Altman’s Z-core are correlated (ρ = -0.17), we also estimate the regression models
variables are measured as of the fiscal year ending prior to the filing of the lawsuit. The results are reported in Table 5.
In model (1), we report a significant positive relation between the likelihood of fraud and the option intensity of the CEO’s compensation package. The coefficient on option intensity is significant at the 0.01 level. In terms of the other control variables, allegations of fraud are negatively related to ROA and Altman’s Z-score, but unrelated to other firm characteristics.
In model (2), we include as independent variables the other components of the CEO’s compensation package: the log of salary, bonus, and LTIP, and the restricted share intensity. We also include industry dummy variables. The coefficient on option intensity is now slightly larger and continues to be statistically significant at the 0.01 level. We also find that the likelihood of fraud allegations is negatively related to the log of bonus payments and to the Z-score.
One objection to our tests is that some of the control variables that we use may also be determinants of compensation structure. For example, Kedia and Mozumdar (2002) argue that firms with a greater need to align incentives with those of shareholders are likely to use stock option compensation. Because these incentives are arguably larger in firms with valuable growth opportunities, the use of stock options will be negatively related to ratio of book value to market value. Similarly, John and John (1993) propose that firms with large amounts of debt outstanding are less likely to grant options because doing so would increase the possibility of bondholder-stockholder wealth transfers.
To control for these simultaneity issues, we adopt a two-stage estimation procedure. In the first stage, we estimate five separate OLS regressions in which we
relate each compensation component (option intensity, salary, bonus, restricted share intensity, and LTIP) to firm size, book-to-market, and leverage. These variables are chosen because they might be correlated with compensation, but do not appear to be associated with the probability of fraud in our sample (see models (1) and (2)). The residuals from each of these regressions represent the portion of compensation that is unexplained by firm size, book-to-market, and leverage. We then include each of these residuals as the explanatory variables in the second stage logistic regression along with a different set of independent variables than was used in the first stage: return on assets, Altman’s Z-score, and the Free Cash dummy variable. The results, reported in model (3) of Table 5 are nearly identical. The likelihood of alleged fraud continues to be positively related to option intensity. The coefficient on option intensity is unchanged from model (2) and remains statistically significant at the 0.01 level. In addition fraud allegations are negatively related to the log of bonus, and to the Z-score.
4.3. Robustness tests
In this section, we test the robustness of our primary findings to alternative sampling criteria and to alternative measures of option intensity. In order to conserve space, we do not report the results of these tests in a separate table.
First, as stated earlier, we use a set of matched control firms because our subsequent tests involve hand-collected data on ownership and board structure. One drawback to this approach, however, is that it overstates the likelihood of fraud. To address this issue, we re-estimate the regressions in Table 5 using the Execucomp
universe of firms over the sample period. Our results are unchanged. Specifically, we find that the coefficient on option intensity continues to be significant at the 0.01 level.
Second, we re-estimate the Table 5 regressions using Guay’s (1999) measure of option incentives. Specifically, Guay measures option incentives as the change in option value for a one percent change in stock price. Our results using this alternative measure are qualitatively similar, though slightly weaker. The coefficient on option incentives is now significant at the 5% level, but not at the 1% level of significance.
Third, the Private Securities Litigation Reform Act (PSLRA) became effective in January 1996. The intent of this reform was to reduce the incidence of non-meritorious lawsuits. If successful, therefore, we might expect a structural shift in the determinants of fraud in the post-1995 period. To test for this possibility, we partition the sample into those fraud cases alleged prior to January 1996 and those alleged in the post-1995 period. As previously shown in Table 1, over 75% of the sample observations are from the post-1995 period. When we estimate the logit models from Table 5 on this sub-sample, the results are qualitatively unchanged.
4.4. Alternative interpretations
Although our findings indicate a robust association between option incentives and fraud allegations, such an association admits two broad interpretations. First, option incentives might cause managers to be more likely to engage in fraudulent activity. Second, option incentives might be uncorrelated with the true incidence of fraud, but positively correlated with allegations of fraud. That is, fraud might be equally likely in firms with high option intensity and in firms with low option intensity. However, firms
with high option intensity might be more likely to be accused because they appear to have a financial motive for fraud.
Suppose, for example, that all lawsuits are frivolous, but shareholders choose to sue companies for which they believe there is a better chance of winning the suit. Because the presence of option incentives in the compensation structure makes it easier for shareholders to establish a motive for fraudulent behavior, shareholders might be more likely to allege fraud in firms with high option intensity even if no such fraud exists.7
To address this possibility, we obtain from the General Accounting Office (GAO) a sample of firms that restated their financial results. The 100 firms that comprise the intersection of this sample with our sample represents a set of firms that restated their financial results and subsequently faced a class action lawsuit. For this subset, therefore, we are more confident that the lawsuit stems directly from the restated results rather than simply being a frivolous suit filed because of the presence of option incentives. In results not reported in a table, we continue to find a positive relation between option intensity and fraud allegations in this subset of firms. Further evidence on this issue can be taken from the findings in Johnson, Ryan, and Tian (2003). They study a sample of 43 firms for which the SEC believed that there was sufficient evidence of accounting or auditing fraud to prosecute a case. In this sample, therefore, there is no incentive to file a frivolous lawsuit. Like us, Johnson, Ryan, and Tian (2003) find that fraud firms have significantly larger equity-based compensation.
Alternatively, suppose that all firms commit fraud, but those firms with high option intensity are more likely to be investigated and, therefore, discovered. Because heavy criticism of option compensation has only been present for the last few years, one way to test this alternative is to partition the sample into two sub-periods. If higher option intensity spurs greater investigation, we expect the association between fraud allegations and option intensity to be stronger in the latter part of our sample period. To test this, we define a dummy variable equal to one of the fraud allegation took place after 1998 and zero otherwise. We then interact the time period dummy variable with option intensity in logit models identical to those reported in Table 5. In none of these augmented models is the coefficient on the interaction term statistically significant.
We conclude, therefore, that while we cannot reject the possibility that the presence of option incentives and/or restated financial results motivates some investors to sue, the evidence seems more consistent with the view that some causality runs from option incentives to fraud.
5. Interactions between ownership structure, board structure and fraud allegations
Our results are consistent with the view that greater incentives from equity-based compensation are associated with an increased likelihood of fraudulent behavior. As discussed in Section 2, the incentive to commit fraud might be mitigated by monitoring from the board of directors, but exacerbated by the ownership of outside blockholders and institutional owners.
If outside directors are effective monitors, their presence should increase the probability of fraud detection and, therefore, the costs to the top executive of committing
fraud. Consequently, top executives might not commit fraud even if their option holdings appear to give them the incentive to do so. Consistent with this view, Uzun, Szewczyk, and Varma (2004) report a negative association between fraud allegations and the percentage of independent outsiders on the board of directors. We predict that the positive relation between fraud allegations and option intensity is weaker in firms with a high proportion of independent outside directors.
If managers are more likely to be disciplined for poor performance in firms with high institutional or blockholder ownership, they may have greater incentive to commit fraud in order to hide that poor performance. If this effect reinforces the financial incentives from equity-based compensation, we predict that the positive relation between fraud allegations and option intensity will be stronger in firms with high blockholder ownership or high institutional ownership.
To empirically examine these conjectures, we re-estimate model (2) of Table 5 for three different partitions of the data: above-median vs. below-median institutional ownership, above-median vs. below-median ownership of outside blockholders, and above-median vs. below-median fraction of independent outside directors. We form each partition using the sample firms only, then continue to match each sample firm with its control firm. Therefore, the unconditional probability of a fraud allegation is 50% in each partition.
The empirical specifications allow the slope coefficients on all of the independent variables to differ between the two partitions of the data. Although we do not have strong priors on this issue, it is plausible that the coefficients on the non-governance independent variables differ between the partitions. For example, recall that existing
theory predicts that fraud is positively related to growth opportunities and negatively related to profitability because (i) these firms have a greater need for external finance, and (ii) fraud allows them to raise capital on more favorable terms. However, if monitoring by outside directors raises the probability of fraud detection, it is possible that the likelihood of fraud will be less sensitive to these factors. By contrast, if (as we hypothesized earlier) blockholder and institutional ownership increases the expected payoffs to managers for reasons apart from external financing considerations, it is plausible that the likelihood of fraud will be less sensitive to growth opportunities and profitability in firms with large institutional holdings and blockholdings.
An alternative empirical approach would be to estimate a single model with interaction terms that allow the slope coefficients to differ between two partitions of the data. This alternative approach implicitly assumes constant coefficients on the other independent variables. We test this implicit assumption by conducting a likelihood ratio test of the hypothesis that the coefficients on the independent variables are constant across the two partitions of the data. In each case, the null hypothesis of constant coefficients across the two partitions of the data is rejected at the 0.01 level. Consequently, we report the results for separate partitions in Table 6.
The data are taken from corporate proxy statements for the year ending just prior to the lawsuit filing date. We define outside blockholders as any shareholder owning 5% or more of the firm’s shares who is not a corporate officer or director, is not related to a corporate officer or director, or affiliated with the firm through any business ties. Independent outside directors are defined similarly.
The results reported in Table 6 indicate that the positive relation between option intensity and alleged fraud is significant at the 0.01 level for firms with above-median institutional and block ownership. By contrast, the relation between option intensity and fraud allegations is statistically insignificant for firms with below-median institutional and block ownership. Moreover the differences in the coefficients on option intensity are statistically significant at the 0.01 level. There is no difference in the coefficient on option intensity between firms with above-median and those with a below-median fraction of independent outside directors.
In unreported regression models, we also include as independent variables the fraction of outsiders on the board of directors, the percentage ownership of institutional investors, and the percentage ownership of outside blockholders. In some specifications, the likelihood of fraud allegations is negatively related to the fraction of outsiders on the board. However, institutional ownership and block ownership are never significant. More importantly, the coefficient on option intensity is unaffected by the inclusion of these other governance characteristics. We conclude, therefore, that our findings are not a spurious byproduct of a correlation between option compensation and other governance characteristics.
Overall, therefore, the findings in Table 6 support the view that the effect of option incentives is exacerbated by institutional and block owners. However, the evidence does not support the hypothesis that the effect of option incentives is mitigated by monitoring from outside directors.
6. Summary and Implications
In the wake of recent high profile corporate scandals, regulators and the popular press have focused attention on the role of stock options in providing incentives to commit fraud. Perhaps as a result of this attention, some companies have re-examined their compensation policies and have elected to reduce the role of options in the compensation structure. One purpose of our study is to shed some light on whether such actions are warranted.
Our findings are consistent with the existence of a “dark side” to incentive compensation. Specifically, we find that the likelihood of a company being the target of fraud allegations is positively related to a summary measure of option incentives. This result is robust to controls for other possible determinants of fraud and to controls for other determinants of option intensity in a two-stage procedure. Moreover, it does not appear to be the case that shareholders file frivolous lawsuits and simply choose to sue companies that have greater option intensity because in these companies it would be easier to convince a jury that executives had the incentive to commit fraud. We find similar results even if we limit the sample to those companies that restated their earnings. We also find that the strength of the association between the likelihood of fraud and option intensity depends on characteristics of the firm’s equity ownership structure. Specifically, we report that the positive relation between option intensity and the likelihood of fraud is significantly greater for firms with higher blockholder and institutional ownership.
As noted earlier, our findings should not be viewed as an indictment of stock option compensation. We have empirically explored just one aspect of stock options –
namely, the incentive to fraudulently manipulate the firm’s stock price. Options also provide managers with a strong incentive to maximize the intrinsic value of the shares through legitimate means. As noted earlier, existing studies provide evidence that, on average, greater use of option compensation is associated with higher firm value. Moreover, in a recent study, Morgan and Poulsen (2001) report that proposals of executive stock option plans are met with a positive stock price reaction.8 These findings suggest that the positive incentive effects of options outweigh the negative effects, on average.
Our findings do, however, provide some insight into the complementarities of alternative corporate governance mechanisms. By addressing the basic agency problem between managers and shareholders via stock options, a new incentive problem can be created. Consequently, in such cases the marginal benefit of outside monitoring may be greater than in cases with low option incentives. The results of our study further imply that in designing optimal compensation plans, boards of directors need to balance the positive and negative effects of option-based compensation.
8 See also DeFusco, Johnson, and Zorn (1990). Martin and Thomas (2003), however, report negative stock
price reactions to stock option plans in which the shares reserved for options exceed 5% of the firm’s shares outstanding.
References
Beneish, M.D., 1999, Incentives and Penalties Related to Earnings Overstatements that Violate GAAP, Accounting Review 74, 425-457.
Bergstresser, D. and Philippon, 2002, CEO incentives and earnings management: evidence from the 1990s, Working Paper, Harvard University and MIT.
Bethel, J., Liebeskind, J. and T. Opler, 1998, Block Share Purchases and Corporate Performance, Journal of Finance 53, 605-634.
Black, F., M. Scholes, 1973, The pricing of options and corporate liabilities, Journal of Political Economy 81, 637-654.
Bryan S., L. Hwang, S. Lilian, 2000, CEO stock based compensation: an empirical analysis of incentive-intensity, relative mix, and economic determinants, Journal of Business 73, 661-693.
Burns, N. and S. Kedia, 2004, The Impact of Performance-Based Compensation on Misreporting, Journal of Financial Economics, forthcoming.
Colvin, G., 1998, Stop whining about Wall Street, Fortune, February 2, 153.
Core J., W. Guay, 2002, Estimating the value of employee stock option portfolios and their sensitivities to price and volatility, Unpublished paper (The Wharton School, Philadelphia, PA).
Dechow, P., R. Sloan, and A. Sweeney, 1996, Causes and consequences of earnings manipulations: An analysis of firms subject to enforcement actions by the SEC., Contemporary Accounting Research 13, (1): 1-36.
DeFusco, R., R. Johnson, and T. Zorn, 1990, The effect of executive stock option plans on stockholders and bondholders, Journal of Finance 45, 617-627.
Denis, D.J., D.K. Denis, A. Sarin, 1997, Ownership structure and top executive turnover, Journal of Financial Economics 45, 193-222.
Erickson, M., M. Hanlon, and E. Maydew, 2004, Is there a link between executive compensation and accounting fraud? Working paper, University of Chicago. Frye, M.B., 1999, Equity-based compensation for employees: firm performance and
determinants, Journal of Financial Research, forthcoming.
Gaver, J., K. Gaver, and J. Austin, 1995, Additional evidence on bonus plans and income management, Journal of Accounting and Economics 19, 3-28.
Gao, P., R. Shrieves, 2002, Earnings management and executive compensation: a case of overdose of option and underdose of salary? Unpublished paper (University of Tennessee, Knoxville, TN).
Guay, W.R., 1999, The sensitivity of CEO wealth to equity risk: An analysis of the magnitude and determinants, Journal of Financial Economics 53, 43-78.
Hall, B.J., 2003, The six challenges of equity-based pay design, Journal of Applied Corporate Finance 15, 21-33.
Hall, B.J., J.B. Liebman, 1998, Are CEOs really paid like bureaucrats? Quarterly Journal of Economics 113, 653-691.
Hall, B.J., K. Murphy, 2002, Stock Options for Undiversified Executives, Journal of Accounting and Economics 33.
Hartzell, J. and L. Starks, 2003, Institutional Investors and Executive Compensation, Journal of Finance 58, 2351-2374.
Healy, P., 1985, The effect of bonus schemes on accounting decisions, Journal of Accounting and Economics 7, 85-107.
Hendershott, R.J., 2004, Net value: wealth creation (and destruction) during the internet boom, Journal of Corporate Finance 10, 281-300.
Hermalin, B. and M. Weisbach, 2003, Boards of directiors as an endogenously determined institution: A survey of the economic literature, Economic Policy Review 9, 7-26.
Hillgeist, S.A., 2003, Stock Option Incentives and Firm Performance, Working Paper, Northwestern University.
Holthausen, R., D. Larcker, and R. Sloan, 1995, Annual bonus schemes and the manipulation of earnings, Journal of Accounting and Economics 19, 29-74.
Hotchkiss, E.S., D. Strickland, 2003, Does shareholder composition matter? Evidence from the market reaction to corporate earnings announcements, Journal of Finance 58, 1469-1498.
Jensen, M.C., K. Murphy, 1990, Performance Pay and Top-Management Incentives, Journal of Political Economy 98, 225-264.
John, T.A. and K. John, 1993, Top-management compensation and capital structure, Journal of Finance 48, 949-974.
Johnson, S., H.E. Ryan, Y.S. Tian, 2003, Executive compensation and corporate fraud, Unpublished paper (Lousiana State University, Baton Rouge, LA).
Kedia, S., A. Mozumdar, 2002, Performance impact of employee stock options, Unpublished paper (Harvard Business School, Boston, MA).
Martin, K. and R. Thomas, 2003, When is enough, enough? Market reaction highly dilutive stock option plans and the subsequent impact on CEO compensation, Unpublished paper (Vanderbilt University Law School, TN).
Merton, R., 1973, Theory of rational option pricing, Bell Journal of Economics and Management Science 4, 141-183.
Mehran, H., 1995, Executive compensation structure, ownership, and firm performance, Journal of Financial Economics, 38, 163-184.
Morgan, A. and A. Poulsen, 2001, Linking pay to performance: Compensation proposals in the S&P 500, Journal of Financial Economics 62, 489-523.
Murphy, K., 1999, Executive compensation, in: O. Ashenfelter and D. Card, Handbook of Labor Economics, 3 (North-Holland, Amsterdam).
Peng, Lin and Ailsa Roell, 2003, Executive pay, earnings manipulation and shareholder litigation, Unpublished paper (Baruch College, NY and Princeton University, NJ). Shleifer, A., R. Vishny, 1986, Large shareholders and corporate control, Journal of
Political Economy 94, 461-488.
Uzun, H., S.H. Szewczyk, and R. Varma, 2004, Board composition and corporate fraud, Financial Analysts Journal, May/June, 33-43.
Wang, Y., 2004, Securities fraud: An economic analysis, Working paper, University of Maryland.
Yermack, D., 1995, Do corporations award CEO stock options effectively? Journal of Financial Economics 39, 237-269.
Table 1
Description of the sample
Time profile of the sample, nature of allegations, and frequency by industry. Our sample consists of 358 firms in which there was an alleged fraud and compensation data was available on Execucomp (sample lawsuits). Our initial sample is comprised of 2,141 firms obtained from Securities Class Action Alert and Stanford Securities Class Action Clearinghouse databases in which there was an allegation of fraudulent behavior between 1993 and 2002 (all lawsuits). The Execucomp universe over the period 1993-2002 consists of 25,650 firm-years (Execucomp universe).
Panel A: Time profile of the sample Sample lawsuits All lawsuits
Year of filing Number of cases Percentage of total Number of cases Percentage of total
1993 8 2.2% 163 7.6%
1994 35 9.8% 216 10.1%
1995 46 12.8% 166 7.8%
1996 13 3.6% 109 5.1%
1997 34 9.5% 175 8.2%
1998 37 10.3% 234 10.9%
1999 57 15.9% 204 9.5%
2000 55 15.4% 215 10.0%
2001 56 15.6% 484 22.6%
2002 17 4.7% 175 8.2%
Total 358 100.0% 2,141 100.0%
Panel B: Nature of allegations Sample lawsuits
Nature of legal claim
Number of cases
Percentage of total
Material misrepresentations 234 65.4%
Misstated financial results 92 25.7%
Breach of fiduciary duties 25 7.0%
Misstated prospectus 10 2.8%
Poison pill provision 1 0.3%
No data available on nature of claim 10 2.8%
Total 372 103.9%
Panel C: Frequency by industry Sample lawsuits ExecuComp universe
Industry name Number of cases Percentage of total
Number of
Firm-Years Percentage of total
Drugs 28 7.8% 820 3.2%
Computer and office equipment 30 8.4% 760 3.0%
Communications equipment 20 5.6% 520 2.0%
Electronic components and accessories 10 2.8% 930 3.6%
Surgical and medical instruments 12 3.4% 560 2.2%
Telephone communications 9 2.5% 450 1.8%
Computer programming 51 14.2% 1,860 7.3%
Other industry groups 207 57.8% 19,750 77.0%
Table 2
Description of the Class Period
Description of the class period for the sample firms. The length of the class period is the number of days from the beginning of the class period to the end of the class period. We report Cumulative Abnormal Returns (CARs) from the beginning to the end of the class period, from the beginning to one trading day after the end of the class period, and from 5 trading days prior to the class period to one day after the class period. CARs are calculated using the CRSP equally-weighted market model with factor loadings estimated from -101 to -1 trading days before the beginning of the class period (day 0). Our sample consists of 358 firms in which there was an alleged fraud between 1993 and 2002 and compensation data was available on Execucomp.
Cumulative Abnormal Returns (CAR) Length of
Class Period
(days) Beginning to End of Class Period Beginning to End of Class Period+1
End of Class Period-5 to End of Class Period+1
Mean 286 -0.4622 -0.5898 -0.2540
Median 216 -0.3289 -0.4953 -0.2338
Mininum 0 -9.0399 -9.2351 -0.9592
Maximum 1,762 1.5298 1.5352 0.3084
Percent
-35.00% -30.00% -25.00% -20.00% -15.00% -10.00% -5.00% 0.00% 5.00%
-200 -175 -150 -125 -100 -75 -50 -25 0 25 50 75 100 125 150 175 200
Event Time
Cumulat
ive Abno
rm
al Retu
rn
s
Fig. 1: Cumulative Abnormal Returns 200 trading days prior and after the class action filing date (day 0) for the 358 sample firms calculated using the CRSP equally-weighted model with factor loadings estimated from day +1 to +101. The sample consists of 358 firms in which there was an alleged fraud between 1993 and 2002 and compensation data was available on Execucomp.
Table 3
Descriptive statistics for the sample and the control firms
Firm and Ownership, board and CEO characteristics for the sample and control firms. The sample consists of 358 firms in which there was an alleged fraud between 1993 and 2002 and compensation data was available on Execucomp. The control group consists of 358 firms that were matched with the sample firms on size and industry. Firm characteristics are obtained from Compustat and ownership, board and CEO characteristics are obtained from corporate proxy statements. Directors are classified as insiders if they are currently employees of the firm, as affiliated outsiders if they have business relations with the firm, are related to insiders or are former employees, and as independent directors otherwise. Significant differences are highlighted in italics.
Sample firms Control firms P-value of pairwise differences Mean Median Mean Median T-test Sign test
Panel A: Firm characteristics
Book to market value of equity 0.31 0.33 0.44 0.34 (0.22) (0.49)
Return on assets 0.12 0.13 0.14 0.14 (0.08) (0.06)
Return on equity 0.35 0.31 0.42 0.32 (0.24) (0.13)
Total debt to total assets 0.20 0.18 0.18 0.17 (0.16) (0.48)
Number of reported segments 2.57 1.00 2.56 1.00 (0.93) (0.79)
Market value of equity ($ million) 8468.85 1709.64 8483.62 1712.15 (0.79) (0.71)
Total assets ($ million) 6814.90 1185.59 8551.39 1178.25 (0.29) (0.63)
Panel B: Ownership, board, and CEO characteristics
Board size 8.99 9.00 9.12 9.00 (0.23) (0.43)
Fraction of independent outside directors 0.70 0.73 0.71 0.75 (0.11) (0.14)
Fraction of insider directors 0.24 0.20 0.22 0.18 (0.05) (0.11)
Fraction of affiliated outside directors 0.08 0.00 0.07 0.00 (0.44) (0.84)
Ownership of officers and directors (%) 11.75 5.82 10.46 4.80 (0.44) (0.96)
Ownership of outside blockholders (%) 14.06 10.70 15.07 12.05 (0.11) (0.24)
Ownership of affiliated blockholders (%) 0.58 0.00 0.67 0.00 (0.84) (0.74)
Institutional Ownership (%) 56.13 61.00 56.86 59.3 (0.55) (0.21)
CEO ownership (%) 5.53 1.30 4.71 1.10 (0.45) (0.63)
CEO age 52.28 53.00 54.27 54.00 (0.05) (0.01)
Table 4
Univariate comparison of compensation structure
Compensation structure comparison between the sample and control firms. The sample consists of 358 firms in which there was an alleged fraud between 1993 and 2002 and compensation data was available on Execucomp. The control group consists of 358 firms that were matched with the sample firms on size and industry. Compensation variables were obtained from Execucomp. Option intensity is the change in the value of the executive’s option portfolio from a $1000 change in the value of the firm’s equity. The option portfolio consists of three components: options granted in the current year, and vested and non-vested options granted in previous years. The option intensity is the sum of the sensitivities of each of these three components and the sensitivities are calculated by multiplying the option delta times the ratio of the number of options in the group to the number of shares outstanding times $1000. For previously granted options the exercise prices and time-to-maturity are estimated using the approximation proposed by Core and Guay (2002). The restricted share intensity is defined as the ratio of the number of restricted shares held by the executive divided to the number of shares outstanding multiplied by $1000. Significant differences are highlighted in italics.
Sample firms Control firms P-value of pairwise differences Mean Median Mean Median T-test Sign test
Option intensity 3.59 1.84 3.04 1.70 (0.04) (0.91)
Salary ($ thousand) 624 528 609 535 (0.50) (0.83)
Bonus ($ thousand) 667 226 647 346 (0.79) (0.06)
LTIP ($ thousand) 222.58 0.00 321.17 0.00 (0.44) (0.39)