General article
Usage patterns of blue flower color
representation by Encyclopedia of Life content
providers
Chantal-Marie Wright, Katja C Seltmann
† American Museum of Natural History, New York, United States of America
Corresponding author: Katja C Seltmann ([email protected])
Academic editor: Anne Thessen
Received: 09 Jun 2014 | Accepted: 07 Aug 2014 | Published: 11 Aug 2014
Citation: Wright C, Seltmann K (2014) Usage patterns of blue flower color representation by Encyclopedia of Life content providers. Biodiversity Data Journal 2: e1143. doi: 10.3897/BDJ.2.e1143
Abstract
Encyclopedia of Life (EOL) is a resource for community-driven biodiversity data, focusing on species information and images. Research into blue flowers to compare color ('blueness') at different elevations revealed that data content providers describe flowers as blue for any color hue in the range from blue to magenta. We propose methods for standardizing color values and color searching within EOL by means of an expanded color vocabulary and improved access to image metadata, in order to improve the research capacity of this valuable resource.
Keywords
Encyclopedia of Life, TraitBank, color models and analysis, user phenotype annotation, Phenotypic Quality Ontology
Introduction
The stated mission of Encyclopedia of Life (Parr et al. 2014b) is "To increase awareness and understanding of living nature through an Encyclopedia of Life that gathers, generates,
† †
and shares knowledge in an open, freely accessible and trusted digital resource" (http:// EOL.org/about). In addition to data uploaded directly to EOL by Curators (http://eol.org/ info/curators), content is aggregated from a large number of websites known as Content Partners (http://eol.org/content_partners). These partners include expert-driven scientific databases and museum collections, as well as collectively edited websites such as Wikipedia.
Several prior studies noted the prevalence of blue flowers in high elevation areas (Weevers 1952, Brunet 2009). These studies focus on specific geographic areas and are not worldwide or continental in scope. To address the question of whether blue flowers are an adaption prevalent at high elevations, aggregated data from worldwide resources is needed. This study annotated the 'blueness' of blue flowers at all elevations in North America from photographs available from the EOL. Only images of flowers known to be blue in color were sampled, as we were concerned with the amount of blue present in a flower at different elevations, and not the distribution of all flower colors. During the investigation it became apparent that searching for the color "blue" resulted in flower images with a range of color hues. We then compared the color representation of each retrieved image using three different color models including the Red, Green and Blue (RBG; Adobe Systems Inc. 2012); Hue, Saturation, and Value (HSV; Smith 1978); and Phenotypic Quality Ontology (PATO; Gkoutos et al. 2005) class representation.
Material and methods
Data Acquisition
display the RGB values of the pixel with the color picker tool (Fig. 3) and the corresponding RGB values were recorded. If the flower had several petals that were different in color, a sample from each petal was selected, copied and pasted in a row on a blank new image; this row of samples was then selected and re-sized for averaging.
Figure 1.
Representative area of petal selected (Gentiana nivalis).
Figure 2.
Data Analysis
Data analysis and graphing were performed using R statistical software (R 2010 – Version 2.13.1; Suppl. materials 1, 4). We defined color hue labels for the principle colors of interest in this study (i.e. red, magenta, purple, blue, cyan, green, yellow, and orange) as follows. Pure blue (RGB: 0,0,255), red (RGB: 255,0,0) and green (RGB: 0,255,0) are defined by the absence of other RGB values and 255 for the respective color. Magenta (RGB: 255,0,255), cyan (RGB: 0,255,255), and yellow (RGB: 255,255,0) follow an extended PATO definition (Suppl. material 6). Orange is an intermediate value between yellow and red, based on the PATO definition of orange as an intermediate color (RGB: 255,165,0). Purple (RGB: 128,0,128) is an intermediate color whose hue, after conversion to HSV, is equivalent to magenta (300°) at varying levels of saturation or addition of other hues. Since our concern in this publication is the principle hue value, purple and magenta are considered synonymous.
Color values were converted from Red, Green, Blue color model (RGB) to Hue, Saturation, and Value color model (HSV). Conversion was accomplished using the rgbtohsv library in the R package grDevices version 2.13.1 (R 2010). The HSV cylindrical-coordinate representation of color is flattened for analysis by including only the recovered Hue values. Saturation and Value are excluded as Value (i.e. brightness) may be dependent on the computer monitor brightness (Hung and Tsai 2008) and Saturation (addition of black and white) is outside of the scope of this article, as it would add additional complexity to the analysis. Additionally, in order to render results in a linear, rather than 360 degree (i.e. color wheel) representation, and since the majority of the Hue values from the data cluster around blue, all Hue degree values were mapped onto a bipolar linear range of values from -60 to 40, centered near true blue, creating a bipolar range of hues. The equation for converting Hdegree to Hbipolar is represented in Fig. 4.
Figure 3.
The basic color hue representations discussed above are outlined in Table 1.
Color label RGB HSV (H , S%, V%) H PATO Identifier
red 255,0,0 0°,100%,100% 40/-60 http://purl.obolibrary.org/obo/PATO_0000322 magenta 255,0,255 300°,100%,100% 20 http://purl.obolibrary.org/obo/PATO_0000321 purple 128,0,128 300°,100%,50% 20 http://purl.obolibrary.org/obo/PATO_0000951 blue 0,0,255 240°,100%,100% 7 http://purl.obolibrary.org/obo/PATO_0000318 cyan 0,255,255 180°100%,100% -10 http://purl.obolibrary.org/obo/PATO_0000319 green 0,255,0 120°,100%,100% -30 http://purl.obolibrary.org/obo/PATO_0000320 yellow 255,255,0 60°,100%,100% -43 http://purl.obolibrary.org/obo/PATO_0000324 orange 255,128,0 30°,100%,100% -52 http://purl.obolibrary.org/obo/PATO_0000953 Phenotypic Quality Ontology Uniform Resource Identifiers (URI) are mapped to each hue value. The modifications to existing PATO definitions necessary to fully describe image hues were formally proposed for inclusion in the PATO ontology via the Open Biomedical Ontology SourceForge request account ( https://sourceforge.net/p/obo/phenotypic-quality-pato-requests). Additionally, terminology was proposed to represent intermediate color value ranges, and Encyclopedia of Life URI are assigned to these terms at the present time. Each proposed color term corresponds to a range of values between primary hues as in the example of Fig. 5.
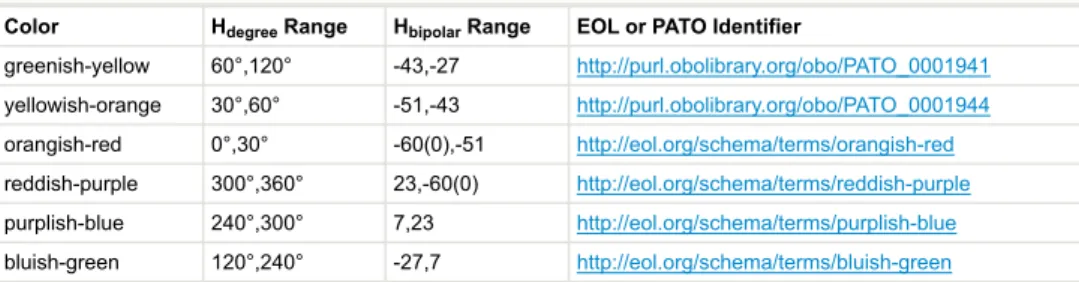
The range, or intermediate values, between primary Hues (i.e. red, magenta, purple, blue, cyan, green, yellow, and orange) can be represented in H , H or using natural language terms. The representations for the hue range values are outlined in Table 2.
degree bipolar
degree bipolar Figure 4.
Equation for converting hue values in units degree to hue values as bipolar percent, where blue is near zero.
Table 1.
Values for the principle colors of interest as represented in RGB, HSV, H color models and PATO URI.
bipolar
Figure 5.
Color H Range H Range EOL or PATO Identifier
greenish-yellow 60°,120° -43,-27 http://purl.obolibrary.org/obo/PATO_0001941 yellowish-orange 30°,60° -51,-43 http://purl.obolibrary.org/obo/PATO_0001944 orangish-red 0°,30° -60(0),-51 http://eol.org/schema/terms/orangish-red reddish-purple 300°,360° 23,-60(0) http://eol.org/schema/terms/reddish-purple purplish-blue 240°,300° 7,23 http://eol.org/schema/terms/purplish-blue bluish-green 120°,240° -27,7 http://eol.org/schema/terms/bluish-green
Results
Searching for "blue flowers" from the EOL search interface resulted in 1165 images representing unique specimens, and 182 unique species. 33 species recovered have a common name that contains the word "blue". The reminder of the 149 species were retrieved because the word "blue" occurred somewhere in the description. Based on the analysis described above, records returned using the color name "blue" presented a spectrum of flower colors spanning all angles of the color wheel (Fig. 6).
Fig. 7 graphically represents the results on the bipolar linear scale. Each point on the scatterplot indicates the hue value H of one of the sampled images, with the Y-axis being the hue value and the X-axis the unique image number. The colored lines running horizontally across the scatterplot represent the position of pure hues of green, cyan, blue, magenta, and red drawn at their respective values. To the right, the histogram shows the
degree bipolar
bipolar Table 2.
Range hue values for proposed intermediate colors as represented in RGB, HSV, Hbipolar color models, and PATO or EOL URI.
Figure 6.
number of species whose median hue value falls within each bin. The color of each bar on the histogram represents the midpoint hue value of the range of hues from each respective bin. The scatterplot in Figure 7 illustrates that the majority of images retrieved by searching for "blue" have hue values that fall between blue and magenta. The majority of the species have a median hue value between 0 and 20, again indicating that most of the flowers from the search results for "blue" are actually blue to magenta in hue value. The median converted HSV value for all images is 251°, corresponding to a H value of 9.68, and a transitional hue value between blue and magenta (Fig. 6). The outlier hue values below pure green (-26.67) on the graph result from either a white flower described in the search results as "blue" or a flower that includes complementary colors that when averaged resulted in gray.
Discussion
The Encyclopedia of Life (EOL) collects images from individual users and from online "Content Partners". These Content Partners are varied, ranging from museums and government divisions such as US Fish and Wildlife Service (http://www.fws.gov), to open-access, community driven websites like Flickr (http://www.flickr.com). We surmised from this investigation that, at the present time, researching phenotype data utilizing the present EOL interface is difficult. This is not an observation unknown to EOL, as demonstrated by the recent inclusion of the TraitBank software (Parr et al. 2014a) as a novel means of including controlled vocabularies in searching. For this specific study, each species of flower that was returned in a search result had to be evaluated independently for color. We found that many species were included in the EOL search results because the words "blue" and "flower" both appeared somewhere within the free text descriptive blocks, and did not always represent an accurate account of the flower phenotype as appearing in the
bipolar
Figure 7.
associated images. The search function on EOL does not work by searching assigned keywords or tags on images; rather, it searches the entire descriptive content, although filters can be applied to show only search results for taxa, articles, or image descriptions. However, if sorting by image when searching for "blue flower," images are only found if the associated species has the words "blue" and "flower" somewhere in the file name or image description; since not all images have a description or even a descriptive filename, only 218 images result from a filtered search. We suggest further development of controlled vocabulary tagging, utilizing Phenotypic Quality Ontology (PATO; Gkoutos et al. 2005), to augment image descriptions as a method of informing content descriptions. Tags directly associated with images would produce the added benefit of creating specimen level content for EOL.
The ability to control and standardize imaging techniques in as large a resource as EOL is challenging, and this study expected to find variation in flower color within a single species, based on image quality or intraspecific variation. We suggest that the study of color based on EOL images would benefit from the ability to easily access original images that contain color profile information embedded within the image metadata. Color profile information, found in the Exchangeable image file format (Exif), may improve the accuracy of color analysis, as it contains information about the image and camera settings when the photograph was taken (Ricker 2004). Additionally, access to original images reduces the possibility of modifications and enhancements that photographers add during post-processing, which may additionally bias the results. EOL does provide links to the provider of the image, where the original image may be stored. However, there is no way to know the quality of the image from the provider without leaving the EOL website.
A final suggestion for stimulating scientific research utilizing EOL is to encourage data providers to include geo-coordinates for images, as each image is a representation of an individual occurrence of a species. These could be provided either manually or through Exif metadata. For this study, USDA PLANTS was used to acquire the native range of species whose native ranges could not be found in the taxon information available on EOL. However, general species ranges are often vague and typically do not include enough detail concerning specific environmental conditions of the specimen for ecological inference.
brightness values, and Photoshop continues to use this standard today. The PATO ontology bases its definitions on color wavelength. Unfortunately, there is no easy or accurate conversion between colors as defined by PATO and color in a Hue, Saturation and Value (HSV) representation as there is no unique mapping between wavelength and RGB. Additionally, some RGB values may be a representation of multiple wavelengths (Berns et al. 2000). Furthermore, only 72 species result from the search for blue flower color using TraitBank, where our search conducted using the general search and narrowing to flower taxa (in North America) resulted in 151 species, which have been called "blue" by at least one source. The number of TraitBank annotated species is lower than our search result at the present time; however, this will likely improve as annotated data is ingested from varied content providers.
Data from this study indicates that the majority of the images sampled have hue values that fall above blue towards magenta, into what might be called "purple" hue rather than "blue" hue. The ability to tag images with a structured vocabulary that includes suggestions of intermediate ranges like "purplish" or "blueish-purple" to differentiate among the colors that fall between magenta and blue rather than magenta and red would be helpful in clarifying color descriptions. We suggest the adoption of a Color Naming System (CNS) terminology with HSV or RGB intermediate values. Assigning natural language terms to discrete ranges of hue values could be used to convert the results from an automatic color picker tool to terms more easily understood by image describers. Further support for the adoption of an expanded color naming system exists in the literature. Berk et al. (1982) demonstrated users annotating colors using RGB, Hue, Saturation and Lightness (HSL) and the Color Naming System (CNS), based on the color lexicon used by the Inter-Society Color Council (ISCC – Berk et al. 1982). The users of the CNS system were significantly more accurate in specifying color than users identifying color with the RGB and HSL numerical systems. The ISCC lexicon is in turn based on the Munsell system (Simon 1997) and the HSL system, another common cylindrical-coordinate representation of points in an RGB color model similar to HSV.
Conclusion
In conclusion, this study revealed that searching for "blue" flowers on EOL returned images that when analyzed represented color values that range from blue to magenta. The PATO terms presently available for use by EOL include violet, blue, cyan, green, purple, light blue, dark blue, and saturated blue in the range of blue descriptors. Studies have shown that humans may be able to best represent color in textual descriptions that include more nuanced variation (i.e. greenish-blue, bluish-purple) than is currently available through PATO. We propose to extend PATO (Suppl. material 6), and available color hue descriptors, to include relative values for blue and other colors. A greater palette for color annotation would aid image description, and supply a richer ontology for color for tagging and assigning phenotype traits, which would make color research using EOL’s resources more refined for scientific research. These tags and traits should also be applied to images directly to aid phenotype research, as species can display a range of traits, and many traits are not yet summarized to their extent in the scientific literature.
Acknowledgements
The authors would like to acknowledge Dr. Yon Visell for his insightful discussions on color model calculations. This study was made possible by funding and support from The Encyclopedia of Life, EOL Rubenstein Fellows Program and the David M. Rubenstein Grant (CRDF #EOL-33066-13/G33066), Smithsonian Institution. Support was also provided by CRDF Global. Materials and infrastructure support were provided by Tri-Trophic Thematic Collections Network (National Science Foundation grant ADBC#1115144) and the American Museum of Natural History.
Author contributions
Conceived and designed the experiments: KCS CMW. Performed the experiments: CMW KCS. Analyzed the data: KCS CMW. Contributed reagents/materials/analysis tools: CMW KCS. Wrote the paper: KCS CMW.
References
• Adobe Systems Inc. (2012) Adobe Photoshop CS6 Extended. Version 13.0 x64. Release date: 2012 5 07.
• Berk T, Kaufman A, Brownston L (1982) A human factors study of color notation systems for computer graphics. Communications of the ACM 25 (8): 547‑550. DOI: 10.1145/358589.358606
• Brunet J (2009) Pollinators of the Rocky Mountain columbine: temporal variation, functional groups and associations with floral traits. Annals of Botany 103 (9): 1567‑1578. DOI: 10.1093/aob/mcp096
• Gkoutos GV, Green EC, Mallon A, Hancock JM, Davidson D (2005) Using ontologies to describe mouse phenotypes. Genome Biology 6 (1): R8. DOI: 10.1186/gb-2004-6-1-r8 • Hung C, Tsai F (2008) Automatically Annotating Images with Keywords: A Review of
Image Annotation Systems. Recent Patents on Computer Science 1 (1): 55‑68. DOI: 10.2174/2213275910801010055
• Parr C, Wilson N, Schulz K, Leary P, Rice J, Hammock J2 (2014a) TraitBank: Practical semantics for organism attribute data (in prep). Semantic Web Journal 0: 0.
• Parr C, Wilson N, Leary P, Schulz K, Lans K, Walley L, Hammock J, Goddard A, Rice J, Studer M, Holmes J, Corrigan R2 (2014b) The Encyclopedia of Life v2: Providing Global Access to Knowledge About Life on Earth. (submitted). Biodiversity Data Journal e1079: 0. DOI: 10.3897/BDJ.2.e1079
• R DCT (2010) R: A Language and Environment for Statistical Computing. R Foundation for Statistical Computing, Vienna, Austria, 0 pp. URL: http://www.R-project.org [ISBN 3-900051-07-0]
• Ricker MD (2004) Pixels, bits, and GUIs: The fundamentals of digital imagery and their application by plant pathologists. Plant disease 88 (3): 228‑241. DOI: 10.1094/ PDIS.2004.88.3.228
• Seltmann K, Yoder M, Miko I, Forshage M, Bertone M, Agosti D, Austin A, Balhoff J, Borowiec M, Brady S, Broad G, Brothers D, Burks R, Buffington M, Campbell H, Dew K, Ernst A, Fernandez-Triana J, Gates M, Gibson G, Jennings J, Johnson N, Karlsson D, Kawada R, Krogmann L, Kula R, Mullins P, Ohl M, Rasmussen C, Ronquist F, Schulmeister S, Sharkey M, Talamas E, Tucker E, Vilhelmsen L, Ward P, Wharton R, Deans A (2012) A hymenopterists' guide to the Hymenoptera Anatomy Ontology: utility, clarification, and future directions. Journal of Hymenoptera Research 27: 67‑88. DOI: 10.3897/jhr.27.2961
• Simon F (1997) Color Order. In: American Association of Textile Chemists and Colorists Color technology in the textile industry. 179-180 pp.
• Smith AR (1978) Color gamut transform pairs. ACM SIGGRAPH Computer Graphics 12 (3): 12‑19. DOI: 10.1145/965139.807361
• USDA, NRCS, National Plant Data Team (2014) The PLANTS Database. [website].Greensboro, NC 27401-4901 USA. URL: http://plants.usda.gov
• Weevers T (1952) Flower colours and their frequency. Acta Botanica Neerlandica 1: 81‑92. DOI: 10.1111/j.1438-8677.1952.tb00002.x
Supplementary materials
Suppl. material 1: Final scripts and graph methods
Authors: Katja C. Seltmann Data type: R Analysis
Suppl. material 2: Image information and data
Authors: Chantal-Marie Wright, Katja C. Seltmann Data type: Excel
Brief description: Master Excel file with metadata about the image. Also includes metadata about the specific imaged specimen, or generalized species metadata when specimen data is not available.
Filename: master_analysis_color_with_blue_revised.xlsx - Download file (281.16 kb)
Suppl. material 3: Data field definitions
Authors: Chantal-Marie Wright Data type: text
Brief description: Data field definitions for the master Excel file (Document 2). Filename: definitions.docx - Download file (14.73 kb)
Suppl. material 4: Tab delimited text file
Authors: Katja C. Seltmann Data type: Image analysis
Brief description: Tab delimited text file used in R scripts. Filename: master_analysis_color.tsv - Download file (268.61 kb)
Suppl. material 5: RGB values recovered from point analysis of images
Authors: Katja C. Seltmann Data type: RGB values
Brief description: RGB values recovered from point analysis of images. Used in R scripts to convert to HSV.
Filename: rgb2hsv_v2.tsv - Download file (64.11 kb)
Suppl. material 6: Color Terms and URI
Authors: Katja C. Seltmann and Chantal-Marie Wright Data type: URI
Brief description: URIs and definitions of hues as defined by PATO ontology or defined by authors. These terms were proposed for inclusion in PATO, or edits to existing definitions in PATO. Where PATO URIs were not available eol identifiers were included.