iddle school students appear to prefer after-school programs that require them to do homework! In a recent sixteen-month study that
How After-School Programs
Help Students Do Better
K Y L E G R AY, B A R B A R A R O O L E , A N D G O R D O N P. W H I T A K E R
Gray is a social research associate at the North Carolina Teacher Academy. Roole is a student in UNC–CH’s Master of Public Administration Program and its Law School. Whitaker is an Institute of Government faculty member who specializes in public administration. This study was conducted at UNC–CH‘s Center for Urban and Regional Studies.
I believe, from what I hear in the community and from the kids that I know, that the kids [in after-school programs] are less likely to be in trouble. They are more focused. I am a real believer, especially with adolescent kids, that the busier you keep them in structured supervised situations, the less time they have to get into trouble. Being a part of the drum corps is a source of pride for kids. One of the real positive outcomes of the program is that it gives kids a good focus and a source of pride in themselves and what they do.”
—Marsha Bate, President of the Youth Services Action Group, Asheville, North Carolina
M
we conducted for the North CarolinaGov-ernor’s Crime Commission, we found that stu-dents in grades 6 through 8 were twice as likely to attend after-school programs regularly if the programs included daily periods of struc-tured homework assistance. The purpose of the study was to identify practices that strengthen after-school programs, deter delin-quency, and make other positive differences in the lives of young people. Although further research is needed to determine the effect of after-school programs, we did identify several practices that appear to help students do bet-ter—structured homework assistance being one of the most important ones. This article summarizes the findings of our study.
BACKGROUND AND METHODS
After-school programs serve communities of children and youth all across the United States. However, no comprehensive national data are available on the number of programs or the number of children they serve. The most complete picture comes from the National Study of Before- and After-School Programs conducted for the U.S. Department of Education in 1993. The vast majority of the 1,300-plus programs sampled for that study served “
younger children. Most of the programs were operated by schools, churches, nonprofit agencies, or govern-ment departgovern-ments, but more than a third were run by private, for-profit businesses.1
In North Carolina as in the United States generally, no reliable data are available on the number of after-school programs or the number of students enrolled in them. During the past five years, the numbers have un-doubtedly increased as schools, nonprofit agencies, and local governments have responded to federal and state initiatives to support after-school programs. The larg-est of the North Carolina initiatives is the governor’s Support Our Students (SOS) Program, which currently helps fund programs in 76 counties, serving some 12,000 students at 170 sites. SOS focuses on middle school youth, aiming to help them stay out of trouble and do well in school. According to the SOS Web page, “In the 1996–97 school year, community volunteers donated more than 88,000 hours of their time and tal-ent to SOS, working one-on-one with studtal-ents, teach-ing classes, servteach-ing on local advisory councils and helping with fundraising efforts. Local civic and com-munity groups, businesses, schools and individuals . . . donated more than $3.4 million in cash and in-kind contributions to SOS that same year, helping expand the number of students that can be served locally.”2
The Governor’s Crime Commission also has helped fund after-school programs, particularly programs for middle school youth. The Crime Commission’s Juve-nile Delinquency Prevention Committee, interested in determining what features of those programs seemed most likely to help students stay out of trouble, asked us to undertake this study and, from the findings, to de-velop a handbook for strengthening after-school pro-grams. In consultation with Crime Commission staff, we chose twelve programs funded by the Crime Com-mission to visit and discuss the study. After those vis-its and with the agreement of each program’s manager, we selected the following six programs to be the sub-jects of the study:
•
Asheville Housing Authority’s Hillcrest Enrichment Program in Buncombe County•
Boys & Girls Clubs of Pitt County•
Cleveland County Schools’ Black Youth in Action•
Robbinsville Middle School’s After-School Program in Graham County•
Rockingham County SOS•
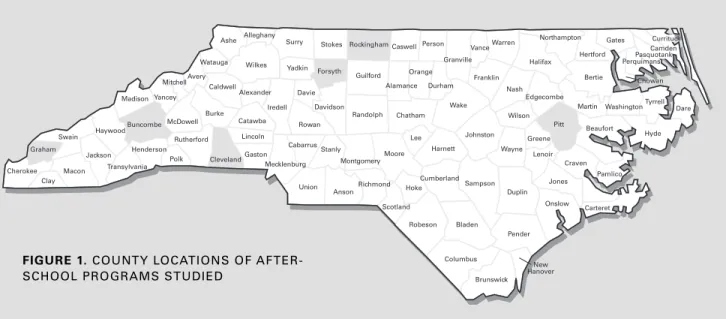
The YMCA of Greater Winston-Salem’s SOS program in Forsyth CountyThe six programs were located in the mountains, the piedmont, and the coastal plain (for their county loca-tions, see Figure 1). They included urban and rural settings and various racial mixes of students. Some focused on students who had been identified as “at risk” by school or court officials; others were open to the general population, including those who might be at risk.3 Some required regular homework each day; others did not. Because there is no systematic descrip-tion of after-school programs statewide, it is not pos-sible to say how well this sample represented them all. However, we chose the six to represent the sorts of places, people, and activities that typify after-school programs all across North Carolina. Each reader will need to decide whether the findings seem applicable to the settings with which he or she is familiar.
Each program that we studied provided supervised activities for young people during the after-school hours at least four afternoons a week. The ages of the young people ranged widely, but most were from twelve to fifteen years old.
We studied seventeen after-school program sites operated by the six programs. We also studied 187 young people enrolled at the seventeen sites. To ob-tain this sample, in fall 1997 we invited all middle school students who were enrolled at the seventeen sites to become study participants. A total of 187 ac-cepted the invitation, and their parents gave us con-sent to obtain data about the participants in at least one of four ways:
1. Fall and spring surveys
2. School records of grades, End-of-Grade test scores, attendance, and disciplinary actions 3. Juvenile court records
4. After-school program records
For most participants, we had data from all four sources.
CHARACTERISTICS OF AFTER-SCHOOL PROGRAMS
After-school programs vary according to local needs. However, those we studied and others nationwide have several common attributes:
•
Use of enrichment activities—The programs that we studied offered more than ninety kinds of educational, social, cultural, recreational, and community-oriented enrichment activities for participants. The range, the quality, and the quantity of these activities varied by program,depending on the availability of resources and other factors. On a typical day, the programs of-fered participants a snack, some form of home-work assistance, recreational activity, and group activity.
•
Variation in enrollment—The typical size of after-school programs in North Carolina is not known. The National Study of Before- and After-School Programs reported that in 1991 the average enrollment in an after-school program in the South was thirty-five participants.4 This average, however, masks wide variation in both the size of programs and the average daily atten-dance. Enrollment at the six programs in our study ranged from 28 to 2,114, with an average of 625. Two of the programs operated at a single site, the other four at three to eight sites each. Overall, the six programs operated at twenty-four sites. The average daily attendance was 49 per site. Most sites, however, averaged from 15 to 30 participants daily.•
Afternoon schedule—After-school programs typically operate from the close of the school day until the end of the work day, three to five days a week. Two of the programs in our study, how-ever, offered extended programming into the early evening hours.•
Community sponsorship—A variety of commu-nity organizations and agencies sponsor the six programs we studied, including two nonprofit or-ganizations, two public school systems, one county government unit, and one local housingauthority. According to the 1993 national study, the three types of organizations that are most likely to sponsor both before- and after-school programs in the South are private corporations, nonprofit organizations, and public schools.5
CHARACTERISTICS OF STUDY PARTICIPANTS
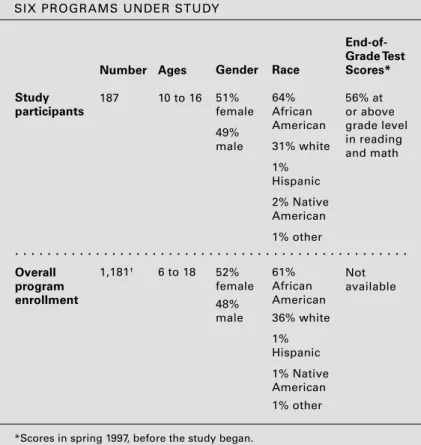
Overall, the 187 study participants in the six programs were representative of the programs’ overall member-ship in terms of age, gender, and race (see Table 1). Although the study participants ranged in age from ten to sixteen, the vast majority (87 percent) of them were from twelve to fifteen years old, the age group served by all the study programs.
We could not determine how representative the study participants were of young people in their age range who attend after-school programs statewide. No information is available about the demographic make-up of North Carolina’s after-school programs.
PROGRAM CHARACTERISTICS AND ACTIVITIES STUDIED
Our aim was not to see what difference simply attend-ing an after-school program might make. We had no control group of nonparticipants. Rather, our purpose was to identify the after-school program activities or policies that appeared to be more likely to deter delin-quency and make other positive differences in the lives of participants. To address that issue, we explored the relationship between fourteen program characteristics
FIGURE 1. COUNTY LOCATIONS OF AFTER-SCHOOL PROGRAMS STUDIED
Alamance Alexander Alleghany Anson Ashe Avery Beaufort Bertie Bladen Brunswick Buncombe Burke Cabarrus Caldwell Camden Carteret Caswell Catawba Chatham Cherokee Chowan Clay Cleveland Columbus Craven Cumberland Currituck Dare Davidson Davie Duplin Durham Edgecombe Forsyth Franklin Gaston Gates Graham Granville Greene Guilford Halifax Harnett Haywood Henderson Hertford Hoke Hyde Iredell Jackson Johnston Jones Lee Lenoir Lincoln McDowell Macon Madison Martin Mecklenburg Mitchell Montgomery Moore Nash New Hanover Northampton Onslow Orange Pamlico Pasquotank Pender Perquimans Person Pitt Polk Randolph Richmond Robeson Rockingham Rowan Rutherford Sampson Scotland Stanly Stokes Surry Swain Transylvania Tyrrell Union Vance Wake Warren Washington Watauga Wayne Wilkes Wilson Yadkin Yancey
(see Table 2) and five positive outcomes for youth: de-terrence of delinquency (staying out of trouble), completion of homework, improvement of academic performance, improvement in End-of-Grade test scores, and improvement in self-esteem. Our major findings were as follows:
•
Programs that provided structured homework assistance, had community-based sites or pro-vided regular transportation, and used targeted enrollment/a high number of volunteer hours per child were more likely than programs that did not have these characteristics to attract partici-pants and thus to help them stay out of trouble and/or improve their academic performance. (Because the sites that targeted at-risk youth for enrollment also had high numbers of volunteer hours per child, we could not determine the separate effects of these characteristics.)•
African-American students in programs with anAfrican-American cultural enrichment emphasis were more likely than African-American students in programs with no such emphasis to increase their self-esteem.
The following sections present more detail on these findings. (For a description of the related handbook that we produced, which reviews the literature on after-school programs and describes effective practices in them, see the sidebar, page 44.)
DETERRENCE OF DELINQUENCY
An important goal of after-school programs is to deter delinquency by providing three to four hours of adult supervision on weekday afternoons. Young people attending these programs are engaging in activities with positive role models during the very hours when youth are most likely to get into trouble.6 So in the study we looked at the relationship between various program characteristics and rates of program at-tendance (more than half of the program days versus less than half of the program days). Of the program characteristics studied, only structured homework assistance, community-based sites or regular trans-portation, and targeted enrollment/many volunteer hours were associated with higher rates of program attendance.
Structured Homework Assistance
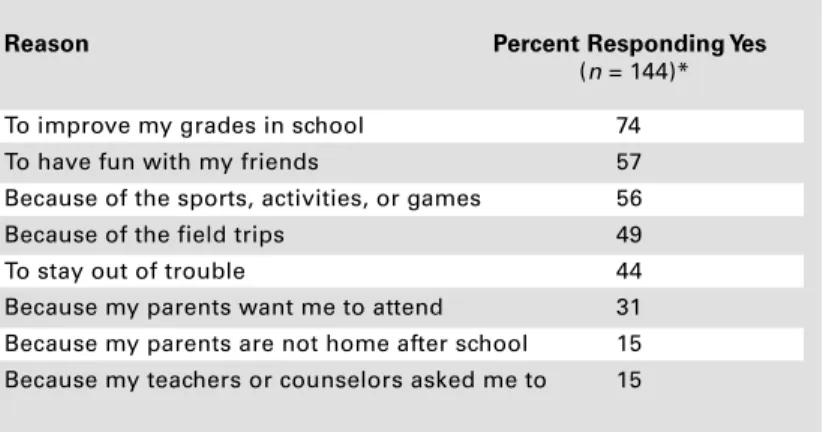
A period of required homework assistance appears to help increase attendance at after-school programs. Most students in these programs said that they wanted to do better in school. In fact, at the end of the program year, when we asked participants to choose among eight possible reasons that they attended their program, 74 percent indicated that they did so to improve their grades. In contrast, 57 percent said that they attended to have fun with their friends, 56 percent because of the sports, activities, and games, and only 15 percent because their parents were not at home. Students chose the other four reasons in varying proportions (including to stay out of trouble, 44 percent), but they gave no other reason as frequently as they gave “to improve grades in school.” (For the percentage choosing each reason, see Table 3.)
Moreover, a solid majority (80 percent) of par-ticipants at programs with structured homework assis-tance attended more than half of the program days, whereas a much smaller proportion (39 percent) of par-ticipants at programs without structured homework assistance attended that often (see Table 4, page 44). Combining structured homework assistance with rec-reation and other activities appears to be an effective way to attract regular participation. (For a description
TABLE 1. DEMOGRAPHIC CHARACTERISTICS OF STUDY PARTICIPANTS AND ALL STUDENTS ENROLLED IN THE SIX PROGRAMS UNDER STUDY
Race 64% African American 31% white 1% Hispanic 2% Native American 1% other 61% African American 36% white 1% Hispanic 1% Native American 1% other End-of-Grade Test Scores* 56% at or above grade level in reading and math Not available
*Scores in spring 1997, before the study began.
†The total average daily attendance of the six study programs. Study participants Overall program enrollment Ages 10 to 16 6 to 18 Number 187 1,181† Gender 51% female 49% male 52% female 48% male . . . .
of the essential components of structured homework assistance, see the sidebar, page 45.)
Community-Based Sites/Regular Transportation
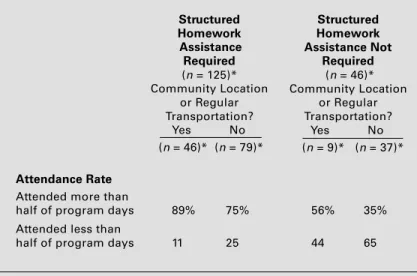
Study participants also were more likely to attend more than half of the program days at sites that were community-based or provided regular transportation. Being able to walk home from the program or having a program-provided ride was especially important in improving attendance at programs without structured homework assistance. Only 35 percent of the partici-pants attended more than half of the program days at sites with no structured homework assistance and no community location or regular transportation. In
TABLE 2. PROGRAM CHARACTERISTICS STUDIED
TABLE 3. REASONS FOR ATTENDING AN AFTER-SCHOOL PROGRAM
Definition or Description
Computers are available for participants to use at site.
High = More than 77 percent of staff members have bachelor’s degree. Low = Seventy-seven percent or less of staff members have bachelor’s degree. This figure was estimated by dividing number of field trips by total number of program days.
High = Program operates 5 days per week. Low = Program operates 4 days per week.
Participants are driven home in program vehicles at conclusion of each day. Participants receive nutritious snack each day.
This is ratio of average daily attendance at site to number of staff members. Specific group of young people is recruited either by using set of at-risk criteria or by locating program sites in areas of high concentrations of low-income youth.
This figure was estimated by dividing number of volunteer hours at program by program’s average daily attendance.
Participants regularly learn about African-American cultural identity,␣ history, and achievements through activities, field trips, discussions, and workshops. Participants are required consistently to complete homework assignments in quiet work area free from external distractions during established period each day. Participants receive individual tutorial assistance from volunteers, teachers, staff members, or peer leaders. Staff members maintain ongoing communication with participants’ teachers and parents in order to monitor their academic progress.
Participants engage in structured group activities such as marching band or drill team.
Program is located in public facility within walking distance of low-income neighborhoods, public housing communities, or public schools with high concentrations of young people.
Program is located in public school in order to serve students who attend that school.
Characteristic Computer availability
Education level of staff members
Number of field trips per program day
Number of program days
Regular transportation Snacks and refreshments Student-to-staff ratio Targeted enrollment policy*
Volunteer hours per child*
African-American cultural enrichment emphasis†
Structured homework assistance
Structured recreation emphasis
Community-based site
School-based site
*These sites had either a high number of volunteer hours per child and a targeted enrollment policy or a low number of volunteer hours per child and no targeted enrollment policy. Thus we could not relate outcomes to one characteristic or the other.
†We did not encounter any cultural enrichment emphasis other than African American.
Reason Percent Responding Yes
(n = 144)* To improve my grades in school 74
To have fun with my friends 57
Because of the sports, activities, or games 56
Because of the field trips 49
To stay out of trouble 44
Because my parents want me to attend 31 Because my parents are not home after school 15 Because my teachers or counselors asked me to 15
contrast, 56 percent of the participants attended more than half of the days at sites that were community based or had regular transportation but no structured homework assistance. Regular transportation or a com-munity site had a much smaller effect on regular atten-dance among participants at sites with structured homework assistance. More than 75 percent of stu-dents attended these sites more than half of the time. At community-based sites or sites with regular trans-portation, the proportion increased to 89 percent. (See Table 5.)
Targeted Enrollment/More Volunteers
Study participants at sites with targeted enrollment and high numbers of volunteer hours per child were nearly twice as likely to have attended more than half
AFTER-SCHOOL
PROGRAM HANDBOOK
Strategies and Effective Practices
The After-School Program Handbook: Strategies and Effective Practices presents program practices and strategies that will help communities start effective after-school programs and improve the operation of existing programs. The handbook features practices and strategies employed by the study programs that attracted high levels of student participation and helped students improve their behavior, self-esteem, and school performance. The handbook also presents various institutional practices and strate-gies that supported successful program operation. Summaries of the handbook’s chapters follow. Chapter 1 introduces the study of after-school programs conducted for the Juvenile Delin-quency Prevention Committee and describes the methods that the research team used to assess program practices.
Chapter 2 outlines the findings of other studies that have observed positive influences of after-school programs on delinquency, academic perfomance, behavior, and self-esteem.
Chapter 3 discusses the formal and informal strategies used by the programs in the study to assess the needs of young people and parents. Chapter 4 describes the institutional settings and
practices that played an important role in implementing the study programs and other after-school programs.
Chapter 5 describes the program characteristics that were systematically related to greater deterrence of delinquency and other positive differences in the lives of the study participants.
Chapter 6 features the practices and the strategies used by program managers to maintain support of after-school programs.
Chapter 7 describes measures of academic perfor-mance, behavior, delinquency, self-esteem, and other variables that can be used to evaluate the effectiveness of after-school programs.
Chapter 8 describes a wide range of local, state, and national resources to support development and operation of after-school programs.
The After-School Program Handbook is available free of charge from the Governor’s Crime Commission, phone 919/733-4564.
TABLE 4. ATTENDANCE IN RELATION TO STRUCTURED HOMEWORK ASSISTANCE
TABLE 5. ATTENDANCE IN RELATION TO STRUCTURED HOMEWORK ASSISTANCE AND LOCATION OR
TRANSPORTATION Structured Homework Assistance Required (n = 125)* Community Location or Regular Transportation? Yes No (n = 46)* (n = 79)* Structured Homework Assistance Not Required (n = 46)* Community Location or Regular Transportation? Yes No (n = 9)* (n = 37)* Attendance Rate
Attended more than
half of program days 89% 75% 56% 35% Attended less than
half of program days 11 25 44 65
Structured Homework Assistance Required Not Required (n = 125)* (n = 46)* Attendance Rate
Attended more than
half of program days 80% 39%
Attended less than half
of program days 20 61
*n = number in the subsample.
COMPONENTS OF STRUCTURED
HOMEWORK ASSISTANCE
After observing structured homework assistance at the study sites, we identified five essential components:
Adequate work area and supplies—The room and the resources available for homework assistance are critical to its success. The room must be equipped with chairs and tables that allow participants to work on their homework either on their own or as a group. In addition, the room must have adequate lighting and temperature controls, be quiet, and be free of external noises and distractions. The sites must have adequate supplies as well, including paper, calcula-tors, pencils, markers, dictionaries, and other refer-ence books.
Consistent implementation—Homework assistance must be implemented consistently each day in order for participants to become familiar with the routine and the structure of completing their homework. The amount of time allotted for homework assistance also should remain constant. At study sites it ranged from 45 minutes to an hour. Because the schools did not assign homework over the weekend, many of the study sites rewarded participants by not requiring homework assistance on Friday afternoons, thus allowing participants more time for recreation.
Tutors—All the sites that provided structured home-work assistance provided tutors to assist participants one-on-one with their school work. The tutors were volunteers, teachers, older peers, or staff members.
Communication with teachers—In after-school programs, an information gulf often exists between staff members and participants about the amount of homework assigned for the day. The programs we studied diminished this gulf by having regular communication between teachers and staff mem-bers. Regular communication with teachers was easier for staff members at school-based sites than for those at community-based sites. Some sites asked participants to maintain a homework log book that had to be signed by their teachers each day. Staff members also called or visited the teachers of participants at the beginning of the year to ensure that communication lines would remain open during the year.
Communication with parents—To ensure that program participants completed their homework assignments, staff members maintained continuous communication with parents. Staff members informed parents whether or not their child had completed his or her homework for that day. If he or she had not, parents would know to ask that the homework be completed at home.
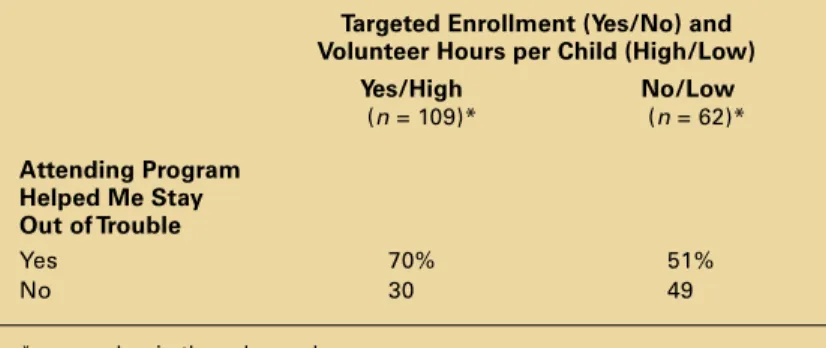
of the program days than were study participants at programs without targeted enrollment and with low numbers of volunteer hours per child. When asked whether attending the program helped them stay out of trouble, 70 percent of the study participants who attended programs with targeted enrollment and high numbers of volunteers per child said yes. Only 51 per-cent who attended programs without targeted enroll-ment and with low numbers of volunteer hours per child said the same. (See Table 6.) The latter data came from participants’ own reports; we did not have other data to confirm them.
There was no systematic relationship between any of the program characteristics analyzed and partici-pants’ school behavior. Nor was there any systematic relationship between the program characteristics and juvenile court adjudications concerning study par-ticipants. Only two of the participants were adjudi-cated delinquent or undisciplined during the period of the study.
ACADEMIC ACHIEVEMENT AND SELF-ESTEEM
To assess ways in which after-school programs might increase other positive outcomes for young people, we examined homework completion, grades in English and math, North Carolina End-of-Grade (EOG) test scores in math and reading, and self-esteem. The pro-gram characteristics that made positive differences in the lives of more study participants were structured homework assistance and an emphasis on cultural enrichment.
Structured Homework Assistance
Participants at sites with structured homework assis-tance were more likely than their peers at sites without
TABLE 6. HELP IN STAYING OUT OF TROUBLE IN RELATION TO TARGETED ENROLLMENT/VOLUNTEER HOURS
Targeted Enrollment (Yes/No) and Volunteer Hours per Child (High/Low)
Yes/High No/Low
(n = 109)* (n = 62)*
*n = number in the subsample. Attending Program Helped Me Stay Out of Trouble
Yes 70% 51%
such assistance to complete their homework at the program and to improve their performance in English and math. Time and space were routinely set aside for students to work on their homework.
Students’ motivation also is important, of course. The great majority of study participants (82 percent) who attended programs with structured homework assistance and said they attended to improve their grades in school indicated that they also finished all their homework at the program. In contrast, only 36 percent in such programs who did not say they at-tended to improve their grades reported finishing their homework. However, 58 percent of the participants who attended programs without structured homework assistance but attended to improve their grades in-dicated that they completed their homework at the program.
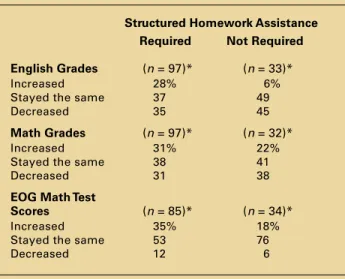
Further, 28 percent of the participants who at-tended programs with structured homework assistance increased their English grades from the previous year, versus only 6 percent who attended programs without structured homework assistance (see Table 7). The cor-relation with improvement in math grades was not as dramatic: 31 percent of the study participants who at-tended programs with structured homework assistance increased their math grades, whereas 22 percent of the study participants at programs without structured homework assistance also increased their math grades. The relationship to EOG math scores was more pro-nounced. Almost twice as many study participants (35 percent) attending programs with structured home-work assistance increased their EOG math scores as did those (18 percent) who attended programs without such assistance. Little difference was evident in EOG reading scores.
African-American Cultural Enrichment Emphasis
American participants at sites with an African-American cultural enrichment emphasis were more likely to increase or maintain their self-esteem scores than were African-American participants at sites that did not have such an emphasis. A large majority of African-American study participants (71 percent) at sites with an African-American cultural enrichment emphasis increased or maintained their self-esteem scores (as measured by the Coopersmith Self-Esteem Inventory), compared with only 47 percent of African-American participants at sites without a cultural en-richment emphasis. Put another way, more than half of the African-American participants at programs
with-TABLE 7. GRADES AND TEST SCORES IN RELATION TO STRUCTURED HOMEWORK ASSISTANCE
out an African-American cultural enrichment empha-sis had lower self-esteem scores at the end of the study. (See Table 8.)
The pattern of changes in self-esteem among African-American students who were in programs with an African-American cultural emphasis is similar to the pattern of changes in self-esteem among non-African-American participants in programs with no explicit cultural emphasis in their programming. Almost all these non-African-American participants were white (only 2 were Hispanic, 3 Native American, and 5 other). We did not attempt to measure the extent to which programs with no explicit cultural emphasis may have implicitly reinforced the dominant culture. As we ob-serve the findings in Table 8, however, we wonder whether the programs with African-American cultural emphasis may have provided their participants with the kind of positive reinforcement that many white children receive from the dominant culture.
PROGRAM FINANCES AND COSTS
The cost of serving young people at the study pro-grams is quite low. On average, the six propro-grams spent $9.13 per day on each program participant, based on average daily attendance. Other major findings about the costs of programs in the study are as follows:
•
Costs were lower at larger, multisite programs. Programs were able to maximize their cost-effectiveness by serving more young people at more sites throughout their counties. In general,Structured Homework Assistance Required Not Required English Grades (n = 97)* (n = 33)*
Increased 28% 6%
Stayed the same 37 49
Decreased 35 45
Math Grades (n = 97)* (n = 32)*
Increased 31% 22%
Stayed the same 38 41
Decreased 31 38
EOG Math Test
Scores (n = 85)* (n = 34)*
Increased 35% 18%
Stayed the same 53 76
Decreased 12 6
Coopersmith Self-Esteem Score (Total)
Increased 56% NA† 43% 65%
Stayed the same 15 NA† 4 6
Decreased 29 NA† 53 29
TABLE 8. SELF-ESTEEM IN RELATION TO AFRICAN-AMERICAN CULTURAL ENRICHMENT EMPHASIS
the larger, multisite programs were approxi-mately one-third as expensive per child as the smaller, one-site programs.
•
Costs were lowered through in-kind support and contributions. Program costs varied according to the amount of in-kind support and contributions that the programs collected. Generally, programs that had been established in their communities for long periods were more successful than other programs at pulling together resources.•
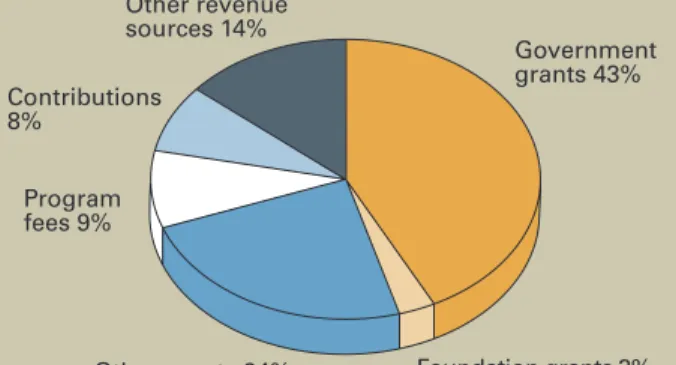
There was a high dependence on government revenues. The study programs relied heavily on government grants to support program opera-tions. Overall, the six programs in the study re-ceived 56 percent of their total dollar revenues from government sources—none of which were their local board of education or the North Caro-lina Department of Public Instruction. (For graphic illustrations of how revenue sources dif-fered for programs sponsored by governments and programs sponsored by nonprofit organiza-tions, see Figures 2 and 3.)•
Fees charged to parents were low. Three of the programs in the study charged no fees. At the three that did charge fees, parents paid a mini-mum average hourly fee of $0.08 and a maxi-mum average hourly fee of $0.71. In contrast, the National Study of Before- and After-School Pro-grams found that in 1991, after-school proPro-grams serving low-income families charged parents a minimum average hourly fee of $1.69 and a maxi-mum average hourly fee of $2.05.7 The maxi-mum average hourly fee charged by the three study programs is approximately one-third the maximum hourly average fee charged by after-school programs nationwide.LIMITATIONS OF THE STUDY’S FINDINGS
The findings reported in this article are strongly sug-gestive but not conclusive. They should be viewed with caution. We studied only six after-school pro-grams. Many other programs may have effective prac-tices that we did not observe. Moreover, we cannot comment on the absolute effect of these programs on young people because a control group of nonpartici-pants was not available. All the youth particinonpartici-pants in this study were enrolled in an after-school program. Because of time and funding restrictions, a control group was not possible. Without a group of nonpartici-pants for comparison, we cannot be certain how many of the observed improvements in young people’s self-esteem, school grades, and conduct were due to their participation in an after-school program. Rather, we have identified patterns among participants that were systematically related to program practices that we expected to affect students’ lives. For example, we found that more students in programs with a special feature such as structured homework assistance were likely to have improved their grades over the period of the study. We concluded that the structured home-work helped improve the grades for some students. Additional research is needed to investigate further the effect of after-school programs across the state.
CONCLUSION
The staff members at the six after-school programs faced significant ongoing challenges to encourage young people to attend their programs regularly. In fact, 33 percent of the study participants attended their programs less than half of the total number of days the program was offered over the study period.
African-American Students (n = 34)* Non-African-American Students (n = 0)* African-American Students (n = 51)* Non-African-American Students (n = 48)* Yes No
African-American Cultural Enrichment Emphasis?
*n = number in the subsample.
†NA = not applicable. At the programs with an African-American cultural enrichment emphasis, all the participants in the study were African American.
If after-school programs are going to make a posi-tive difference in the lives of participants and help reduce delinquency, then participants must attend regularly. The programs struggled with limited funds to provide regular transportation in rural and urban ar-eas. Their participants felt conflicts with other after-school activities such as band and sports. The programs sometimes encountered limited support and resources from the public schools and wavering levels of commit-ment from participants and their parents across the school year.
In response to the needs of after-school programs and youth, state policy makers should more effectively coordinate resources to support local programs that encourage regular attendance. This study suggests that attendance is likely to be higher in programs that target at-risk youth, provide regular transportation in rural areas, use community-based sites, and conduct struc-tured homework assistance. Further, local community leaders and program supporters should explore provid-ing structured homework assistance, community-based sites or regular transportation, and targeted enroll-ment. In terms of expense, supporting expansion of programs that already are successfully serving young people can be a low-cost way to increase the number of youth served. Also, building diverse funding bases and strong collaborations with other local agencies can help ensure continued program operation. Together these state and local strategies can help meet the
aca-demic and behavioral needs of young people by provid-ing supervised programs for them durprovid-ing the after-school hours.
NOTES
1. Patricia Seppanen, John Love, Dianne Kaplan deVries, and Lawrence Bernstein, The National Study of Before- and After-School Programs: Final Report to the Of-fice of Policy and Planning, U.S. Department of Education
(Portsmouth, N.H.: RMC Research, 1993).
2. Support Our Students (SOS) Program, at http:// www.dhhs.state.nc.us/sos.htm.
3. The criteria and the procedures used to identify and recruit at-risk youth varied by program. For example, the YMCA of Greater Winston-Salem’s SOS program broadly defined an at-risk youth as any young person who was un-supervised during the after-school hours. In contrast, Rockingham County SOS’s enrollment criteria took into account a student’s academic performance, work habits, in-terpersonal skills, family needs, self-confidence, exposure level, race, gender, and access to reliable transportation.
4. Seppanen, Love, deVries, and Bernstein, National Study, 107.
5. Seppanen, Love, deVries, and Bernstein, National Study, 39. The sample size for the South was 450 programs. 6. H. N. Snyder, M. Sickmund, and E. Poe-Yamagata,
Juvenile Offenders and Victims: 1997 Update on Violence
(Washington, D.C.: U.S. Department of Justice, Offices of Juvenile Justice and Delinquency, 1997).
7. Seppanen, Love, deVries, and Bernstein, National Study, 107.
FIGURE 2. REVENUE SOURCES OF PROGRAMS SPONSORED BY GOVERNMENTS
FIGURE 3. REVENUE SOURCES OF PROGRAMS SPONSORED BY NONPROFIT ORGANIZATIONS
Source: Adapted from Gordon Whitaker, Kyle Gray, and Barbara Roole, Developmental Analysis of After-School Programs for the Governor’s Crime Commission (Chapel Hill, N.C.: Center for Urban and Regional Studies, The University of North Carolina at Chapel Hill, Nov. 1998), 84.
Source: Adapted from Gordon Whitaker, Kyle Gray, and Barbara Roole, Developmental Analysis of After-School Programs for the Governor’s Crime Commission (Chapel Hill, N.C.: Center for Urban and Regional Studies, The University of North Carolina at Chapel Hill, Nov. 1998), 85.
Government grants 94% Program fees 1%
Contributions 2% Other revenue
sources 3% Government grants 43% Foundation grants 3% Other grants 24% Program fees 9% Contributions 8% Other revenue sources 14%