PLATFORMS AND OUTSIDERS IN PARTY NETWORKS:
THE EVOLUTION OF THE DIGITAL POLITICAL ADVERTISING NETWORK
Bridget Barrett
A thesis submitted to the faculty at the University of North Carolina at Chapel Hill in partial
fulfillment of the requirements for the degree of Master of Arts at the Hussman School of
Journalism and Media.
Chapel Hill
2020
Approved by:
Daniel Kreiss
Adam Saffer
ABSTRACT
Bridget Barrett: Platforms and Outsiders in Party Networks:
The Evolution of the Digital Political Advertising Network (Under the direction of Daniel
Kreiss)
Scholars seldom examine the companies that campaigns hire to run digital advertising. This
thesis presents the first network analysis of relationships between federal political committees (n
= 2,077) and the companies they hired for electoral digital political advertising services (
n
=
1,034) across 13 years (2003–2016) and three election cycles (2008, 2012, and 2016). The
network expanded from 333 nodes in 2008 to 2,202 nodes in 2016. In 2012 and 2016, Facebook
and Google had the highest normalized betweenness centrality (.34 and .27 in 2012 and .55 and
.24 in 2016 respectively). Given their positions in the network, Facebook and Google should be
considered consequential members of party networks. Of advertising agencies hired in the 2016
electoral cycle, 23% had no declared political specialization and were hired disproportionately
by non-incumbents. The thesis argues their motivations may not be as well-aligned with party
iv
TABLE OF CONTENTS
LIST OF TABLES AND FIGURES ... V
POLITICAL CONSULTING AND PARTY NETWORKS ... 4
COMMERCIAL ACTORS IN DIGITAL POLITICAL ADVERTISING ... 8
RESEARCH QUESTIONS ...11
METHODS ...12
DATA COLLECTION...12
CREATING THE NETWORKS ...17
MEASURES ...19
RESULTS...21
DISCUSSION ...31
PLATFORMS ARE CONSEQUENTIAL MEMBERS OF PARTY NETWORKS ...32
OUTSIDERS IN THE BUSINESS OF POLITICS ...34
LIMITATIONS ...36
CONCLUSION ...39
APPENDIX 1. ...42
APPENDIX 2. ...44
APPENDIX 3. ...58
LIST OF TABLES AND FIGURES
Table 1. Types of companies in each electoral cycle network……….. 21
Table 2. Types of political committees in each electoral cycle network………... 22
Table 3. Nodes, edges, components, and density each cycle……….23
Figure 1. Network visualizations each election cycle, with
platforms included and excluded………... 24
Table 4. Nodes with highest betweenness centrality each election cycle……….. 1
Table 5. Political and commercial agencies inside and outside the 2016 agency network……... 27
Table 6. Political committees inside and outside the primary
component of the 2016 agency network by partisanship and committee type………. 27
Figure 2. 2016 cycle network with only agencies and political committees………. 28
Table 7. Number of times types of political committees hire
types of agencies in the 2016 agency network………..29
Table 8. Counts of agencies’ membership in dyads and components
of three or more nodes in the candidate-only network………..29
Table 9. Counts of political committees’ component membership
in the 2016 candidate-only network……….. 30
Table 10. Counts of connections between types of company and
1
Political communication scholars started studying digital political advertising as soon as
political campaigns started using digital campaigning strategies (Howard, 2006). The
overwhelming focus of digital political advertising research is on its content and effects. This
research yields important findings. While the direct effects of targeted digital ads on vote choice
are often null (Broockman & Green, 2014; Hager, 2019), there is some limited evidence that this
technology can be effectively used for mobilization (Haenschen & Jennings, 2019). Substantial
research has also shown that in terms of its content, digital advertising differs significantly from
television advertising. Digital political ads have more diverse goals than television
advertisements (such as more mobilization and fundraising appeals), are less negative, less
policy focused, and more ideologically aligned (Klotz, 1998; Borah et al., 2018; Fowler et al.,
2019; Franz et al., 2020). Attention to these topics has only increased since the 2016 US
presidential election as unprecedented portions of campaigns’ budgets were spent on digital ads
and foreign actors used them to fuel division and resentment among Americans (Williams &
Gulati, 2018; Kim et al., 2018). Yet, despite the significant attention to digital political
advertising over the past twenty years and particularly after the 2016 election, there is no
comprehensive accounting in the academic literature of the companies that strategically purchase
digital ad space for political campaigns.
Dommett, Kefford, and Power’s (2020) research into the players in digital campaigning
makes a clear call to better understand the role of companies and other actors external to political
parties in electoral politics. As they note, “few attempts have hitherto been made to map the
ecosystem of actors that support parties’ digital (and indeed non-digital) campaigns” in order to
better understand how modern parties are organized and operate (p. 6). While their research
focused on Australia and the United Kingdom, the ecosystem has yet to be mapped in the United
States as well.
In the US political party system, researchers now consider many of these actors external
to formal political party organizations but working towards the same electoral goals (such as
political consultancies) as members of extended party networks (Galvin, 2016). There is growing
recognition of US parties as “informal ‘networks’ or ‘long coalitions’ of interest groups,
activists,
campaign professionals
, non-profit organizations, social movement groups, media
outlets, formal party organizations, and other various groups working toward common purposes”
(ibid, emphasis added, p. 316). Understanding how these coalitions are connected and how actors
enter and exit the network is paramount to understanding changes in party structure and
downstream consequences on the broader political system.
Political consultants are clear members of these networks, serving as partisan allies to the
major political parties and spreading communication strategies and information to candidates
(Kolodny & Logan, 1998; Nyhan and Montgomery, 2015). Companies specializing in providing
digital advertising services to campaigns have reliably been considered political consultancies in
the literature (Johnson, 2015). The industry of digital advertising within digital politics more
broadly is of particular interest not only because of its potential aforementioned effects on vote
choice and mobilization (Haenschen & Jennings, 2019; Borah et al., 2018; Fowler et al., 2019;
Franz et al., 2020) but also because of the concerns that have been raised about the ethical uses
of microtargeting, invasions of political privacy, and second-order effects on trust in political
3
While studies of digital campaigning and political consulting often imply the spread of
practices through connections between consultants and campaigns, few use network analysis
methods (for an exception, see Nyhan and Montgomery, 2015) and many sample from
pre-established lists of consultants (Grossmann, 2009; Grossmann, 2012 Kolodny & Logan, 1998).
Network analysis is a methodological tool for systematically accounting for relationships
between actors and quantifying how their positions in a network may impact opportunities,
limitations, and other outcomes (Borgatti et al., 2013). For example, one could use a political
consultancy’s position in a network to predict how similar its advertising strategies are to those
close to it in the network. A digital political advertising network in which every campaign is
connected by a few central political consultancies would potentially allow those central agencies
to quickly apply learnings from one campaign to others; a more diffused network with many
isolated actors would suggest a slower diffusion of ideas. Because of this, structural changes in
the network over time likely have downstream consequences for the strategies of candidates.
In other words, while research into political consulting has demonstrated that consultants
spread communication strategies to candidates and have a shared “state of knowledge” of their
field (Grossmann, 2009), these studies have not focused on digital advertising, rarely use
network analysis, and likely systematically miss companies without political specialization that
are working for campaigns and political committees in roles similar to political consultants.
In this thesis, I mapped the companies that provided digital advertising services to
political candidates, party committees, and other political action committees from 2003 to 2016
through a network analysis. Because of recent research demonstrating the role of companies with
no specialization in politics in political campaigns (Kreiss and McGregor, 2018; Dommett et al.,
political consultants. Through a content analysis of websites and media coverage, I coded these
companies as political agencies, commercial agencies, digital advertising platforms, other, or
unknown (n = 1,034). This analysis demonstrates how the structure of the federal digital political
advertising network has changed over time, what types of companies political committees have
paid for digital advertising services, who the most central actors are in the network, and what
types of actors are most likely to be isolated from the network.
Overall, this study has two major findings that advance the literature on political
communication and an interdisciplinary body of work on how platforms are reshaping many
domains of social and economic life. First, that Facebook and Google have become
consequential members of electoral party networks due to their overwhelmingly central positions
in the networks in the last two election cycles. Second, that advertising agencies with no political
specialization are often disconnected from the primary component of the network and that
non-incumbents are twice as likely to hire them as non-incumbents are. In the conclusion, I discuss the
implications for the study of party networks, political consulting, and political advertising raised
by these findings.
Political consulting and party networks
The business of political consulting, including digital political advertising firms, has
benefited from the decline of party organizations. Sheingate (2016) documented political
consulting’s long history dating back to the early nineteen-hundreds, and how in the 1970’s the
industry emerged fully-fledged and able to support itself between major election cycles. This
industry’s success is due in part to the development of new media and communication
technologies. Advances in technology made specialist consultants more valuable to campaigns
5
and computer-aided polling (ibid). This need for niche services was complemented by the fall of
formal party structures.
For much of the 20
thcentury, political parties in the United States were
formal, hierarchical institutions (Cohen et al., 2009). At the local, state, and even national level,
the party committees controlled nominations for office, publicity, and often fundraising (ibid).
However, legislative and party reforms in the 1970s weakened US political parties’ power,
limiting the ability of the parties to control publicity of candidates and insider-only nominating
processes (ibid).
Technology, expanded client bases, regulatory changes, and party reforms all
ushered in the business of politics.
By the early 2000’s, the business of politics was well-established and new media
technologies continued to expand the range of services that political consultants could offer.
While parties still held significant sway through issue ads and fundraising, the Bipartisan
Campaign Reform Act of 2002 further eroded these capabilities, allowing the role of political
consultants to grow further (Cohen et al., 2009).
In 2010, the Supreme Court’s infamous
Citizen’s United
decision further loosened campaign finance rules, allowing even more money to
flow from political action committees to political consultants, additionally bolstering the industry
(Sheingate, 2016). By 2012, the top ten paid consulting firms on both sides of the aisle in the
election cycle included firms specializing in digital services: Bully Pulpit Interactive, a
Democratic firm, was paid over $108 million and Targeted Victory, a Republican Firm, over
$112 million (ibid).
Howard’s (2006) work on e-politics in the late 1990’s and early 2000’s investigated firms
that provided narrow digital services, like data collection and modeling and message testing,
showing how even in the early years of digital political consulting firms filled niche roles for
Now, while campaigns may develop their own strategies and software, the knowledge they
produce is most reliably retained when it is stored outside of the campaign apparatus itself
(Kreiss, 2016). Campaign staffers founding companies that can maintain a technological or
strategic product between election cycles has been paramount to each party’s success in digital
campaigning, such as the Obama 2012 campaign’s spin-off organization Organizing for Action
(ibid). Kreiss empirically demonstrated the network of newly founded companies that the
successful campaigns create. These new political consultancies founded after major elections
join new political committees that enter the arena every election cycle as incumbents are
challenged by new candidates. The
rapid changes in digital media require parties and campaigns
to lean on these external actors for support (Kreiss, 2016; Dommett et al., 2020).
Indeed, these companies have become so important to the functioning of the US electoral
system that they are considered part of party networks. As discussed above, parties in the United
States used to be formal organizations with power over candidate choice, fundraising, and
publicity. Those powers are now distributed across candidate committees, party committees,
political action committees, political consultants, and other loosely connected actors with aligned
goals.
Galvin (2016) succinctly captures the push in political science to expand the conceptual
understanding of US political parties, arguing that parties must be understood as extended
networks or “long coalitions” of groups organized around common political purposes. These
coalitions of groups do not just include political action committees and campaigns; political
agencies, non-profits, and any other organization oriented toward a common purpose are also
included (ibid). By focusing on how parties change
in reaction
to their environment and
7
originating within
the party apparatuses (ibid). Understanding patterns in these relationships is
essential to understanding when and how political institutions changes. Changes in
the structure
of the network of companies and political committees can impact the rest of the party network as
a whole and have downstream consequences on the political system more broadly.
Political consultants explicitly fit under the wider umbrella of extended political party
networks. But, their role in legislature and party activities outside of elections is limited.
Grossmann (2012) lays out two types of party networks: electoral and legislative. These two
networks have different primary actors brought together by differing goals. Digital political
consultants are best conceptualized as members of the
electoral
party network. Kolodny and
Logan’s (1998) and Farrell et al.’s (2001) research into how political consultants view their work
and how these consultants extend the work of formal party committees also supports this view.
They found that political consultants generally see their roles as complementary to the role of
parties, and that consultants are not competitors with parties but strategic allies.
Consultants generally are in partisan alignment with their clients, and their future
financial stability depends on their reputation of success (Sheingate, 2016). In other words, their
goal is to win, just like the candidates and the parties. And, all evidence suggests that how to win
is generally agreed upon by established consulting firms. Grossmann (2009) surveyed political
consultants in order to help determine how professionalized the field has become, showing over
80% of consultants agree on multiple strategic choices without any clear data to support their
decision. This “state of knowledge” of their field showed to Grossmann a sense of
professionalization—a group of people trained in and accepting standard practices within their
field. It also illuminates an area where networks of consultants may be sharing and enforcing
investigated how consulting firms impact the negativity of campaigns, the amount of risk-taking
by a candidate, and party-owned issue messaging. These studies demonstrate the significance of
consultants in the electoral party network:
they influence the messaging choices of campaigns
in
relatively uniform ways as allies of formal party organizations without formal party
organizations having to enforce such decisions.
However, many of the studies above draw their samples from the consultants
most likely
to be professionalized. Since studies on political consulting do not often use formal network
analyses, they often make the implicit assumption that all actors are equally well-connected (for
an exception, see Nyhan & Montgomery, 2015). Such studies also tend to sample either from
lists of established political consultancies or through snowball samples starting with an existing
social relationship with a consultant (Kolodny & Logan, 1998; Grossmann, 2009; Grossman,
2012; Serazio, 2014, 2015, 2017). These sampling methods often do not include non-politically
specialized companies serving similar functions as political consultants, and such assumptions
about the connectedness of actors may obfuscate patterns of relationships that make some
candidates or consultants less likely to adopt established strategies. In other words, some of these
studies may potentially systematically ignore divergent cases. P
rior work on the industry has
primarily focused on well-established and often larger firms. These major players are clearly
important. However, the academic literature has not adequately documented who the less
connected and smaller firms are or who is more likely to hire them.
Commercial actors in digital political advertising
Historically, commercial advertising agencies have avoided political clients due to their
divisive nature; this is part of why political consultancies have found their own niche (Sheingate,
9
Dommett, Kefford, and Power’s (2020) research in Australia and the United Kingdom
highlighted the role of companies besides political consultants, outlining a “plethora of
companies” working with political parties and campaigns which had “different degrees of scope
(and resources) and with
varying degrees of loyalty”
(p. 6, emphasis added). Companies with
little political specialization working on campaigns have historically been left out of studies on
digital campaigning due to a theoretically directed focus on
political
companies. Such
non-political actors with no partisan alignment have been acknowledged by some, such as Farrell, et
al. (2001), but their existence is often only mentioned as background to the focus of the research:
companies with political specialization.
There is no strong evidence for who non-politically specialized companies service in the
industry, or if they service different types of campaigns at different rates. As a whole, the
literature lacks evidence about what proportions of digital advertising, and digital campaigning
more broadly, are conducted by politically-oriented companies versus companies with no
political focus. Dommett et al. (2020) argue that actors external to parties and campaigns,
including these commercially oriented companies, must be studied to understand the
“organizational dynamics of parties today” (p. 6).
There is a large exception to this gap in the literature: the role of platforms. Platform
companies have inserted themselves into many industries, reshaping relationships between
producers and consumers, clients and providers, and peers (Poell, van Dijck & de Waal 2018).
Within media industries, the changes wrought by platforms have been substantial. Even
well-resourced media institutions have become dependent on online platforms for internet traffic and
the associated revenue, adjusting their organizational structure and changing their practices to
platform studies has extensively documented how the affordances of platforms constrain and
enable the activities which take place on them, including the activities of political campaigns
(Bossetta, 2019). And yet, platforms are not static: their affordances change rapidly in substantial
ways, including removing the types of audiences that political campaigns can target (Barrett &
Kreiss, 2019). Meaning, how political campaigns (and political parties writ large) use platforms
are subject to change based on the changes in what platforms allow. The rise in usage of digital
advertising platforms like Facebook, Google, and Twitter has been established by both the
academic literature and the press, showing not only how digital advertising budgets have grown
over time but also how Facebook has allowed more down-ballot candidates to enter the
advertising market (Fowler et al., 2019; Williams & Gulati, 2018).
But, platforms are not neutral players within political campaigns; in fact, they shape
political communication in more ways than by what their affordances enable and constrain.
Kreiss and McGregor (2018) revealed how technology companies including Facebook and
Google act as political consultants for some campaigns, helping them not only troubleshoot their
products but also advising them on how to use them strategically, from the types of search ads to
buy on Google and how best to target them in an election (bidding on other candidates’ names)
to how to find and capitalize on specific audiences using the data provided by the platform. In
other words,
they influenced the messaging choices of campaigns
. These companies’ account
teams also recreated the structure of political consultancies, with political teams broken out by
party so that employees (hired out of electoral politics) only served campaigns with which they
were ideologically aligned (ibid). Unintentionally, the companies provided such services
differentially: some campaigns turned down offers of this strategic advice while others took full
11
active players in electoral politics, more akin to political consultants than neutral content
distribution platforms. In this way, these companies with no declared partisanship or mission
aligned with party goals may yet be seen as potential members of the electoral party network.
However, the position of digital advertising platforms in the federal digital advertising network is
heretofore unknown. Even if they could be considered members of the electoral party network,
would they be in any way consequential to the party network as a whole? In other words, do they
hold a central or otherwise meaningful position in the party electoral party network? Has their
position changed over time?
Ultimately, we know very little about how often political committees work with
commercial advertising agencies rather than political agencies, what types of political
committees are most likely to work with these commercially-focused actors, and what position
digital advertising platforms hold in the federal electoral digital advertising network, or how any
of this has changed over time. A comprehensive investigation into who the players in this rapidly
expanding, contentious sector of politics are and how they are connected is overdue.
Research questions
This study analyzes political digital advertising companies as part of extended party
networks in line with recent calls in political science to better account for the role of these
coalitions through network analysis. Based on recent attention to the role of companies without
political expertise, I also ask what types of companies beyond political consultants are hired for
these services and where they are positioned in the network.
This study documents the digital political advertising network in terms of its structure,
most central nodes, isolated nodes, and the different types of companies and political committees
RQ1: What is the structure of the network of digital political advertising in each of
the four election cycles? How does it differ by party?
RQ2: What types of organizations have political campaigns and committees
historically turned to for digital advertising services?
RQ3: Who are the most central actors, and how does this change over time? What
types of digital advertising providers and political committees are most central to the
network?
RQ4: What types of political committees and digital advertising providers are most
likely to be isolated from the network?
Methods
Data collection
This study created a two-mode, sociocentric network of federal political committees and
the companies they hired for digital advertising services. Sociocentric studies include all nodes in
a universe and all the relevant connections between them; two-mode networks have two different
types of nodes which are connected to each other, in this case the digital advertising providers
and their clients, the political committees (Borgatti et al., 2013). Political committees and
companies are connected by payments reported to the Federal Election Commission (FEC).
Candidates’ campaign committees, political action committees, and party committees
participating in federal elections either through their candidacy or their purchases of
communications in support of or in opposition to candidates all must report their spending to the
FEC (Browse data, n.d.). Three types of filings to the FEC are used in this analysis. The first,
disbursements, are payments made from campaign committees. The second, independent
13
candidate but are not coordinated with any candidate. Finally, party coordinated expenditures are
payments made by state or national political party committees about the general election of a
candidate.
Federal Election Commission (FEC) disbursement, party coordinated expenditure, and
independent expenditure data from 2003 to 2016 were downloaded. (Disbursement data was
filtered prior to download with extremely overinclusive keywords in order to lower the number
of cases to the max download limit.) These datasets include who the committee paid, for what
reason, for what election year, and for how much money as well as additional information
depending on the dataset and committee type. All datasets include unique committee numbers
assigned by the FEC to each political committee. While the
campaign
disbursement data and the
party coordinated expenditures
(money spent by state and national committees related to a
general election) are available from January, 2003 to December, 2016,
independent expenditure
data is only available 2010 to 2016, as 2010 marked the beginning of these types of contributions
legally and filing with the FEC. There are additional significant payments missing from this
dataset due to changes in what committees are required to file: before 2010 no Senate candidate
spending is included. This is the most complete dataset of digital political spending despite its
limitations.
Cases were included in the analysis based on the purpose of the payment and who it was
paid to. This information was filled out by the committees in their quarterly filings for each
payment they made—the fields on the FEC forms for this information were free-text entry,
meaning political committees were not selecting purposes of the payment or companies from a
drop-down list. They entered this information however they saw fit. Developing the keyword
First, I read through the descriptions used by committees each election cycle for common digital
advertising services, such as any payments made to Facebook, Google Adwords, or Twitter. I
then developed different combinations and variations of those words used to describe these
purchases and looked for common recipients of these payments I was not familiar with, such as
PressFlex, Adready, and Audience Partners. I then downloaded all payments to those recipients
(such PressFlex, Adready or Audience Partners) and incorporated additional terms used to
describe digital advertising payments to these companies. Cases were included for further
cleaning if they had any of the 66 inclusion criteria keywords and terms (Appendix 1).
Creating the exclusion criteria (Appendix 1) was a similarly iterative process. After
creating the inclusion criteria, I looked through the recipients of such payments for companies
which were clearly not actually digital advertising service providers to find the keywords they
had in common. Any cases which included terms that suggested the primary reason for the
payment was irrelevant to paid digital media (such as “administrative,” “hosting,” or “camera”)
were excluded. In addition, recipients such as American Express, Capitol One, or Paypal were
excluded from the analysis. Payments to these companies were often described as “facebook
ads” or “google ads” and were often duplicative of payments to those platforms. A hypothetical
example of this scenario is that a political committee paid for Facebook ads with a Capitol One
credit card and reported paying off the credit card as “Facebook ads” as well as reported paying
Facebook for the Facebook ads. However, it is possible that some of these were unique in that
the payment to Facebook was never reported—only the payment to Capitol One was. This is a
limitation of the data. The data cleaning and coding process continued to surface irrelevant
companies such as BestBuy, FedEx, Whole Foods, and Econolodge Motel. These companies
15
often related to advertising production expenses, such as purchasing equipment to shoot an
advertisement or lodging at a production site.
After selecting cases for inclusion based on the purpose of the payment, the names of the
companies and individuals paid for these services had to be cleaned. This “recipient” field was
also free-text entry, so company names were not standardized. I developed a data-cleaning
protocol including removing “INC,” “COM,” “LLC,” and “ORG” as well as all punctuation that
collapsed many of the typos and misnamed organizations. This left 1,804 names of organizations
that were recipients of campaign and committee payments for digital advertising services
between 2003 and 2018. These companies were then examined manually to combine misnamed
cases of the same companies (for example, Liston Adelstein Media, Adelstein Liston Media, and
AL Media were all determined to be the same company; they were renamed and combined into
“Adelstein Liston”). The disbursement data included the state, city, and zip code of the company
paid, which helped immensely in this process. However, the independent expenditure data and
the party coordinated expense data did not. This limitation is expanded upon in the limitations
section.
Individuals were removed, as well as in-kind contributions and other political
committees. Companies that received under one thousand dollars in payments from campaigns
over the last four election cycles were also excluded from the analysis. Since the goal of this
research is to understand the federal digital political advertising network, I chose to remove these
payments that looked more like “test” budgets that were not continued rather than substantive
relationships between a political committee and a company over time.
In addition to case selection based on keywords and total spending, cases were excluded
was blank, the year the payment was made was used instead. If this field was blank or outside of
the election cycles under investigation, or if the election year was incorrect (such as 2049), the
case was dropped from the analysis. Ultimately, 1,034 companies were included in the analysis
(Appendix 2).
Political committees were tied back to additional Federal Election Commission data
through their committee ID and associated candidate IDs. This included the party they registered
under (partisanship) and if the committee was a candidate committee, party committee, or some
other political action committee (committee type). These committee types were collapsed from
FEC committee type codes (Committee type code descriptions, n.d.). “Candidate” committees
are FEC committee type codes H, S, and P; “Parties” are X and Y; “Other PACs” are E, I, N, O,
Q, U, V, and W. House and Senate candidate committees in the 2016 election were also coded as
incumbent, non-incumbent, or unknown (incumbency). “Unknown” included senators not up for
reelection and candidates that never made it onto the official ballot. Overall, 2,077 political
committees were included in the analysis (Appendix 3).
The companies were coded into one of three theoretically important and distinct
categories: political consulting firms that offer media buying services (political agencies),
advertising agencies with no claim to political expertise (commercial agencies), and platforms
that advertisers use for digital advertising buys (digital advertising platforms). Everything else
was coded as other. Any companies which were unable to be identified were placed into an
“unknown” category. A trained second coder analyzed 10% of the companies that were able to
be categorized and intercoder reliability was within acceptable levels (Crohnbach’s Alpha = .82,
n = 108). Digital advertising platforms were operationalized as companies that gave advertisers
17
platform does not produce but does coordinate advertising on. Commercial agencies are
companies that provide media-buying services for their clients and do not feature keywords such
as “political campaign,” “advocacy,” “public affairs,” or “voters” on their website. Political
agencies are companies that provide media-buying services for their clients and
did
cite political
expertise or specialization on their website. While these categories are of interest based on the
literature, this coding scheme does not capture the wide variety of companies within the “other”
category. Such companies included local television stations, national mainstream news
publishers, video production companies, data brokers, niche advertising technology companies,
and partisan news sites.
Creating the networks
The networks of political advertisers and digital advertising providers here are
represented through payments from a political committee to a company that provided digital
advertising services. This is a two-mode committee-by-company network, meaning that political
committees are connected to companies through their payments, but companies and political
committees are not connected to themselves. Google cannot be connected directly to Facebook
nor can Donald J Trump for President be connected directly to Great America PAC. Both
political committees and companies are nodes in the network.
To investigate the changing relationships over time, I broke the data into four election
cycles based on the “election year” listed on the FEC filings. The first included FEC filings from
2003 and 2004, representing the 2004 presidential cycle. Filings from 2005-2008 were
categorized as “2008,” filings from 2009-2012 are categorized as “2012,” and finally filings
Unfortunately, the 2004 network was the subject of significant limitations. After breaking
out the networks and looking at them both as raw data and visualizations, it became clear that the
inclusion and exclusion criteria was unable to accurately include cases as far back as 2004. The
language used by campaigns in FEC filings during this time was too vague and dated to
adequately filter. This is not surprising: much research has documented the rapid changes in
digital campaigning and specialization (Kreiss, 2012; Kreiss, 2016).
The changes in language are natural extension of this. For example, the Howard Dean
campaign did not appear in the 2004 network due to its use of “web services” to describe every
single digital-related expense. “Web services” and “website services” in the other cycles was
most often used to refer to what looked like website development and hosting services. These
payments are made to political agencies in the network, but are also often made to GoDaddy,
Wix.com, and Squarespace. The political agencies were often recipients of payments from the
same political committees for clearly digital advertising services (e.g., being paid for “web
services” but also being paid for “digital advertising” implying that these were distinct services).
I made the decision not to include the “web services” and “website services” keywords in the
inclusion criteria in order to be sure that the relationships in this network actually represented
digital advertising. Due to these limitations, the 2004 cycle was dropped from the analyses.
In order to better understand the role of agencies with and without political specialization,
I also created a network from the 2016 cycle (2013-2016) with all company types besides
political and commercial agencies removed. This is referred to as the “2016 agency network.” To
further understand what types of campaigns and committees hire different types of agencies,
19
the 2016 election (2014 not included) and the agencies they hired (other company types not
included). This is referred to as the “2016 candidate-only network.”
Measures
The research questions require descriptive network analysis measures at both the network
and nodal level. To describe the general structure of the digital political advertising network over
each election cycle (RQ1), I use network-level measures of components and density. These
measures are descriptors of the entire network rather than individual nodes. A component of a
network is a maximal group in which “every node can reach every other by some path” (Borgatti
et al., 2013 p.16). In other words, components are separated groups of nodes within the overall
network. A network can consist of a single component in which all nodes can reach each other or
multiple components that have no connections between them.
In network analysis, density in a network is the proportion of actual connections out of all
possible connections. If the density of this network were 50%, this would signify that every
digital advertising provider—from Facebook to Republican consulting firm Targeted Victory—
was connected to every political committee. In this two-mode network, committees cannot be
connected to each other, nor can advertising providers. This means that the highest possible
density measure would be 50% rather than the 100% in a one-mode network in which all nodes
could be connected to one another. Understanding if the network becomes more connected over
time and which components are more connected will inform likely sites of homogenous practices
and potentially quickly diffused advertising strategies. It will also demonstrate how the industry
is growing—a network gaining in density may show a consolidation of political committees
around the same companies while a network decreasing in density may show an increase in both
RQ2 (what types of organizations political committees have historically turned to for
digital advertising services) will be answered by the categorization of providers and simple
counts of connections between the types of committees and the types of companies each electoral
cycle.
To answer RQ3 (who the most central actors are and how these change over time),
normalized betweenness centrality was used. Instead of simply counting how many connections
a node has (degree centrality) betweenness centrality measures how often a node is on the
shortest pathway between other nodes (Freeman, 1978). In a perfect star with one node serving
as the connection between all other nodes, the central node would receive a betweenness
centrality score of one; all other nodes would have a score of zero. Betweenness centrality is
often a measure for finding the nodes that bridge a network, representing nodes who may control
the flow of resources or information in a system (ibid). This score for each node is normalized as
a ratio of that node’s value over the highest possible value of betweenness centrality in the
network (ibid).
Component measures are also used to answer RQ4, who is isolated from the network, by
comparing the companies and committees within the primary component of the network against
those outside of it in the 2016 agency network.
Nodes were assigned a 0 or 1 “component
membership” value. All nodes attached to the primary component received a value of 1 and all
nodes not connected to the primary component received a value of 0. To understand the role of
incumbency, a similar “component membership” coding was used on the 2016 candidate-only
network. This network, however, had six components of 10 or more nodes and the rest primarily
dyads (rather than a single primary component). The primary component membership value was
21
only two nodes in them were assigned a value of 0; nodes in any component of the network with
more than two nodes were assigned a value of one. This membership value thus compares the
most disconnected members of the network against all other nodes.
Results
Tables 1 and 2 describe the 2008, 2012, and 2016 networks through the numbers of
companies of each type and the number of political committees of each type in the networks. The
digital political advertising network has expanded since the 2008 election cycle through both
companies and political committees. In terms of the types of companies that political committees
hire, 20 political agencies were in the network in 2008 compared to 270 in 2016. Almost 40% of
Table 1
Types of companies in each electoral cycle network
Company Type
Brief Description
2008
2012
2016
Political agencies
Political consultancies such as
Targeted Victory or Blue State
Digital.
20
157
270
Commercial agencies
Firms whose website did not
specify any political
specialization.
18
47
81
Digital advertising
platforms
Companies who place ads next to
content that they host or manage
but do not create such as
Facebook or Google.
26
24
28
Other
Publishers, production companies,
data and analytic tools, etc.
96
118
168
Unknown
Company names that could not be
identified.
20
64
92
Total companies in the network each cycle:
180
410
639
all companies listed as recipients of digital advertising spending from 2013–2016 were political
agencies, compared to only 11% just two cycles earlier. While there were just as many
commercial agencies in the network as political agencies in 2008, by 2016 the increase in
political agencies far out-passed commercial. However, 23% of agencies in the 2016 network
were still
not
political. The number of digital advertising platforms in the network has stayed
fairly constant since 2008, varying from 24 to 28. As the network analyses will show, the
increase in the number of companies over time does not necessarily mean anything for their
position in the network, nor does a lack of an increase.
As noted above, more political committees have been using digital advertising companies
each cycle—this increase is not limited to one party or another. Table 2 shows the counts of
different types of political committees each election cycle broken out by partisanship. Notably,
Table 2
Types of political committees in each electoral cycle network
Candidate committees
Party committees
Other PACs
2008
Total
119
24
21
Democratic 69 19 1
Republican 34 3 1
Other 16 2 19
2012
Total
530
66
321
Democratic 191 35 7
Republican 296 28 29
Other 43 3 285
2016
Total
857
81
445
Democratic 329 40 10
Republican 466 36 17
Other 62 5 418
23
418 of such PACs in 2016 were not registered as Democratic or Republican. As is the case with
much of the data from the Federal Election Commission, this change is difficult to interpret.
Such “unaffiliated” designations do not necessarily reflect a neutral partisan identity. Examples
of PACs without Republican or Democratic political affiliations listed are the Vote Hillary PAC,
Santorum 2006, and Moveon.org Political Action. With the data provided, it is difficult to
discern any party differences in the use of these PACs. The rise of PACs using digital advertising
companies is a reliable and noteworthy empirical finding—the fact that many of them are not
affiliated with the Democratic or Republican party is not.
RQ1 asked what the structure of the network was each election cycle and how this
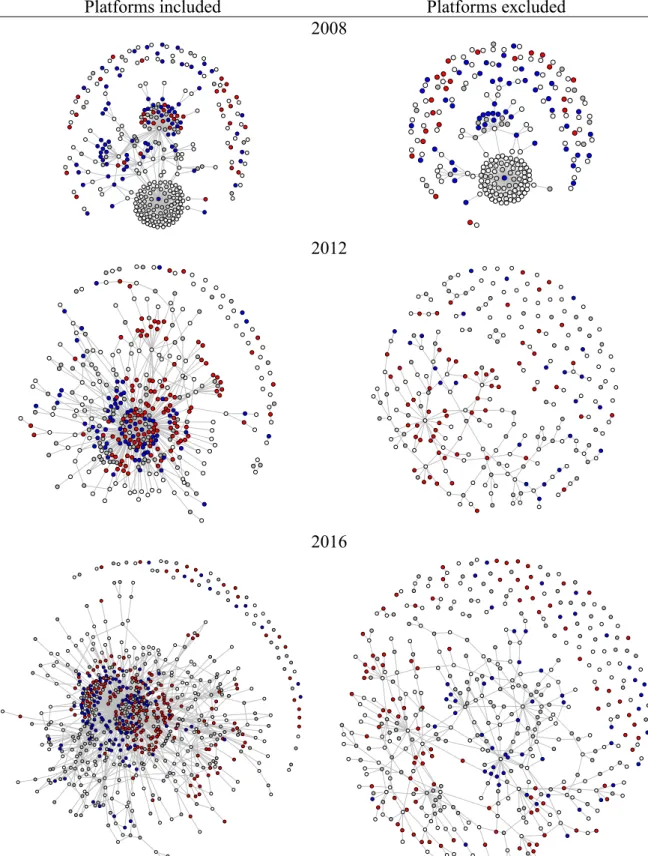
differed by party. The visualizations on the left of Figure 1 include all company types in the
network. When these visualizations, density, and betweenness centrality measures were run, a
single finding was clear: in 2008, 2012, and 2016, platforms are the most central members of the
network. Their very inclusion made any other nuances of the network impossible to discern. In
order to better see the other relationships within the network, the same analyses were run with
platforms removed from the analyses.
The structure of the networks is consistently a single primary component that includes
both Democratic and Republican committees with many, much smaller components of two to
Table 3
Nodes, edges, components, and density each cycle
Platforms included
Platforms excluded
Cycle Nodes Edges Components Density Nodes Edges Components Density
2008
333
317
43
5.76%
245
198
51
0.66%
Platforms included
Platforms excluded
2008
2012
2016
Table 4
Nodes with highest betweenness centrality each election cycle
Platforms included
Platforms excluded
Node
Node type
Normalized
Betweenness
Centrality
Node
Node type
Normalized
Betweenness
Centrality
2008
Obama For America
Candidate - Dem
0.38
Obama For America
Candidate - Dem
0.25
Platform
0.25
Pressflex
Other
0.11
Pressflex
Other
0.08
Udall For Us All
Candidate - Dem
0.03
Udall For Us All
Candidate - Dem
0.04
MSHC Partners
Political agency
0.03
MSHC Partners
Political agency
0.04
Moveon.org
PAC - Other
0.02
2012
Platform
0.34
Harris Media
Political agency
0.14
Platform
0.27
Newt 2012
Candidate - Rep
0.12
Audience Partners
Political agency
0.07
Craigslist
Other
0.12
CD
Unknown
0.03
Audience Partners
Political agency
0.12
Targeted Victory
Political agency
0.03
Deep Strike PAC
PAC - Rep
0.10
2016
Platform
0.55
Targeted Victory
Political agency
0.11
Platform
0.14
Revolution Messaging
Political agency
0.09
Targeted Victory
Political agency
0.04
Audience Partners
Political agency
0.08
Americans For
Prosperity
PAC - Other
0.03
US Chamber of
Commerce
PAC - Other
0.07
Audience Partners
Political agency
0.03
Rising Tide Interactive
Political agency
0.06
four nodes (Figure 1). Only when platforms are removed from the analyses are clusters of blue
and red visible in the networks (Figure 1). Facebook and Google make these primary
components larger and more centralized when platforms are included. In 2016, 695 political
committees listed
only
platforms in their FEC filings for digital advertising services (Table 3). In
the top five nodes with the highest betweenness centrality, Google consistently holds the second
spot every cycle and Facebook has the highest centrality in both 2012 and 2016 (Table 4). When
platforms are removed, political agencies are four out of five of the most central nodes in 2016.
From the basic descriptive tables about who is in the network (Tables 1 and 2), 81
commercial agencies were hired in 2016. This accounted for approximately a quarter of all
agencies hired during that election cycle. However, this tells us nothing about their position in
the network itself. The 2016 agency network represents the advertising agencies that political
committees hired from 2013 to 2016 to purchase digital media on their behalf (Figure 2). These
agencies are choosing how to buy media on behalf of political committees and thus serve a more
clearly strategic partnership than can be assumed of all other types of companies in the network.
This network should be seen as the primary digital advertising consultants that political
advertisers turn to.
Like the networks including all types of companies, this network also has a single large
component with many agencies and political committees unconnected to this primary
component. Unlike many of the previous figures, Republican and Democratic sides of the major
component are now clearly visible.
Table 5 displays the counts of political and commercial agencies inside and outside of
this component. While political agencies are inside the primary component 60% of time and
outside of it 40% of the time, this is swapped for commercial agencies: these companies are only
27
coding criteria for political and commercial agencies, political agencies were coded to be
over-inclusive, including any mention of political campaigns, voters, public policy, or advocacy on
their websites. Meaning, these commercial companies are not only often typically disconnected
from the primary component of the network, but they also make absolutely no claim to political
expertise or experience on their websites.
Table 6 shows a similar breakdown of types of political committees inside and outside
the primary component. Democratic political committees and party committees have the lowest
proportion of cases that appear outside the primary component, but there are no types of political
committees that are more often found outside the primary component than within it.
Table 5
Political and commercial agencies inside and outside the 2016 agency network
Political agencies
Commercial agencies
# of nodes
% of total
# of nodes
% of total
Inside
161
60%
33
41%
Outside
109
40%
48
59%
Table 6
Political committees inside and outside the primary component of the 2016 agency network by
partisanship and committee type
Democratic
Republican
Other
# of nodes % of total # of nodes % of total
# of nodes
% of total
Inside
127
85%
201
74%
215
73%
Outside
32
15%
69
26%
81
27%
Candidate
Party
Other PAC
Inside
290
75%
37
86%
216
74%
Figure 2. 2016 cycle network with only agencies and political committees.
Note: Nodes with two or less connections removed for improved visualization. Only companies and political committees with more than two or more visible connections are labeled. White nodes are companies. Circles are political agencies, squares are commercial agencies. Colored nodes are political committees. Red = Republican, blue = Democratic, grey = other.
C00487363 C00461046 C00492595 C00343459 C00473918 C00484642 C00487470 C00489799 C00488742 C00543256 C00546853 C00540443 C00620518 C00582809 C00588772 C00569517 C00143743 C00573261 C00624056 C00608489 C00620971 C90013285 C90005471 C90015256 C00566208 C00571703 GMMB SKD KNICKERBOCKER CAMPAIGN SOLUTIONS MANDATE MEDIA
RALSTON LAPP MEDIA
ANNE LEWIS STRATEGIES
AUDIENCE PARTNERS
BULLY PULPIT
TARGETED VICTORY
RISING TIDE INTERACTIVE
GILLIARD BLANNING HARRIS MEDIA
RICHARD SALES MEDIA
TALBOT DIGITAL ACTIVE ENGAGEMENT CRAFT MEDIA POLITICAL MEDIA REVOLUTION KULLY HALL REVOLUTION MESSAGING CONNECTIVIST MEDIA
NEW MEDIA FIRM ARENA MUNICATIONS
VICTORY ENTERPRISES
NEW PARTNERS DIGITAL TURF
JAMESTOWN ASSOCIATES
CHAMBERS LOPEZ STRATEGIES
DDC ADVOCACY
PUSH DIGITAL
CAMPAIGN WORKSHOP STRATEGIC PARTNERS MEDIA ACQUIRE DIGITAL
INDIGO STRATEGIES SRCP MEDIA
THE CAMPAIGN GROUP SCREEN STRATEGIES MEDIA
CAVALRY
PRECISION STRATEGIES
MOTHERSHIP STRATEGIES
BASK DIGITAL MEDIA
TARGET ENTERPRISES
SOLIDARITY STRATEGIES
JVA CAMPAIGNS
ADVICTORY
76 WORDS DIXON DAVIS MEDIA MOXIE MEDIA
MENTZER MEDIA SERVICES