CANCER, CHEMOTHERAPY & COGNITION: A COMPREHENSIVE APPROACH
Marc Douglas Rudolph
A thesis submitted to the faculty at the University of North Carolina at Chapel
Hill in partial fulfillment of the requirements for the degree of Master of Arts in the Psychology & Neuroscience program in the School of Arts & Sciences.
Chapel Hill 2020
© 2020
ABSTRACT
Marc Douglas Rudolph: Cancer, Chemotherapy & Cognition: A Comprehensive Approach (Under the direction of Jessica R. Cohen)
TABLE OF CONTENTS
LIST OF FIGURES ... vi
LIST OF TABLES ... vii
LIST OF ABBREVIATIONS ... viii
INTRODUCTION ... 1
Assessment & Cognition in BCS ... 4
Mechanisms & Contributing Factors of CRCI ... 8
Post-Treatment Cognitive Impairment. ... 9
Modeling & Prediction ... 12
RATIONALE & APPROACH ... 21
METHODS & MATERIALS ... 24
Overall Procedure ... 24
Experimental Cognitive Neuroscience Paradigms ... 29
Machine Learning & Random Forest Classification ... 34
ANALYSES & HYPOTHESES ... 38
RESULTS ... 40
Primary Aim 1 ... 41
Primary Aim 2 ... 42
Exploratory Aim 3 ... 43
Model comparisons ... 45
Univariate Group Comparisons ... 46
Classification Performance & Feature Importance ... 47
Limitations & Future Directions ... 51
Classification & Prediction ... 52
Random Forest ... 56
Task Design ... 56
CONCLUSION ... 58
SUPPLEMENTAL FIGURES & TABLES ... 60
LIST OF FIGURES
Figure 1. The complexity of CRCI ... 3
Figure 2. Simplified decision tree ... 17
Figure 3. Random forest model... 20
Figure 4. Relational and Item Specific Encoding Task... 30
Figure 5. Dot Pattern Expectancy Task ... 32
Figure 6. Cued Cognitive Flexibility Task ... 33
Figure 7. ROC analyses and cross-validated classification performance ... 43
Figure 8. Cross-validated feature performance ... 44
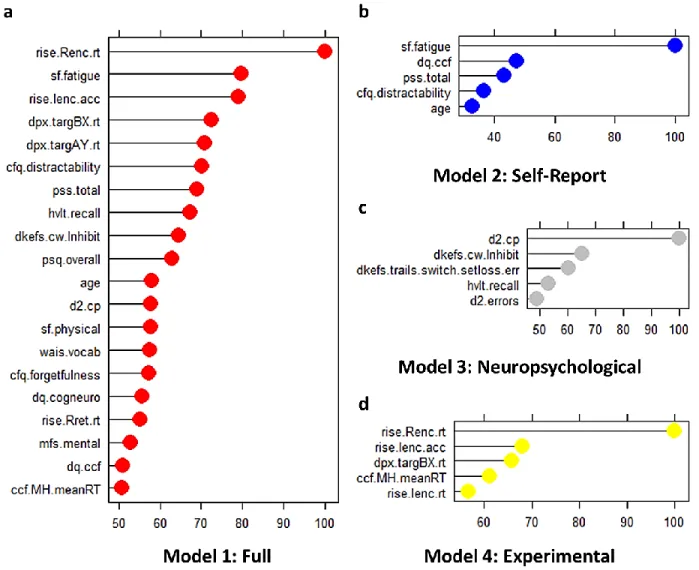
Figure 9. Final model performance & feature importance rankings ... 46
Figure 10. Associations between neuropsychological and experimental cognitive neuroscience-based features that were retained in the final reduced model ... 49
Figure 11. Linear relationships between self-reported cognitive impairment, time since treatment, and predicted class probability ... 53
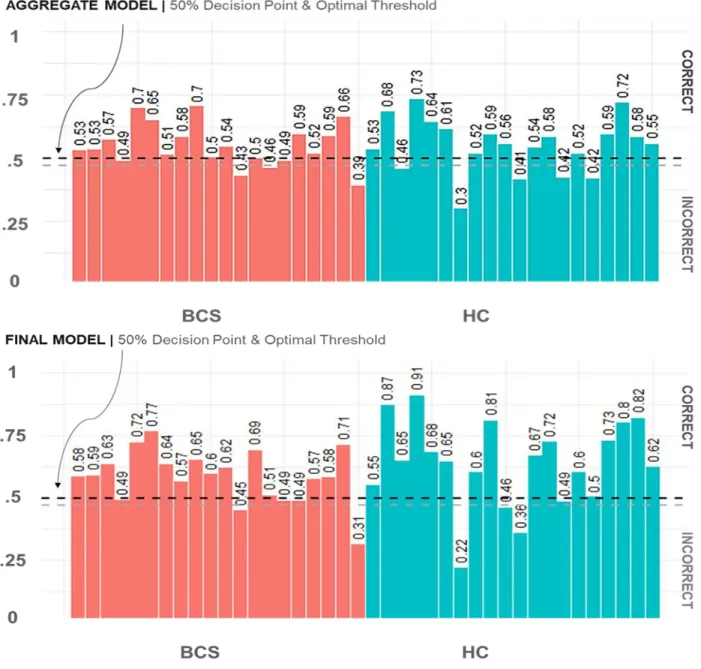
Figure 12. Model predictions for individual participants... 54
Figure 13. Full aggregate & final reduced model cross-validated predicted class probabilities ... 55
Supplemental Figure 1. Correlation structure for self-report measures. ... 60
Supplemental Figure 2. Correlation structure for neuropsychological assessments. ... 61
Supplemental Figure 3. Correlation structure for experimental cognitive neuroscience metrics. ... 62
Supplemental Figure 4. Distribution on self-report measures. ... 63
Supplemental Figure 5. Distribution of performance on neuropsychological assessments ... 64
LIST OF TABLES
Table 1. Sample Characteristics ... 26
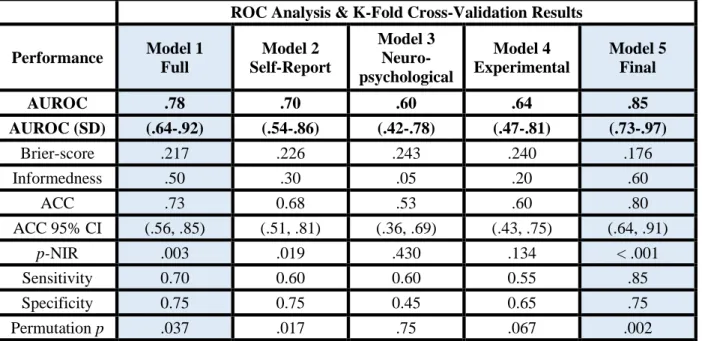
Table 2. Roc analysis and cross-validated classification results ... 46
Supplemental Table 1. Features included in the current analysis ... 66
LIST OF ABBREVIATIONS
ACC Accuracy
AUROC Area Under the Receiver Operating Curve BCS Breast Cancer Survivor
BDI Beck Depression Inventory
CFQ The Broadbent Cognitive Failure Questionnaire CI Confidence Interval
CNTRACs Cognitive Neuroscience Test Reliability and Clinical Applications for Schizophrenia CRCI Chemotherapy-related cognitive impairment
CT Chemotherapy
CV Cross-Validation
ddAC Dose-Dense Adjuvant Doxorubicin and Cyclophosphamide
ddAC+PAC Dose-Dense Adjuvant Doxorubicin and Cyclophosphamide Plus Paclitaxel DKEFS Delis-Kaplan Executive Function System
DMN Default Mode Network DPX Dot Pattern Expectancy Task DQ Debriefing Questionnaires EDA Exploratory Data Analysis EF Executive Function
EXP Experimental Cognitive Neuroscience Model FDR False-Discovery Rate
FINAL Final Reduced Model
fMRI Functional Magnetic Resonance Imaging FULL Full Aggregate Model
HIPAA Health Insurance Portability and Accountability Act of 1996 HVLT Hopkins Verbal Learning Test
HVLT Hopkins Verbal Learning Test-Revised
MFS Multidimensional Fatigue Symptom Inventory Short Form NIR No Information Rate
NP Neuropsychological Model PAC Paclitaxel
p-NIR No Information Rate P-Value PSQ Pittsburgh Sleep Quality Index PSS Perceived Sleep Scale
RAVLT Rey Auditory Verbal Learning Test RISE Relational Item and Encoding Task ROC Receiver Operating Curve
RT Response Time
SENS Sensitivity
SF 36-Item Short-Form Health Survey SPEC Specificity
INTRODUCTION
Breast cancer is a costly medical condition that afflicts nearly 12.4% of American women during their lifetime and is the most common form of cancer in women worldwide. With advancements in screening and treatment, breast cancer survivorship is on the rise with an average 5-year survival rate of 89.7% in the United States (Howlader N, Noone AM, Krapcho M, 2016); globally, incidence and survival rates can vary substantially (WHO, 2008). With increasing rates of survivorship and relatively stable rates of newly diagnosed cases annually, the number of women living with breast cancer faces an upward trend (Howlader N, Noone AM, Krapcho M, 2016). Breast cancer treatment, particularly treatment with adjuvant (post-surgery) chemotherapy, is associated with persistent cognitive impairment in a substantial portion of breast cancer survivors (BCS) (Janelsins et al., 2017a; Joly et al., 2015; Jung et al., 2017; Wefel, Vardy, Ahles, & Schagen, 2011). Though highly variable, up to 80% of breast cancer patients report some form of cognitive impairment before, during, or after treatment with chemotherapy. Such impairment has been shown to negatively impact an individual’s quality of life and interfere with skills of daily living (Janelsins, Kesler, Ahles, & Morrow, 2014; Myers, 2013; Wefel, Vardy, et al., 2011).
Chemotherapy-related cognitive impairment (CRCI) is likely multifaceted (Figure 1); paired with an individual’s physical and mental health status, multiple confounds and contributing risk factors (e.g. age, genetics, stress, fatigue, & depression) have been shown to alter the magnitude and trajectory of CRCI in various cognitive domains (Ahles et al., 2010; Janelsins et al., 2017b; Jenkins et al., 2006; Saykin, Ahles, & McDonald, 2003). Cognitive impairment has been linked to cancer pathology and treatment with chemotherapy via disruptions in DNA-repair mechanisms, compromised immune
chemotherapeutic toxicity in both human and animal models (Ahles & Saykin, 2007; J. Dietrich, Prust, & Kaiser, 2015; Merriman, Von Ah, Miaskowski, & Aouizerat, 2013; Pendergrass, Targum, & Harrison, 2018).
Crucially, at present there is no consensus regarding the presence or magnitude of cognitive impairment in any one given cognitive domain. Such inconsistencies stem from methodological
variability and the use of neuropsychological assessments designed to detect broad, non-specific deficits in general cognitive functioning. A history of neuropsychology highlights efforts to describe general cognitive dysfunction based on properties that can be localized to specific brain regions based on clinical presentation in single case studies with major neurological damage (Horowitz et al., 2018; Ruff, 2003). These assessments may lack the sensitivity to detect subtle cognitive impairment with any precision in clinical samples such as in BCS (Horowitz, Suls, & Treviño, 2018; Silverstein, 2008; Vardy, Wefel, Ahles, Tannock, & Schagen, 2008). As highlighted within several recent large-scale meta-analyses, impairments in BCS are most commonly found in the cognitive domains of attention, memory, and executive functioning, with additional consistent reports of impaired processing speed (Jansen, Miaskowski, Dodd, & Dowling, 2007; Jim et al., 2012; Lindner et al., 2014; Ono et al., 2015; Yao, Bernstein, & Rich, 2017). Whether the impairment is specific to cancer, cancer treatment, or some combination of factors as a function of age, requires further evaluation (Loh et al., 2016; Mandelblatt et al., 2013). As highlighted by Ahles & Hurria (2018), current challenges in cancer treatment, CRCI and psycho-oncology research revolve around the number of possible determinants (e.g. contributing risk factors) implicated in CRCI. Each determinant has the potential to impact the presence, type, severity and trajectory of either perceived or objectively measured cognitive impairment in heterogeneous patient and non-patient samples (see Figure 1; Ahles & Hurria, 2018).
Symptoms of fatigue, sleep disturbances, stress, and depression have all been reported in conjunction with cognitive complaints before, during (Hermelink et al., 2015; Scherling, Collins, MacKenzie, Bielajew, & Smith, 2011; Wefel, Vidrine, et al., 2011), and after treatment with
2015; Joly et al., 2015; Vearncombe et al., 2009). As stated above, age may also be a determining factor. Increases in life expectancy have resulted in higher proportions of elderly individuals (≥65) diagnosed with breast cancer annually. Cognitive decline is a part of normative aging, yet investigations into the specific cognitive impairments faced by BCS, particularly those further along on the aging continuum, is limited (Edwards et al., 2018; Joly et al., 2015; Lange, Rigal, et al., 2014). Cognitive impairment in BCS
may thus surface in a portion of individuals due to the interaction of several contributing factors, the impact of which has not been assessed systematically.
cognitive domains implicated in CRCI. These paradigms are herein referred to specifically as
experimental cognitive neuroscience paradigms. Next, I discuss several factors most commonly reported to contribute to CRCI, including potential mechanisms and risk factors by which chemotherapy may affect cognition as relevant to the current study. I highlight and discuss the need for a comprehensive modeling approach capable of handling the complexity of CRCI that can distinguish individuals with breast cancer from healthy age-matched control participants (HC). Finally, I state the rationale and aims of this study before presenting the results and discussion.
Assessment & Cognition in BCS
Cognitive dysfunction has been assessed across a wide range of cognitive domains in women with breast cancer. Cognitive domains assessed include visuospatial ability, verbal learning, memory, attention, and executive function. As substantiated by several recent meta-analyses, reports of cognitive deficits within these domains vary significantly across studies and assessments (Jim et al., 2012; Lindner et al., 2014; Ono et al., 2015; Yao et al., 2017). As highlighted within the introduction,
Deficits in skills required for daily-functioning are commonly self-reported by patients undergoing chemotherapy. Examples of such deficits in BCS include forgetting to take one’s medications or to schedule a follow-up appointment with a primary care physician (Horowitz et al., 2018). Such impairment can negatively affect one’s standard of living or have more serious and perhaps even life-threatening consequences, thus it is important studies attempt to understand the specific cognitive processes compromised in BCS.
EF has been assessed in BCS using a variety of traditional neuropsychological assessments. In order to retroactively assess which components of EF are more vulnerable in CRCI, a recent meta-analysis compared results from 41 independent studies (Yao et al., 2017). Studies were stratified according to the component of EF an assessment is purported to measure (inhibitory control: 19 studies; cognitive flexibility: 26 studies; working memory: 25 studies). Results of the meta-analysis suggest that impairments in EF due to treatment with chemotherapy, while variable, are found more consistently in areas of cognitive flexibility and working memory (shifting and updating), but not inhibitory control (Yao et al., 2017). However, the greater impairment in cognitive flexibility and working memory was limited to cross-sectional studies, thus it is uncertain how stable and reliable these findings are. Yao and colleagues (2017) highlight the variable number of assessments used to assess EF and the non-systematic reporting of raw versus standardized scores has likely contributed to inconsistencies in the literature regarding CRCI and may have contributed to the variable findings in their meta-analysis and lack of evidence for deficits in inhibitory control.
and letters. The particular sequence depends on the level of difficulty for a given condition. In the most difficult condition, participants are required to switch or alternate between connecting a number and a letter in sequential order (i.e. participants are instructed to draw a line from 1 to A, A to 2, 2 to B and so on). In all condition’s participants are prompted to do so as quickly as they can without making mistakes (for full task description, see Methods). This task taps multiple executive and non-executive cognitive processes (e.g. switching, inhibition, psychomotor speed, visual scanning, sequencing, and motor
function) which cannot be readily dissociated from one another. McFarland and colleagues (2017) discuss an additional example, the digit-span test (Wechsler, 1981) is a task primarily used to index working memory that requires participants to remember and recall a sequence of numbers of increasing length. This task involves several executive and non-executive processes including short-term memory, verbal attention and recall, and motor functioning (McFarland, 2017).
by the participant as in part 1. In part 3, after a delay period lasting 20 minutes, the participant is asked to recall any words from the first list that he/she can remember. In part 4, a new list of words is read aloud by the experimenter, and the participant is asked to decide whether or not a word belonged to the original list from part 1. As discussed by Nelson and Suls (2013), though the RAVLT is primarily used as an index of general memory ability, multiple component processes of memory (encoding, recognition, and retrieval), attention (selective and sustained) and executive functioning are involved (Nelson & Suls, 2013; Schmidt, 1996). Concerning memory deficits observed in BCS, Horowitz and colleagues (2018) suggest that problems with performance on traditional memory assessments commonly used in CRCI research may be due to issues with initiating or maintaining attention, rather than memory processes per se (Horowitz et al., 2018).
Traditional neuropsychological assessments such as the RAVLT rely on the use of single summary scores (i.e. one trial, one score) to assess average performance (Casaletto & Heaton, 2017). Summaries of global composite scores are impervious to the multiple cognitive operations underlying a particular score observed for a given individual. Such tasks, which may be capable of measuring large pathological cognitive impairment, are thus perhaps not suitable for detecting subtle and specific changes in cognition (Collins, Widmann, & Tasca, 2018; Tales et al., 2012; Wang, Ding, & Kluger, 2014). Experimental cognitive neuroscience paradigms are designed to disentangle sub-components of cognitive processes within a given cognitive domain (e.g. attention or executive function) (Barch et al., 2009; Costa et al., 2017; Horowitz et al., 2018; Silverstein, 2008; Van Der Plas et al., 2017; Wefel, Vardy, et al., 2011). Experimental cognitive neuroscience paradigms afford research scientists the ability to analyze individual patterns of performance using multiple metrics of accuracy, response time, and response time variability measured independently across conditions comprised of many trials with
consortium were created with the intent of optimizing and validating several experimental tasks based on theoretical and translational work in cognitive neuroscience for use in patient populations (Barch et al., 2009; Carter et al., 2011). For example, to address methodological issues with neuropsychological assessments of memory such as the RAVLT discussed above, the CNTRACs consortium developed the Relational and Item Specific Encoding Task (Ragland et al., 2012; see Methods & Materials for a full task description). This task is an episodic memory task designed to assess both the encoding and retrieval stages of memory for individual items and relational pairs. Participants complete several rounds of testing and see a large number of items. During this task, a participant’s performance is constantly monitored (accuracy, response time, response time variability) for every item across all conditions (item-encoding, relational-encoding, item-retrieval, relational retrieval). This task then, improves upon
neuropsychological tests that probe episodic memory in its ability to assess distinct contributions of different stages of memory, as well as assess the role of attention on performance, and processing speed. The efforts made by the CNTRACs consortium are important for clinical research as they address issues inherent to traditional neuropsychological assessments (non-specificity, practice effects, use of summary scores, etc.) to develop robust paradigms sensitive to individual variability in performance, and permit comparisons between heterogeneous clinical and non-clinical samples (Barch et al., 2009;
Silverstein, 2008). Improving the detection and measurement of non-pathological cognitive impairment is critical for assessing specific cognitive deficits in CRCI (Horowitz et al., 2018; Pendergrass et al., 2018; Wefel, Vardy, et al., 2011).
Mechanisms & Contributing Factors of CRCI
theoretical and empirical support for biologically-based mechanisms and pathways by which cancer pathology and treatment-related toxicities can contribute to cognitive dysfunction, particularly in aging samples (Mandelblatt et al., 2013; Merriman et al., 2013; Wefel, Kesler, Noll, & Schagen, 2015).
Post-Treatment Cognitive Impairment. Chemotherapy agents comprise several classes but
can be broadly classified into anthracycline and non-anthracycline-based regimens. Anthracycline agents are anti-tumor antibiotics, are the most common, and potentially most toxic. Anthracycline regimens are a combination of anthracycline-specific and non-anthracycline-based agents. Chemotherapy agents work by damaging DNA directly, targeting DNA repair and maintenance processes (e.g. cleavage), or by
interrupting the cell-cycle at various stages leading to apoptosis (cell death) and neurodegeneration (Pendergrass et al., 2018; Winocur et al., 2018). The cytotoxic effects of chemotherapy agents differ depending on the class of drug an individual is prescribed. Certain treatment regimens or drug combinations may contribute to CRCI more than others (e.g. 5-fluorouracil, doxorubicin, and
cyclophosphamide (Wefel et al., 2015). The degree to which cognitive impairments detected in BCS are dose-dependent remains uncertain (Cheung, Chui, & Chan, 2012; Collins, Mackenzie, Tasca, Scherling, & Smith, 2013; Fardell, Vardy, Logge, & Johnston, 2010; Kreukels et al., 2006; Mehlsen, Pedersen, Jensen, & Zachariae, 2009; Mehnert et al., 2007).
chemotherapy. The precise mechanisms leading to such impairment have for the most part remained elusive. Alterations in behavior and cognition have been shown to arise from cancer tumor pathology itself, chemotherapy, chronic inflammation (stress-induced), or treatment-induced hormonal imbalances (Golan, Lev, Hallak, Sorokin, & Huleihel, 2005; Kovalchuk & Kolb, 2017; Seigers & Fardell, 2011). A majority of findings have focused on decreased neurogenesis and cell proliferation in the hippocampus, a region critical for learning and memory (Kaiser, Bledowski, & Dietrich, 2014b). However, widespread changes in brain structure (volumetric reductions in both white and grey matter) and function have been observed in human and animal models after treatment with chemotherapy (Inagaki et al., 2007; Shelli R. Kesler & Blayney, 2016). Global changes in brain structure and function further underscore the need for cognitive paradigms that are capable of addressing the variability and uncertainty regarding the specific components of cognition most effected due to treatment with chemotherapy.
Physical manifestations of chemotherapeutic toxicities include hair and weight loss, nausea, and bowel-dysfunction. Side-effects resulting from chemotherapy treatment can negatively impact an individual’s overall health and well-being, which in turn can lead to a general decrease in cognitive
functioning. Additionally, chemotherapy itself may accelerate the aging process (Brouwers et al., 2016; Shelli R. Kesler, Rao, Ray, & Rao, 2017; Mandelblatt et al., 2016), a hypothesis supported by several lines of research at the molecular and systems-biology level (Kovalchuk & Kolb, 2017; Sanoff et al., 2014; Seigers & Fardell, 2011). Considering mechanisms by which chemotherapeutic agents can influence cognitive impairment can help further pinpoint potential areas of cognitive dysfunction at the neurobiological level (Ahles & Saykin, 2007; Janelsins et al., 2014; Lacourt & Heijnen, 2017; Saykin et al., 2003; Winocur et al., 2018).
Clinical & Psychosocial Determinants. Breast cancer risk is reported to increase with age and
2014; Lange, Rigal, et al., 2014). How an individual may respond to treatment with chemotherapy, and the extent to which one can cope with adverse side-effects and symptoms of cognitive impairment is, therefore, further complicated by issues unique to aging populations. Aging individuals experience normative, yet variable degrees of cognitive decline (Cabeza, Nyberg, & Park, 2009; Campbell, Hasher, & Thomas, 2010; Salthouse, 2017), but when and how this decline develops is still a matter of debate (Salthouse, 2009). Indeed, in addition to normative declines in processing speed, non-pathological age-related cognitive impairment is known to occur across both general and specific cognitive domains, such as memory and task-switching ability, respectively. In the absence of cancer or cancer treatment,
normative aging is associated with declines in various forms of higher-order cognition implicated in CRCI such as memory, attention and executive function (Lange, Rigal, et al., 2014; Ono et al., 2015; Salthouse, 2009). Normative age-related cognitive decline may negatively interact with chemotherapy treatment to confer an increased susceptibility toward experiencing CRCI and commonly reported secondary effects, most notably depression and fatigue (Lange, Giffard, et al., 2014; Maccormick, 2006; Vearncombe et al., 2009).
Ho et al., 2015). While these particular studies did not include any measure of cognitive function, they provide evidence that such factors are indeed co-expressed differently across individuals with and without breast cancer. Further, this research indicates that clustering (e.g. grouping associated factors) may be one approach for identifying individual risk factors in BCS that can then be associated with cognitive
impairment. To date, one study has followed up on this line of evidence and employed clustering to examine how risk factors implicated in CRCI can be linked to cognitive impairment. Xu et al. (2018) computed an average composite score from a battery of traditional neuropsychological assessments to show that relatively poorer cognitive function in BCS before, during, and shortly after treatment with chemotherapy was directly related to the quality of sleep. Fatigue itself was indirectly linked to poorer cognitive performance through its association with overall sleep quality.
Currently, there is no consensus as to what risk factors contribute to CRCI. This discrepancy may arise due to the characteristics of a given sample under investigation or methodological and analytical variability. Age, genetic predisposition, and resilience to stress amongst other factors interact to confer risk for experiencing cognitive dysfunction. Clearly more work is needed that considers the complex and high-dimensional interaction between these and potential contributing risk factors implicated in CRCI. In theory, CRCI may arise from the interaction of demographic, psychosocial, and cognitive factors, no study has systematically addressed this issue.
Modeling & Prediction
Machine learning tools are predictive modeling techniques designed to deal with high-dimensional and diverse datasets (Altman & Krzywinski, 2017; Breiman, 2001; Denisko & Hoffman, 2018).
Applications of Machine Learning. From genomic sequencing to artificial intelligence and
image recognition, machine learning tools provide a robust framework to tackle complex issues. Machine learning tools are most appropriate in instances when the underlying cause or set of causal factors for a given disease, disorder or impairment is unknown, or may likely result from the interaction of multiple contributing risk factors (Bzdok & Meyer-Lindenberg, 2018; Dwyer, Falkai, & Koutsouleris, 2018; Iniesta, Stahl, & McGuffin, 2016). Machine learning tools are commonly used in precision or
personalized medicine in order to help medical practitioners develop individualized drug-based treatment plans and has been shown to improve diagnostic, prognostic and treatment-related outcomes (Bzdok & Meyer-Lindenberg, 2018; Dwyer et al., 2018; Iniesta et al., 2016). Specifically, machine learning has been used to predict how individuals with various types of cancer will respond to commonly prescribed chemotherapeutic regimens based on the genetic profile of a cancerous tumor before and after treatment with high accuracy (>80%) (Huang et al., 2018; Zhang, Wang, & Xu, 2006). Additionally, machine learning is now commonplace in cancer drug development where the goal is prediction and subsequent reduction of drug-induced toxicities (Wu & Wang, 2018). As discussed in several reviews (Bzdok & Meyer-Lindenberg, 2018; Dwyer et al., 2018; Iniesta et al., 2016), machine learning tools are being used to aid in the development of targeted pharmacological therapies for individuals with treatment-resistant depression (Grisanzio et al., 2018; Kautzky et al., 2017), to predict an individual’s risk of developing Alzheimer’s dementia (Geifman, Kennedy, Schneider, Buchan, & Brinton, 2018; Lebedev et al., 2014) or
Feczko et al., 2018).
Machine Learning & CRCI in BCS. To date, few studies have used machine learning to study
CRCI. In 2013, a study by Kesler and colleagues used functional magnetic resonance imaging (fMRI), IQ testing, a battery of traditional neuropsychological assessments and self-report questionnaires to compare BCS who had received treatment with chemotherapy (N=30), with BCS who did not receive treatment with chemotherapy (N=27) and healthy women with no history of breast cancer or treatment with
chemotherapy (N=24). fMRI was used to measure intrinsic (task-free) coordinated brain activity between 19 discrete brain regions belonging to the default mode network (DMN). The DMN is a well-established collection of brain regions that communicate with one another during mental operations that are internally focused such as autobiographical memory, socioemotional processing and the monitoring of internal physiological states (Buckner, Andrews-Hanna, & Schacter, 2008; Raichle & Snyder, 2007). The DMN has consistently been shown to be vulnerable to various disease processes, stressful and traumatic experiences, pharmacological intervention and aging (Broyd et al., 2009; Buckner et al., 2008). Kesler and colleagues specifically targeted the DMN based on prior research linking alterations in DMN functioning to cognitive impairment in BCS treated with chemotherapy (Dumas et al., 2013). In this seminal study, machine learning was used to accurately distinguish (e.g. classify) BCS treated with chemotherapy from BCS not receiving chemotherapy and healthy age-matched control participants with no history of cancer based on DMN connectivity alone (S. R. Kesler et al., 2013). The authors report a positive correlation between subjective memory impairment and classification accuracy, but no
differences were found between groups on any of the neuropsychological assessments using an analysis of variance. The authors suggest that the lack of group mean differences are likely due to the substantial amount of heterogeneity in BCS populations and limitations with traditional statistical tests that average group performance.
theory to predict long-term cognitive impairment in a sample of 31 BCS ages 34-65 using machine learning. Graph theory is a set of mathematical tools used to describe the brain as a network of interconnected regions. Here, the authors calculated regional clustering coefficients (e.g. clustered connectivity), a mathematical formula from graph theory which quantifies how well a brain region is connected to other regions in close proximity. This organizational property of brain networks is said to index the efficiency of information transfer in brain networks important for cognitive functioning (Rubinov & Sporns, 2010) and has been shown to be compromised in BCS after treatment with chemotherapy (Bruno, Hosseini, & Kesler, 2012; Hosseini, Koovakkattu, & Kesler, 2012; Shelli R. Kesler, Watson, & Blayney, 2015). In this study, BCS completed a single fMRI scan prior to treatment and cognition was assessed before, shortly after (1 month), and 1-year post-treatment with chemotherapy. Additionally, a group of 43 age-matched healthy women with no history of cancer or cancer treatment was used to obtain normative scores on neuropsychological assessments. Scores from each
neuropsychological assessment obtained from BCS were standardized using the mean and standard deviation of the reference healthy control group. BCS having scores greater than 1 or 2 standard deviations below the reference group were considered impaired.
specificity = 0.75; model 3: 100% accuracy, sensitivity = 1.0, specificity = 1.0). As hypothesized by the authors, a model using imaging data alone (model 2), or in combination with demographic and medical information (model 3; best performance) provided greater classification accuracy than the model comprised exclusively of non-imaging data (model 1). Models 2 & 3 were less accurate and not significantly different from one another (Shelli R. Kesler, Rao, Blayney, et al., 2017).
Implications. The aforementioned studies illustrate the potential for machine learning to unravel
the complexity of CRCI. In the Kesler et al. (2012, 2017) studies, the authors were able to accurately classify BCS as impaired versus unimpaired, and predict future cognitive decline using several features from different modalities. Machine learning studies of this type permit discovery and represent an important step forward in CRCI research. However, it remains unclear how these findings relate to cognitive dysfunction. In these studies, cognition was either indirectly inferred via self-report and not explicitly modelled, or was assessed with non-specific neuropsychological assessments which were used to create a sample-specific cognitive impairment score (RAVLT, TMT; see Assessment & Cognition in BCS for specific discussion of these measures). As Kesler and colleagues (2017) note, the assessments and diagnostic criteria were chosen primarily for harmonizing studies of cancer and cognition and future
studies should thus focus on improving cognitive assessments to identify the specific components of cognition compromised in CRCI. In combination with machine learning, the development of measures that can accurately and mechanistically explain CRCI can be used to better inform future diagnostic criteria and identify individuals who may be at greater risk for experiencing great cognitive impairment and decline (Wefel, Vardy, et al., 2011). A common machine learning tool is the random forest algorithm (used in Kesler et al., 2017; also see the studies highlighted above in the subsection entitled Applications of Machine Learning).
An overview of random forest classification. A random forest is a collection of decision trees.
people, music, movies, food and so on. In the case of people, descriptive features could include age, gender, weight, heart rate, personality traits, likes and dislikes. Classes or labels might represent
dichotomous categories such as sick or healthy, or BCS or HC. As a machine learning tool, a decision tree is tasked with learning a set of rules that best divides a dataset into its respective classes. This set of rules can later be used to make predictions as to which class a new unfamiliar object might be classified. Within a given decision tree (see Figure 2),
a dataset is split into branches (connections) and nodes (features) in a hierarchical manner. Starting at the root node (top of a tree), the data is split on a feature that best differentiates a set of items or observations. From the top of the tree, branches extend downward to form connections with internal nodes that contain other features that next best differentiate a set of items. This process occurs until no more splits are possible and a decision is reached at a final terminal node. To grasp how a decision tree works in practice, consider how a person may decide to go outside and exercise or stay home and read. The decision to go outside and exercise or not can be based on features that describe the weather, the person’s current mood state, health status, love of reading and so on. In this example, the most reasonable choice to exercise or not depends on whether or
not the person is feeling ill. So, starting at the root node with health status, the decision process begins by
Figure 2. Simplified decision tree.
Example
depicts the basic components of a decision
tree. Starting from the top of a tree, the root
node represents the feature that best splits a
set of observations into their respective
classes (HC, BCS). From the root node, a set
of split observations is sent down their
respective branch to the next decision point
at an indicator node. This process is repeated
until no more splits are possible and a
asking if the person sick? If not, is it raining? If not, is it too windy? If it is not too windy, does the person love reading too much? If not, go exercise! In this example, the final decision can only be one of two choices that are known a priori: go outside or stay home and read and is thus considered a form of supervised machine learning.
In this study, the goal was to develop classification models that are capable of distinguishing breast cancer survivors from healthy control participants using a combination of clinical, demographic, psychosocial, and cognitive measures. Here, we can consider features such as fatigue and depression, as well as performance on an attention task (see Figure 2; example and graphics for illustration purposes only). As depicted in figure 2, the best split occurs at the root node on the depression. Individuals experiencing less depression move down the tree following a branch to the left, while individuals experiencing higher depression move down the tree by following the branch to the right. The branches extend downward to an internal node. Each internal node contains a feature, such as fatigue and attention in this example, that provides the next best split of the data into their respective classes. When the data can no longer be split, a final decision is reached at a terminal node. In the case of fatigue, no further splits are possible, and individuals who are (1) lower on depression and (2) higher on fatigue are classified as BCS. For attention, a portion of higher-performing healthy individuals can be classified immediately, however, there is a degree of overlap for those performing at a lower level. The remaining individuals must be split again until a decision can be reached.
assessments that tap a particular cognitive domain. Further, the variation may be linked to several
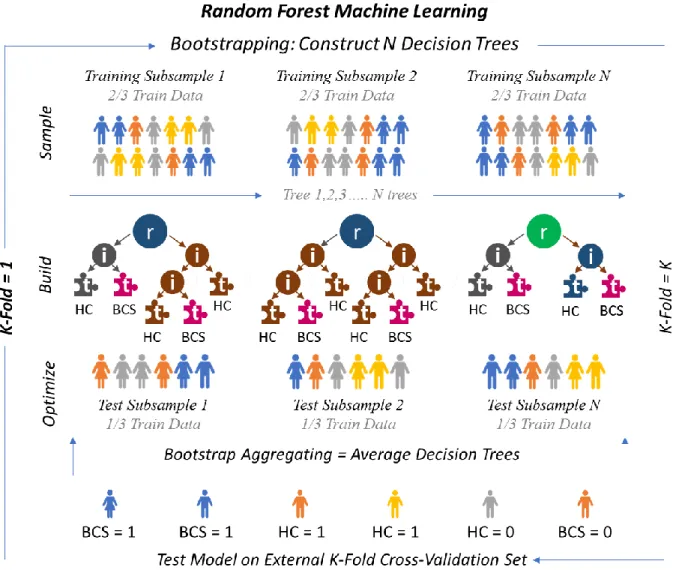
confounding factors such as age, IQ, levels of stress and/or fatigue. This variation cannot be accounted for using a single decision tree with a single set of rules, or even many different trees using the same set of rules. To circumvent this issue, the random forest combines the predictive power of many decision trees. Thus, the random forest is known as an ensemble method. Each decision tree is constructed using a different, randomly selected subset of observations and features, a process known as bootstrapping. The random forest uses the bootstrapped datasets to build and optimize a set of decision trees. This process helps to ensure that a set of decision trees are not correlated with one another or overly biased towards a specific item or feature within a dataset, thus preventing overfitting or over-modeling of a subset of data. The set of unbiased trees is then combined or aggregated (bootstrap aggregating; also known as bagging) resulting in an unbiased model. The most predictive features are those which contribute the greatest to classification on average across the set of bootstrapped decision trees. The random forest can be used in conjunction with cross-validation, a set of partitioning schemes used to split a dataset into multiple training and test sets. Although, the random forest estimates misclassification internally ( out-of-bag-error), external cross-validation can be used to assess generalizability - the ability for a random forest model to correctly classify new and unseen data not used to build or optimize an ensemble of decision trees. As in Figure 3, a common cross-validation technique is k-fold cross-validation whereby a dataset is randomly partitioned in k equal groups. On each fold, one of the partitioned k samples is set aside and used exclusively for testing the accuracy or generalizability of a random forest model, all remaining k samples are then used as training data and submitted to the random forest.
Random forest ensemble methods have been shown to outperform various classification
best distinguishes BCS from HC.
RATIONALE & APPROACH
A central theme of the current work, is that previous research, limited by methodological and analytical choices, has not addressed the complexity of CRCI. Such choices have flooded the literature with inconsistencies regarding the precise nature of CRCI (Argyriou, Assimakopoulos, Iconomou, Giannakopoulou, & Kalofonos, 2011; Ganz, 2012; O’Farrell, MacKenzie, & Collins, 2013; Shilling, Jenkins, & Trapala, 2006). Guided by previous empirical & theoretical research, this study aims to address the ubiquitous inconsistencies prevalent amongst prior studies assessing CRCI in women BCS. To do so, a rigorous hypothesis-driven study design was combined with robust exploratory data-driven analytics to model the complex relationship between cancer, chemotherapy, and cognition. A combination of performance metrics from experimental cognitive paradigms, commonly administered
neuropsychological assessments, self-report measures, and demographic information (see Supplemental Table 1 for a full list of features labels and individual descriptions) was used to distinguish BCS women from healthy control participants. This approach is in accordance with recommendations set forth by the International Cancer and Cognition Task Force (Wefel, Vardy, et al., 2011).
Leveraging experimental cognitive neuroscience paradigms permits the assessment of subtle deficits in specific components of cognition in BCS having received chemotherapy. In contrast, the use of commonly recommended neuropsychological assessments enables direct comparisons to previous
research that has assessed general cognitive deficits in BCS.
experimental cognitive neuroscience tasks administered in this study have been developed for use in clinical populations. Further, each experimental cognitive neuroscience paradigm selected for use the current study was designed to be (1) resistant to repeated-testing/practice effects, (2) have high test-retest reliability, and (3) permit measurement of trial-by-trial variations in performance (accuracy and response time). Repeated-testing/practice effects occur when the baseline measurement and longitudinal
assessment of cognitive functioning is obscured by familiarity or overexposure through repeated
administration (Naglieri et al., 2004). Though not limited to the study of CRCI, practice effects have been implicated as one potential source which has contributed to inconsistent reporting of cognitive
impairment and decline in BCS (Andreotti et al., 2016; Cerulla et al., 2018). Each task was additionally selected based on an ability to assess and quantify specific sub-components of cognitive domains specifically implicated in CRCI research. However, these experimental paradigms have not been extensively tested and validated in older adults (≥ 65 years of age) or administered to BCS prior to this study. It was therefore of utmost importance to validate the use of these tasks in the current sample and assess the feasibility of administering a comprehensive battery of assessments to BCS.
The combination of assessments administered in this study may provide additional information or insight into the cognitive deficits experienced by BCS. However, direct comparisons (subjective,
statistical or otherwise) between standardized and experimental tasks warrants caution (Silverstein, 2008). Experimental cognitive neuroscience tasks differ from traditional assessments in a number of ways and permit researchers to isolate and assess specific sub-components of cognition. This limits direct statistical comparison to measures optimized for assessing general cognitive deficits, or for use in a specific
functions and abilities it is purported to measure (Cooper, Gonthier, Barch, & Braver, 2017).
Experimental tasks often contain several conditions each with a large number of trials and may differ in their level of difficulty and administration time. The properties of an experimental task can be modified for a particular study or population. Traditional neuropsychological tasks, many of which only provide a single version, are singe-trial designs that often rely on single-summary score metrics to assess
performance. Finally, while experimental tasks may hold several advantages over traditional
neuropsychological assessments for assessing specific aspects of cognition, it remains to be determined how performance measures on these tasks correlate with age and levels of fatigue, stress, and other potential contributing risk factors that have been consistently implicated in CRCI. Thus, this study assessed how performance on experimental cognitive paradigms corresponded to performance on
METHODS & MATERIALS
Participants. The current sample comprised 40 women ages 30-75 (Table 1). 20 women with
primary, early-stage (I-IIIA) breast cancer who have completed chemotherapy within 1-12 months of their scheduled visit date, and 20 healthy female control participants with no history of cancer who have never experienced treatment with chemotherapy were recruited. Groups were matched on age, ethnicity,
socioeconomic status and IQ. All participants were required to be proficient in English, have normal color vision, and have no history of neurologic or psychiatric disorders with the exception of anxiety and depression. Anxiety and depression are common contributing risk factors for CRCI and are thus not considered exclusionary criteria.
Treatment Information. All cancer patients completed adjuvant chemotherapy either with or
without concomitant endocrine therapy (tamoxifen or aromatase inhibitors). Participants were exposed to one of two commonly-used regimens: 1) 12 weeks: 4 cycles docetaxel and cyclophosphamide every 3 weeks; 2) 16 or 20 weeks: 4 cycles doxorubicin and cyclophosphamide every 2 weeks, followed by 4 cycles of paclitaxel given every 2 weeks or weekly at 12 cycles. Cancer stage and treatment plans were confirmed via electronic medical records in compliance with all Health Insurance Portability and Accountability Act of 1996 (HIPAA) regulations and provided participant consent.
Overall Procedure
of the questionnaires, participants completed either a series of traditional neuropsychological assessments or experimental cognitive neuroscience paradigms. The order was counterbalanced between sessions. The administration order of individual tests was randomized as well to control for fatigue, test difficulty, and trial order effects.
Questionnaires. Questionnaires included questions about demographics and health history,
subjective cognitive functioning, sleep quality, physical and mental fatigue, stress, anxiety and depression and other quality of life-related factors that have all been implicated in CRCI.
Demographics and Health History: This questionnaire asks about the participant’s demographic
characteristics (e.g. age, weight, education, employment) and health history including current non-cancer related medications.
The Broadbent Cognitive Failure Questionnaire (CFQ): This 25-item questionnaire asks about
the participant’s subjective cognitive functioning in everyday life (Broadbent, Cooper, FitzGerald, & Parkes, 1982). Using a 5-point Likert scale (0 never; 1 very rarely; 2 occasionally; 3 quite often; 4 very often), participants rated themselves on a series of questions assessing absent-mindedness during routine daily activities. A total score was calculated (0-100) by summing all item responses. Higher numbers indicate greater overall cognitive impairment. Three subscales were computed by summing specific items to measure forgetfulness, distractibility and false triggering. This questionnaire can be administered to both healthy control participants and patients. The CFQ is one of the most commonly administered self -report questionnaires assessing cognitive functioning (Cheung, Tan, & Chan, 2012).
Beck Depression Inventory (BDI): This 21-item questionnaire assesses participant attitudes and
Group Characteristics
BCS (N = 20) HC (N = 20) t/x2 p
Age 53.05 (9.89) 49.65 (13.82) -0.895 .376
Weight 171.75 (52.82) 162.15 (38.64) -0.826 .414
Race/Ethnicity 3.949 .557
White/Non-Hispanic 10 14
Hispanic 1 1
Black/African-American 3 1
American Indian 1 2
Asian 1 1
Multiple Races/Other 3 1
Native Hawaiian 1 0
Education 1.834 .934
High School 1 1
Some College 1 1
Associate Degree 1 1
Four-Year Degree 5 6
Master’s Degree 12 10
Doctoral Degree 0 1
Patient Characteristics
Treatment ddAC ddAC+PAC PAC
9 10 1
Time Since Treatment 1-3 4-6 7-9 10-12
8 5 4 3
Tumor Grade Grade 1 Grade 2 Grade 3
4 12 4
Receptor Type (+/+/-) (+/-/-) (-/-/-)
15 2 3
Table 1. Sample Characteristics.
Breakdown of demographic variables for all participants included in the current study, as well as treatment information for breast cancer survivors. ddAC = Dose-Dense Adjuvant Doxorubicin and Cyclophosphamide; ddAC+PAC = Dose-Dense Adjuvant Doxorubicin and Cyclophosphamide Plus Paclitaxel; PAC = PaclitaxelDepression and associated symptoms are commonly reported in BCS and have been linked to cognitive impairment. The BDI is a well-validated and reliable measure of depression that has been used in prior studies assessing CRCI.
Multidimensional Fatigue Symptom Inventory Short Form (MFS): This 30-item self-report
how relaxed, weak, sluggish or tired they feel. Feelings of fatigue are consistently reported by BCS after receiving chemotherapy and can directly impact cognitive functioning (Ganz, 2012; Hurria, Somlo, & Ahles, 2007).
Pittsburgh Sleep Quality Index (PSQ): This 9-item questionnaire assesses a participant’s overall
quality of sleep and patterns of sleep disturbance (Buysse, Reynolds, Monk, Berman, & Kupfer, 1989). Participants rated themselves on a scale from 0-3 with higher scores indicating poorer sleep. Seven subscales assess subjective sleep quality, sleep latency, sleep duration, habitual sleep efficiency, sleep disturbances, use of sleep medication, and daytime dysfunction over the last month. Poor sleep is linked to worse cognitive functioning in clinical and non-clinical samples alike and has been shown to co-occur with fatigue and depression in BCS (Henry et al., 2018; Xu et al., 2018).
Perceived Stress Scale (PSS): This 10-item questionnaire measures a participant’s perceived
level of stress during daily-life events (Cohen, Kamarck, & Mermelstein, 1983). Participants indicated how often they feel stressed due to unpredictable, uncontrollable, or overwhelmingly difficult life events using a 5-point Likert scale (0 never; 1 almost never; 2 sometimes; 3 fairly often; 4 very often) to indicate how relaxed, weak, sluggish or tired they feel. Increased feelings of physical and mental stress which can contribute to cognitive impairment are experienced by BCS after receiving an initial cancer diagnosis and upon completing chemotherapy treatment (Evenden, 2013).
36-Item Short-Form Health Survey (SF): This 36-item questionnaire assesses general
quality-of-life factors that may or may not interrupt daily activities occurring within 4 weeks of assessment (Ware & Sherbourne, 1992). Items from this assessment can be combined to form subscales assessing physical functioning, energy level and fatigue, emotional well-being, social functioning, pain, and general health. This form is used in conjunction with the CFQ to assess acute changes in daily functioning.
Functional Assessment of Cancer Therapy (cancer patients only): This 27-item questionnaire
point Likert scale (0 not at all; 1 a little; 2 some; 3 a lot; 4 very much), participants rated how their overall level of health after receiving treatment with chemotherapy. This assessment can help isolate treatment-specific factors affecting self-perceived physical, mental, social and emotional health occurring over the past 7 days since the time of assessment.
Debriefing Questionnaires: These 7-item questionnaires ask about a participant’s subjective
level of fatigue, cognitive performance, and frustration occurring during each of the three experimental cognitive neuroscience paradigms described below. The debriefing questionnaires provide a means to directly compare self-reported and objectively measured cognitive abilities.
IQ & Neuropsychological Assessments
Wechsler Abbreviated Scale of Intelligence (WASI). Full-scale IQ was approximated utilizing two subtests from the WASI: Matrix Reasoning and Vocabulary.
DKEFS Trail Making Test: The DKEFS (Baron, 2004) Trail Making Test is a paper & pencil
test consisting of five conditions meant to assess motor functioning & speed, as well as general aspects of executive functioning including inhibition and interference control. All five conditions were administered to participants. Condition one is a visual search and cancellation task whereby participants were asked to find and cross-out any number threes they can locate. In conditions two and three, participants must draw a line between the dots in order to connect a series of letters or numbers on a page in sequential order. Condition four required participants to alternate or switch between connecting a number and a letter in order. The final condition simply required participants to connect a series of dots. All conditions were timed and participants were asked to complete each task as quickly as they could without making mistakes. Conditions 1, 3, and 4 were included in analyses.
DKEFS Color-Word Interference Test: The DKEFS Color-Word Interference Test assesses
as the word (congruent) or different (incongruent). The final condition is similar to condition four, except words can also appear in a box, where the word and not the ink color the word is printed in is read aloud.
Hopkins Verbal Learning Test-Revised (HVLT): The Hopkins Verbal Learning Test-Revised
(Belkonen, 2011) assesses verbal learning and memory through semantic categorization and recall. In the sequential learning trials, participants were presented with a series of words belonging to one of three categories (animals; lodging; gems) and asked to remember them. Participants, must then repeat as many words as they can remember, in any order. After a 20-minute delay, participants were asked to remember and list as many words as they could, in any order, using free recall. In the final discrimination condition immediately administered after the free recall portion, participants were presented with a set of words that had either been learned previously or were new words that belonged to the same category. Participants responded whether or not they were previously presented with the word by responding yes or no.
D2 Test of Attention: The d2 Test of Attention assesses selective and sustained visual attention,
concentration, and processing speed (Bates & Lemay, 2004). Participants attempted to discriminate amongst visually similar stimuli to isolate specific features. After a single untimed practice trial, participants saw 14 lines with the letters “d” and “p” interspersed. Each letter has a variable number of dashed lines; the task is to cross-out only “d’s” with two dashes while ignoring “d’s” with more of less than two dashes and “p’s” altogether. The main task is timed and consists of 14 lines. For each line a participant had 20 seconds (s).
Experimental Cognitive Neuroscience Paradigms
Relational and Item Specific Encoding Task (RISE): The RISE task (Ragland et al., 2012) is a
conditions (Figure 4). The RISE task uses a set of 144 visual stimuli representing common
everyday objects and scenes selected from a public repository of 2,500 color images (http://cvcl.mit.edu/MM/).
Part 1: Item and relational
encoding. Part 1 had 6 total blocks. 3
item-specific blocks and 3 relational encoding blocks were presented in alternating order (see Figure 4; top). Before each block, instructions were presented for 3s to remind participants which condition was coming
next. In the item encoding blocks, each block contained 12 trials (12 visual stimuli per trial; 36 total items). Stimuli were presented one at a time for a duration of 2s with a 1s interval between stimulus presentation. During the interval a white fixation cross was presented at the center of the screen. During the 2s stimulus presentation, participants were asked to decide whether or not an item is “living” or “non-living.” Participants indicated their decision with a 2-button response (1=Yes; 2=No) using their right-hand. Relational encoding blocks contained 6 trials (6 stimulus-pairs; 18 total pairs). Pairs of stimuli were presented for 4s each with a 1s interval between presentation of the stimuli. During the 4s stimulus-pair presentation, participants were asked to decide whether one item can fit inside the other. Participants indicated their decision with a 2-button response (1=Yes; 2=No) using their right-hand. Participants were asked to respond as quickly and as accurately as they can. Training: Participants completed a separate practice run of 4 trials for both the item and relational encoding condition to ensure they understood the directions and knew which keys to press. Stimuli used during the practice were not repeated during the main task.
Part 2: Item and relational retrieval. Part 2 was comprised of 2 blocks, 1 for the item-specific
retrieval condition and 1 for the relational retrieval condition (see Figure 4; bottom). Before each block, instructions were read aloud to a participant. The item retrieval block contained 144 trials (72 “new” visual items intermixed with 72 “old” visual items (e.g. foils) from part 1). In the item-specific retrieval condition participants were asked to decide whether or not an item was seen previously during part 1, and to rate their level of confidence (low, medium, high) in their decision. Participants marked an item as old (seen in part 1) via a left-hand response and pressed one of three keys to indicate their level of confidence in their decision (a=low; s=medium; d=high). A right-hand response marked an item as new (not seen before during the task) via a right-hand response using one of the three keys (j=high; k=medium; l=low). Stimuli were presented for a maximum of 10s, however, after a participant made a response the trial ended after 1.5s. Each trial was followed by a fixation cross for 1s. Participants were told to make their responses as quickly and accurately as they can. In the relational retrieval condition, a participant had to decide whether or not a pair of objects had been seen together previously during the relational encoding condition in part 1. Stimuli consisted of 18 stimulus pairs from the relational encoding conditions in part 1 and 18 new stimulus pairings (items not previously paired together). Stimuli were presented for a maximum of 10s, during which participants responded with a 2-button (1=Yes; 2=No) response (no confidence judgment required). Once a participant made a response, the trial ended after 1.5s. Each trial was followed by a fixation cross for 1s. Participants were told to make their responses as quickly and accurately as they can. Training: Participants completed a separate practice run before each retrieval condition. Each run consisted of 10 trials to ensure they understood the directions and knew which keys to press. Stimuli used during the practice were not repeated during the main task.
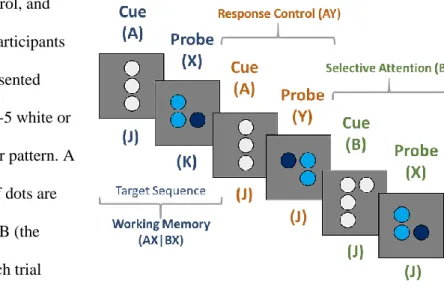
Dot Pattern Expectancy Task (DPX): The DPX (Henderson et al., 2012) is a modified
working memory, response control, and processing speed. In this task, participants viewed a series of randomly presented images. Stimuli are a series of 3-5 white or blue dots arranged in a particular pattern. A total of four different patterns of dots are possible. Dots are labeled as A, B (the cues) and X, Y (the probes). Each trial consisted of an initial cue followed by a
probe (AX, AY, BX, BY). Participants were instructed to look for a target sequence (AX). The target sequence is considered a valid (AX) trial and all other combinations are invalid (AY; BX; BY) trial-type pairs. Participants responded with one of two keys (j or k). For the valid target (AX) sequence,
participants were instructed to press the ‘k’ key. For all other invalid responses, a participant was instructed to press the ‘j’ key.
The DPX task consisted of 4 blocks of 40 trials (160 total). Cue trials had a 3s duration; stimuli were presented for 1s, followed by a fixation cross for 2s. Participants had 1.4s to respond. Probe trials are 2.4s in duration; stimuli were presented for .5s followed by a fixation cross for 1.9s Participants had a total of .9s to respond. Late responses were recorded. After each allotted response window, 1 of 3 tones (buzz, knock, beep) was presented as audio feedback. These tones indicated whether or not a response was correct, incorrect, or late respectively. Participants were instructed to make their responses as quickly as they can (Henderson et al., 2012). Training: Before test administration, participants completed a series of training runs to ensure comprehension of task instructions. Training: In this task, a training run is identical to the test condition. Participants were instructed to try and achieve an overall accuracy of 75% before moving on to the primary assessment. A maximum of 5 practice runs was administered.
Participants were excluded if they did not achieve an accuracy level equal to or greater than 50%.
Cued Cognitive Flexibility Task (CCF): The CCF is designed to assess multiple components of
executive function including cognitive flexibility and interference control as well as implicit learning. In this task, participants viewed a series of randomly presented digits (0-9; excluding 5) and were cued by the digit’s color to make a judgment of either magnitude (red: greater or less than 5) or parity (blue: odd or even) with a left or right button press (Figure 6). Trials are either ‘hold’ (same judgment as the previous trial) or ‘switch’ (other judgment) trials. Simultaneously, trials could be either ‘congruent’ or ‘incongruent’. The majority of trials were congruent whereby the stimulus presented requires the same
button press as the preceding trials. For incongruent trials, a different response than the previous trial would be expected. For example, during a congruent trial, a red 8 (greater than five) might be followed by a blue 8 (even) and elicit a right button press. During an incongruent trial, a red 7 (greater than five) might be followed by blue 7 (odd), would indicate a right button press followed by a [less expected] left button response.
This task was comprised of 3 blocks each containing 49 trials (147 trials total). Block order was counterbalanced per participant. The proportion of switch trials was manipulated such that a task block could have a low (.25), medium (.5) or high (.75) proportion of switches. Stimuli were randomly presented for 1.2s. Following a stimulus, a fixation cross was displayed for a randomized duration set to an inter-trial interval ranging from 1.25s to 2s. Participants had a total of 2s to respond and late
responses were recorded. Participants were instructed to
training the proportion of switches was held constant at 50%. The CCF has not been tested in older adults and patients, therefore the target accuracy level was be slightly adjusted from 80% as in Chiu & Egner (2017) to 75%. Participants were instructed to try and achieve an overall accuracy level of 75% before moving on to the primary assessment. A maximum of 5 practice runs was administered. Participants were excluded if they did not achieve an accuracy equal to or greater than 50%.
Machine Learning & Random Forest Classification
The random forest (see Figure 3) is designed to handle complex high-dimensional interactions with no restraints on the types of features included for prediction (i.e. categorical, numerical) and are thus well-suited for combining factors across clinical, biological and cognitive domains (Altman &
Krzywinski, 2017; Breiman, 2001; Denisko & Hoffman, 2018). To assess how well BCS could be distinguished from healthy women participants, the current study utilized 69 total features from the set of questionnaires and cognitive assessments as described above (see Supplemental Table 1). Prior to random forest modeling, a series of data quality checks were performed as described in the following section.
Exploratory Data Analysis (EDA). While no ‘preprocessing’ or extensive ‘data wrangling’ is
necessary given the non-parametric nature of machine learning algorithms (meaning there is no
computational time. Such a framework permitted the comprehensive modeling of linear and non-linear multivariate dependencies between cognitive components, influential contributing risk factors (e.g. sleep, fatigue, depression, etc.) and demographic variables of interest (see Table 1). The dataset was inspected for missing values. Missing data were imputed using the random forest imputation (Breiman, 2001). Items not excluded during EDA were used as predictive features used to distinguish BCS from HC using random forest classification modeling.
Random Forest Application & Model Performance. For supervised classification problems, a
series of decision trees are constructed to predict an a priori defined class label (BCS or HC) for a given set of observations. The set of decision trees/models are aggregated to generate forests which minimize a cost function. The Gini impurity index is a built-in cost function that measures how “pure” a set of classifications are for a decision point at each root node (see figure 2) within a given decision tree. Specifically, it measures how consistently a feature splits data into their respective classes across a set of decision trees and thus is the probability of misclassifying new data. Minimizing the cost function ensures groups are maximally separated (i.e. better classification accuracy). To minimize sampling bias, and ensure all features and observations have been modeled in the random forest, k-fold cross-validation was performed. K-fold cross-validation randomly partitions data into k independent subsamples which are then used to train and test model performance. 5-fold cross-validation is commonly used in conjunction with the random forest when the sample size is not sufficiently large (Borra & Di Ciaccio, 2010; Steven L. Salzberg, 1997). When combined with the built-in bootstrapping technique (see Modeling &
quantifies how many times an observation was correctly classified as BCS or HC across each fold of cross-validation). In addition to classification accuracy, the No Information Rate (NIR) is a statistic based on a one-sided binomial test of proportions that compares observed model accuracy to that expected by chance given the total number of possible true cases. That is, a p-value (p-NIR) under the specified alpha (.05) is used to indicate if the cross-validated model accuracy is statistically significant as compared to the total number of sampled cases in the majority class (e.g. positive class; BCS). Typically, NIR is used to assess model performance in unbalanced datasets where the number of observations between classes is not equal. Here, NIR was used to assess sampling bias, whereby the proportion of classes may differ across cross-validation folds. As a final step, accuracy-based classification performance was assessed via permutation testing, whereby the distribution of model misclassification rates, averaged across all independent (e.g. held out) test sets, is compared to an empirically generated null-distribution of
classification models (e.g. random chance). To generate an empirical null-model derived from the current dataset, each step in the random forest process is repeated and class labels (e.g. group status; BCS vs. HC) are randomly permuted or shuffled. The number of permutations was set to 1000 (Breiman, 2001; Chen & Ishwaran, 2012; Denisko & Hoffman, 2018; Feczko et al., 2018).
Model Comparisons. Multiple random forest models, each containing an a priori defined subset
of features, were (1) assessed for their respective ability to classify BCS from HC, (2) compared to a single full model comprised of all available features, and (3) compared to a final reduced model
containing only the highest-ranked features. By using all available features within a given dataset, every possible combination, or interaction between features, becomes factored into a given model’s
directly tests such hypotheses. By considering multiple reduced models, each containing a specific subset of features, it is possible to 1) assess how important a particular feature is independent of other potentially confounding factors, and 2) how important an overall category is to classification.
As in Kesler, Rao, Blayney, et al. (2017), model sensitivity (true positive rate) and specificity (true negative rate) can be quantified across a range of classification thresholds using the area under the receiver operating curve (AUROC). The AUROC is a single numerical summary describing the
proportion of correctly identified BCS cases (sensitivity, or true positive rate) to those correctly classified as HC (specificity, or precision) for a given classification model. The AUROC was formally compared between all models using the non-parametric Delong test (DeLong et al., 1988). Pairwise comparisons were corrected using the Benjamini-Hochberg False-Discovery Rate (FDR) (Benjamini & Hochberg, 1995). Two additional ROC-based metrics are reported that characterize model performance based on the distribution of predicted class probabilities as opposed to overall model accuracy. The Brier score is a cost-function that indicates how well a set of predicted probabilities match their respective classes on average (Brier, 1950). Lower Brier scores (0-1) indicate better model performance. Informedness represents how informed a set of predictions are relative to chance and is defined as the difference between true and false positive rates. Informedness values range from -1 to 1 with zero representing chance. Values less than chance indicate a model which is strongly biased toward the negative class resulting in a greater proportion of false positive and false negative predictions.
The ability to compare multiple models using a specific set of performance evaluation criteria permits a comprehensive assessment of (1) demographic & self-report data, (2) performance on
ANALYSES & HYPOTHESES
Primary Aim 1:Determine if individuals suffering from chemotherapy-related cognitive
impairment can be distinguished from age-matched healthy control participants. This aim
systematically addresses limitations and inconsistencies inherent to previous research regarding the precise nature of CRCI in BCS by modeling high-dimensional non-linearities between factors implicated in CRCI. All available features surviving the initial EDA served as predictors in the random forest model and were used to classify BCS vs HC. Although groups were matched on age and IQ, these measures were included as features of interest given that minor variations in age or IQ may interact with other features within a given model and subsample of participants. From this full-model, obtained estimates of average classification accuracy, ROC-based metrics, and variable importance estimated via 5-fold cross-validation are reported. Permutation testing was used to gage model performance compared to random chance (Feczko et al., 2018; Rudolph et al., 2018).
Hypotheses: I hypothesized that a comprehensive modeling approach would result in a greater
than chance random forest classification model that accurately distinguishes BCS from HC. Overall, compared to neuropsychological assessment summary scores, I hypothesized that performance metrics from experimental cognitive neuroscience paradigms would be weighted more heavily in classification models (i.e. greater variable importance contributing to model accuracy). Based on previous literature, I hypothesized that fatigue and depression would rank higher in importance than other self-reported