188
EXPLORING THE COMPETITIVENESS, OF THE GREEK FISHERIES
SECTOR
Christos Karelakis1, Efstratios Loizou2, Marius Vladu3 1
Democritus University of Thrace, School of Agricultural and Forestry Sciences, Department of Agricultural Development, Pantazidou 193, Orestiada Greece
2Technological Education Institute (ΤΕΙ) of Western Macedonia, Division of Agricultural Economics
– Dept. of Agricultural Technology, Terma Kontopoulou, 53100 Florina, Greece.
3University of Craiova, Faculty of Agronomy , Craiova, Dolj, 200 421, No 19 Libertatii, Street,
Romania Corresponding author: [email protected]
Keywords: Exports; Competitiveness; Greece; European Union; Intra-industry Trade index
ABSTRACT
The debt crisis in Greece has revealed the prolonged problems of the Greek economy and led to drastic fiscal consolidation measures and reforms in labour, products and services. However, structural changes must be escorted by the application of an aid strategy of introspection in order to develop the dynamic sectors of the Greek economy and promote Greek exports to international markets. The fisheries sector is a successful example for Greek agricultural enterprises. Aquaculture products are the major export products in the Greek food industry, representing a significant value of total food exports. The present study aims to identify and analyse the competitive position of the Greek fisheries sector to the EU market through the assessment of specific intra-industry trade indices. Data were obtained for five major EU producer and exporting countries and key intra-industry trade indices were estimated. The results indicate that the image of the Greek fisheries sector seems dynamic and productivity allows the Greek market to export and be competitive. Trade balance remains positive and growing steadily, confirming the export orientation of the sector. It is worth mentioning that the sector competes and outperforms developed economies and specialist fleets such as Italy, Spain, France and Denmark.
INTRODUCTION
Over the past decades, a combination of political, economic and social factors contributed to the perpetuation of the country’s low competitiveness and halted foreign investment. Key contributors involved the bureaucracy, the lack of flexibility in the labor market, the delayed release of professions and sectors of economic activity, the inadequate institutional context and the complicated tax system. These conditions created high operational costs for businesses being competitive disadvantageous compared to foreign competitors, while discouraged the foreign investment in the country. The debt crisis in Greece has revealed the chronic problems of the Greek economy and led to drastic fiscal consolidation measures and reforms in labor, product and services. However, any structural changes must be accompanied by the implementation of a strategy to enhance the introspection, to develop the dynamic sectors of the Greek economy and to promote Greek exports to international markets.
189
Greece is the largest producer in the world into two kinds of fish (sea bream and sea bass), producing approximately 35% of the world production and exporting more than 85% of the total production. Fishing products are the major export products in the Greek food industry, representing a value of more than about 12% of the total food.
The 'fisheries sector' is quite complex and when referring to "catch" does not mean only the fishery products (i.e., fish, molluscs, etc.), but in general the products from the aquatic environment (freshwater or saltwater). Basic productive sources of catches are the fishing sector and the sub-sector of a developing aquaculture. Fishing and aquaculture are a highly growing industry in the Greek economic reality and the factor that makes the highest contribution is the geomorphological peculiarity of Greece, which allowed both the installation of aquaculture units and the development of fisheries, particularly coastal (Anastasiadou et al., 2012).
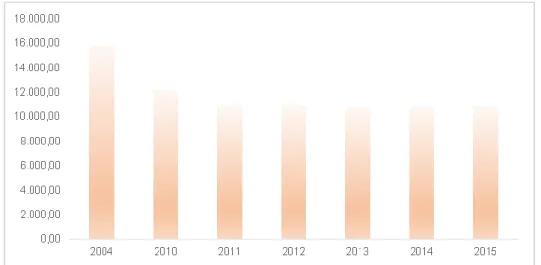
Sea fishing is divided into coastal, middle and overseas. Coastal fishing refers to small fishing vessels operating close to shore while the tools used are mainly the net, longline, harpoon and traps. The middle fishing refers to larger vessels that fish in deeper waters, while overseas fishing refers to special vessels suitable for overseas trips with freezing capabilities (Polymeros et al., 2010). According to the Hellenic Statistis Service, only 0.1% of the fleet in 2014 performed overseas fishing, 9.4% performed middle fishing and the majority of the fleet with more than 9 out of 10 boats performed coastal fishing (Helstat, 2016). Those working on the fishing vessels did not exceed 10,800 thousand employees, while there is continuous reduction in their number in the recent years, with a decrease of over 13.5% between 2004 and 2015 (Figure 1). The number of employees seems small for the measures even the Greek economy, however, the fishing activity is linked with a number of professions and retains a large number of jobs, such as the maritime professions (occupational activities concerning jobs for supporting and supplying the vessels, fuel, food, etc.) and shipbuilding professions (refered to occupational activities for the study-design and construction - repair of vessels).
Figure 1 Evolution of the number of emloyees in the fishing vessels (2004-2010)
190
five years there is a constant trend for the total production of fishery products, notwithstanding the gradual reduction of the fishing fleet (Eurostat, 2016).
Even if the fisheries sector has shown a downward trend, both in terms of employment and fishing fleet conditions, it remains strong in some regions of the country. The fishing activity is concentrated to a large extent in the country’s islands, since these regions (North Aegean, South Aegean, Crete and Ionian Islands) account for approximately 45% of total employment in the fisheries sector. If we additionally account the rest islands of the country, such as Evia and smaller islands such as the Sporades, Samothrace, Thassos and the islands of the Saronic Gulf, then the islands represent more than 605 of total employment in the fisheries sector. (Kaimakoudi et al., 2012). This highlights the fisheries sector is one of the most important sectors of the food industry, representing the first place in production between countries of commercial species of the European Union aquaculture of fish and the Mediterranean and the second in exports of the food and beverage industry (Polymeros and Katrakylidis, 2008).
As regards competitiveness, the term has been widely used in the literature on economic and policy aspects of business, although the definition has not been widely agreed yet. Competition refers to a number of “players” in a given market, as well as the market share, the sustainability of this share and profitability. The level of competition, for an industry in a given market, depends on the following aspects: a) the number of new entrants, b) the existence of substitute products, c) the bargaining power of suppliers, d) the bargaining power of buyers, and e) competition among existing firms in the market (Porter 1998). Competition is a dynamic concept since new products, new marketing methods, new production processes and new markets are positively correlated with the ability of firms to compete in international markets. Nonetheless, the most suitable business background formulation to be competitive and viable in international markets invlolves the strong domestic competitiveness (Polymeros and Katrakylidis, 2008).
Bearing in mind the aforementioned, the objective of the present study is to identify and analyze the competitive position of the Greek fishing to the EU market through the assessment of specific intra-industry trade indices. The remainder of the paper includes the materials and methods in the next section, where the intra-industry trade indices are described, followed by the results of the study. The last section concludes.
MATERIALS AND METHODS
Globalisation involves, nowadays, more and more economies to international trade, which increases competition. International trade is distinguished in inter-industry, that refers to the exchange of goods belonging to different productive sectors and intra-industry, which concerns the exchange of products belonging to the same production sector. Alogoskoufis (2012) argued that the percentage of intra-industry trade in the total international trade has increased significantly over the last fifty years, while highlights the intra-industry trade as the engine of the single European market.
The European Union (EU) is the largest economy, the largest importer and exporter, a leading investor and recipient of foreign investment, as well as the biggest aid donor. Given that its inhabitants represent 7% of the world population, the EU produces one quarter of the global wealth in terms of gross domestic product (GDP), i.e., the total value of produced goods and services (Eurostat, 2016). The present study approaches and describes the characteristics of intra-industry trade of the fishing sector in Greece and its main competitors on the EU market. To achive this objective we used specific trade indices such as those described in the relevant literature.
191
1.1. Intra-Industry Trade
Intra-industry trade occurs when a country imports and exports both similar types of goods or services (the similarity is determined by the goods or services classified in the same 'field') (Kim and Marion, 1997). Suppose an example that focus on food and in particular, fishes. Intra-industry trade occurs if, for example, Greece exported fishes to Spain while introducing fishes from Italy. According to the classical trade view, Greece should have specialized in fish production in order to fully meet its needs and to import other types of goods (for example cars). The classical theory of trade (Ricardo, Mill), and the modern theory (Heckscher-Ohlin theorem, theory of comparative costs) focus on intra-industry trade. Cases like this, i.e., the existence of intra-intra-industry trade, can be found in the international literature back in '60s (Verdoorn, 1960), (Balassa, 1966) and related mainly to the growing volume of trade between European countries (Karagounis and Polymeros, 2012). Thus intra-industry trade was divided into (Kim and Marion, 1997):
Horizontal, i.e., the simultaneous import and export of products classified in the same sector and the same stage, and
Vertical, namely the simultaneous import and export of products classified in the same sector but are at a different stage.
Herbert Grubel and Peter Lloyd (1975) published the first empirical study of the importance of intra-industry trade, suggesting methods of estimation. This method is also the most frequently used method of measuring the extent of intra-industry trade, the index proposed by Grubel and Lloyd became known intra-industry trade Grubel Lloyd index. The Grubel Lloyd index is calculated when the value of exports and imports of a country is known for a particular sector and for a specific period as follows:
i i i i i i i i i i i M X M X M X M X M X GL
( ) | | 1 | | ; 0 ≤ GLi ≤ 1
Where: Xi, exports of the good or service i, Mi, imports of the good or service i.
The values of the Grubel Lloyd index range from 0 to 1, where a value of 1 means that there is only intra-industry trade, and consequently there is no inter-industry trade. Conversely, if the index GLi takes the value of 0, that means that there is no intra-industry trade, and consequently all commercial transactions are qualified as inter industry trade; the country only makes exports or only imports of the good or service i. Investigation of intra-industry trade will be with the help of index Grubel- Lloyd.
1.2. Intra-Industry Trade Indices
For a better understanding of intra-industry trade, certain indices are introduced in the current analysis. The Import Coverage Index (ICI), refers to the ratio of export value to the value of imports.
Where:
Xi, exports of the good or service i, and Mi, the imports of the good or service i.
This indicator shows the share of the value of exports absorbed by the value of imports. As the imports coverage is greater the more the country is oriented to produce the product for export rather than to meet domestic consumption needs (Zoukidou, 2014).
192
Where: Xi, exports of the good or service I and Mi, imports of the good or service i.
The index takes values from zero (the product is purely export oriented) to one (the product is exclusively imported). When the index value is about 0.5, then the country exports as it imports and consequently this should be associated with the trade balance, which in this case should be close to zero (Vlachos and Patsis, 1998).
The Net Export Index (NEI), indicates whether there is a country specialized in in the marketing of a product in connection with another country, as in the following equation:
ij ij
ij ij
M
X
M
X
NEI
ij
Where: Xi, the exports of the good or service i, j for a country with a market, and Mi, the imports of the good or service i, j for a country of the same market. The index describes the trade relations between the two countries.
The country with the most favorable production and marketing conditions in an industry will make greater exports than imports. The index values range from -1 to +1, meaning that when the value is equal to 1 then the country j is completely specialized in the trade of goods i compared to the other country. The specific index is associated with the trade balance, so a positive value means a positive trade balance of product i to country j as in the other country. Still, the index has disadvantages that occur when a country is self-sufficient in a good and simultaneously makes minor exports. In this case the index gives a value equal to 1, even though the exports volume is small.
The Revealed Comparative Advantage Index (RCA) is defined as the export share of country j, for the good or the service i in the total exports of country j, to the corresponding export share of country k, for good or service i in total exports of country k, as follows:
Sk ik
Sj ij
X
X
X
X
RCA
/
/
ij
Where: X, exports of the good or service i, or all of the goods and services S and j & k, the countries under study. When the index takes values larger than one, then exports of the good i, have a higher contribution to total exports of the country j relative to the country k. In this case, the country j displays a relative comparative advanvantage compared to the country k.
1.3. Sampling
In the current study five EU countries were selected. The Greek fishing sector is compared to the sectors of Italy, France, Spain and Denmark that were chosen because i) all countries operate withing the institutional framework of the EU, ii) The first three countries are in the Mediterranean Sea as well as Greece and iii) Denmark has a considerable fleet, large volumes of catch, rich maritime and fishing tradition and ensures comparability as it is market that operates outside the Mediterranean, iv) they are neighboring countries, where fishing catches are consumed and hence, the investigation of intra-industry trade is possible. Data were collected from the United Nations database (http://comtrade.un.org/data/), and concerned fishing catches as a whole.
RESULTS
193
products for each country. the catch export statistics of countries under investigation. It is clear that the largest exporter is Spain, whose exports exceed $2.44 billion, along with Denmark that occupies the second place, exporting more than $2 billion on average. Impressively, Italy is found at the last place with less than $05 billions on average.
Table 1 Exports (in 1.000.000 $)
Country Mean Median Variance Standard
Deviation
Greece 569,39 587,03 25734,47 160,42
Italy 484,61 497,52 6216,85 78,85
France 1327,10 1303,17 22033,12 148,44
Spain 2440,37 2494,14 155325,70 394,11
Denmark 2085,07 2094,55 34591,67 185,99
Table 2 displays the import volume for each country, where Greece recorded the lowest import volume, with approximately $432million. On the contrary, Italy and Spain import more than $1 billion worth of fish catches.
Table 2 Imports (σε 1.000.000 $)
Country Mean Median Variance Standard
Deviation
Greece 432,87 420,52 4828,94 69,49
Italy 3876,95 4003,31 375350,97 612,66
France 4111,11 4201,36 493549,21 702,53
Spain 5586,64 5483,49 403356,71 635,10
Denmark 1352,56 1395,25 21185,49 145,55
Particularly, a more integrated picture of the trade balnce of these countries is depicted in Figure 2. Denmark (yellow) exhibits a stable and positive trade balance of close to $250 million and Greece (blue) has a positive trade balance with constant growth. The trade balance of Spain (red), France (orange) and Italy (green) are notoriously deficient, especially having a decreasing trend until 2008.
194
Table 3 illustrates the descriptive statistical measures of the Grubel Lloyd index of intra-industry trade in fish catches in the countries from 2003 to 2012. Large index values showing that the type of trade show is intra-industry are depicted for Greece (0.88) and Denmark (0.79). Average values of interindustry-trade are indicated for Spain (0.61) and France (0.49), while low values are observed for Italy (0.22).
Table 3 Grubel Lloyd Index
Country Mean Median Variance Standard
Deviation
Greece 0,88 0,93 0,01 0,11
Italy 0,22 0,23 0,00 0,02
France 0,49 0,51 0,00 0,05
Spain 0,61 0,59 0,00 0,05
Denmark 0,79 0,79 0,00 0,02
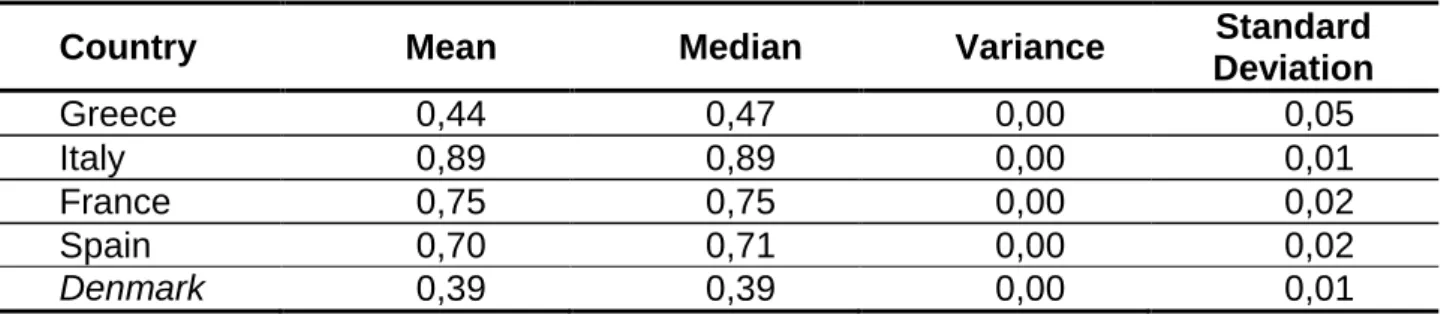
Table 4 refers to the import penetration index of the countries under investigation. It is clear that Spain (0.7), France (0.75) and Italy (0.89) are the countries which mainly import fishing products and Greece and Denmark are the countries that generally tend to export fish products.
Table 4 Import Penetration Index
Country Mean Median Variance Standard
Deviation
Greece 0,44 0,47 0,00 0,05
Italy 0,89 0,89 0,00 0,01
France 0,75 0,75 0,00 0,02
Spain 0,70 0,71 0,00 0,02
Denmark 0,39 0,39 0,00 0,01
The net export index for Greece is illustrated in Table 5 for the period 2003 to 2012. The results show that the Greek market is quite specialized compared to the Italian fish market and is also has enough expertise relative to the French market and definitely has an advantage over the Spanish market.
Table 5 Net Export Index Greece
Country Mean Median Variance Standard
Deviation
Italy 0,80 0,81 0,00 0,03
France 0,58 0,58 0,00 0,07
Spain 0,28 0,28 0,01 0,10
Denmark -0,92 -0,95 0,00 0,06
195
Table 6 Net Export Index Italy
Country Mean Median Variance Standard
Deviation
Greece -0,77 -0,78 0,00 0,03
France -0,83 -0,82 0,00 0,02
Spain -0,51 -0,51 0,01 0,09
Denmark -1 -1 0,00 0,01
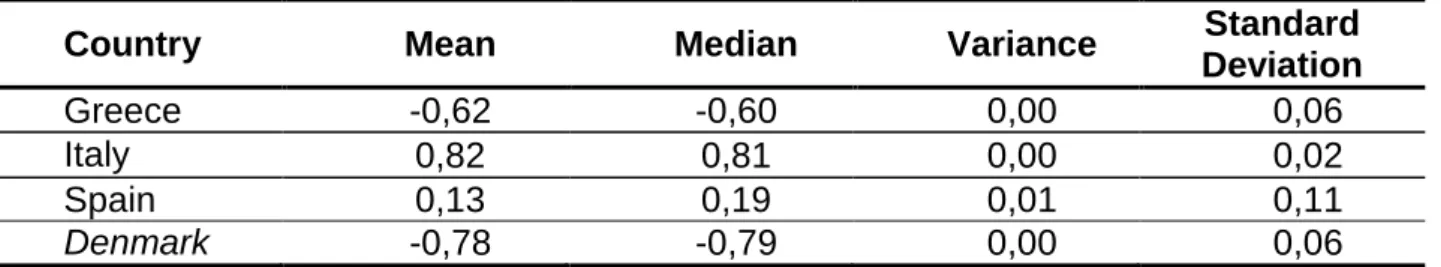
As for France, (Table 7), the values of the net export index show the Greek and the Danish economy maintain the strong expertise in fish trade with France. The specialization is almost balanced with the Spanish fish market, whilst greatly outweighs the Italian market.
Table 7 Net Export Index France
Country Mean Median Variance Standard
Deviation
Greece -0,62 -0,60 0,00 0,06
Italy 0,82 0,81 0,00 0,02
Spain 0,13 0,19 0,01 0,11
Denmark -0,78 -0,79 0,00 0,06
Table 8 lists net export index of Spain in relation to the other countries for the period 2003 to 2012. The values show a clear specialization of Spain against Italy on fish trade, where the opposite is revealed with Denmark. Greece and France seem to have a slight advantage in specialization compared to Spain, whereas the net export index values for Denmark indicate significant expertise advantage over all of countries.
Table 8 Net Export Index Spain
Country Mean Median Variance Standard
Deviation
Greece -0,22 -0,23 0,01 0,11
Italy 0,51 0,47 0,01 0,11
France -0,17 -0,21 0,01 0,09
Denmark -0,90 -0,91 0,00 0,02
Finally, the assessment of revealed comparative advantage index (Table 9) may provide further information on the trade relations of the studied countries with the Greek market. The index shows the dynamics of the Greek market related to the markets of Italy, France, Spain and Denmark. Comparing the Greek and the Danish market, it is clear that a balance is present between fish exports and the total volume of the two countries' exports. Greece has a comparative advantage in fish exports compared with Spain (indicator value 2.42) and France (indicator value 9.47). The value of the index with Italy reaches 22.94 indicating a large comparative advantage in fish exports.
196
Table 9 Relative Comparative Advantage Index for Greece
Country Mean Median Variance Standard
Deviation
Italy 22,94 22,47 8,76 2,96
France 9,47 8,80 2,31 1,52
Spain 2,42 2,32 0,09 0,30
Denmark 1,14 1,09 0,05 0,21
DISCUSSION-CONCLUSIONS
At a time when the extroversion of Greek economy is a desired issue, the rational export orientation can yield significant benefits. The present study aimed to investigate and detect the potential of the fisheries sector in Greece and in particular its export dynamics. The use of a key trade indices from the international literature allowed for a complete investigation of the sector’s competitiveness with the EU modern environment and particularly, the single fish market that is characterized by great opportunities, but is governed by strict regulations. For comparison reasons, the Greek fish market contrasted with the Italian, French, Spanish and Danish. Accordingly, the picture of the Greek fisheries sector seems dynamic. Productivity allows the Greek market to export and be competitive and the trade balance remains positive and growing steadily, confirming the export orientation of the Greek. Intriguingly, the sector competes and outperforms developed economies and specialist fleets such as Italy, Spain, France and Denmark.
Nevertheless, it is worth mentioning the two factors that somewhat justify the superiority of Greece compared to technologically and economically developed countries. The first one refers to the debt crisis in Greece. The consequences of the policies pursued reduced the domestic demand for goods and thus the volume of imports. Simultaneously, the reduced purchasing power of consumers in the local market, released the produced fishing catches that were consumed domestically and made them available for export; ultimately boosting fish exports. As shown in the following Figure 3, the year 2008 is a turning point for imports showing downward trend, while the rate of export growth increases.
Figure 3 Imports and Exports of fishing products of Greece (2003-2015)
197
transferring their comparative advantage in the secondary and tertiary sector. The industrial products of these economies, as well as the services they produce, allow for higher efficiency gains than the fishing catches that are critical for the primary sector. Another key conclusion is the ease of penetration of fishery products in the neighboring market of Italy. Given the deficit trade balance of the Italian market, the Greek market may even strengthen further, aiming solely to the Italian market.
Trading volume in the EU fish markets is very large in relation to the Greek fisheries sector. Therefore, it seems that there are possibilities and margins both for further development of the sector, but mainly for the penetration of the Greek economy in the EU markets. A typical example of the market is Italy, where exports can and should be a challenge for the Greek market. Nonetheless, export movements, in order to be successful, usually have the condition that the fish demand bearing in mind the seasonality, the required varieties and price variance have to be investigated in depth.
In this process it would be beneficial to clarify the image of the EU markets. An effective tool for the development of the sector would be the modeling of EU fish markets, and the possibility for demand forecasting. This could be achieved with the use of an enlarged model of fish trade using a variety of factors and investigating the following essential issues. The specificity and selective study of market and trade of specific species and not of the fishing catches in general. The demand for specific species requires an in-depth investigation of the existence of complementary or substitute products. Furthermore, the investigation of the demand for particular fish species and whether it is associated with outdated tastes and how it is affected by promotion trends and marketing.
Another issue involves the investigation of seasonality in demand for fish and seasonality in fish production. This will help to the specialization and production (especially controlled in fish farming), of catches that have increased demand and increased profit margins. Also the exploitation of demand fluctuation in opportunistic markets, usually local markets but with increased seasonal tourism. Finally, the investigation of the fish and the potential for production, both in controlled conditions and the sea, aiming for the sustainable development of the industry. Such a development model will benefit the Greek economy, delivering multiple economic benefits.
The fishing sector in Greece that has shown a significant export orientation and growth in the recent years, has becoming a leader in the production and marketing of Mediterranean fish, confronts challenges and prospects outlined in the international business and market environment. Within this context, systematic and targeted actions are needed for amendements in the production, standardization and promotion of fishing products. Likewise, there is a need to find new methods of economies of scale and to concentrate production and management to specialized and export-oriented companies. This could lead to a reduction in product prices and increase export competitiveness.
REFERENCES
Anastasiadou Ch, Koukaras Κ., Nikolopoulou Η., Kampouris Th. and Kampouris S. (2012), Fish and organisms of inland waters of Greece, Aristotle Univerisy of Thesaloniki Publishing, Thessaloniki (in greek).
EUROSTAT (2016). Fisheries Statistics, Available at.
http://ec.europa.eu/eurostat/web/fisheries/data/main-tables
Hellenic Statiscs Service (2016) Fisheries Database, Available at:
http://www.statistics.gr/el/statistics/agr
198
Karagounis C, Polymeros K (2012). Investigation of the Competitiveness of Greek Sea Beam in the European Union Market. Proceedings of the 11th Panhellenic Conference of Agricultural Economics, Thessaloniki.
Kim D, Marion BW (1997). Domestic Market Structure and Performance in Global Makets: Theory and Empirical Evidence from US Food Manufacturing Industries. Review of Industrial Organization, 12:335-354.
Polymeros K, Katrakilidis K (2008). The Dynamic Characteristics of Competitiveness in the EU Fish Market. The International Journal of Economic Issues, 1: 25-42.
Polymeros, K., Karelakis C. and Kaimakoudi E., (2010). A path analysis approach in investigating the performance of the Greek fisheries market. Food Economics - Acta Agriculturae Scandinavica, Section C, Vol.7, Issue 02-04, pp.128-138.