264
PRIMARY OFFER FOR SOME ZOOTECHNICAL PRODUCTS
IN THE MUNICIPALITY OF VITOMIREŞTI (2016-2018)
MEDELETE D.M., PÂNZARU R.L.
Faculty of Agronomy, University of Craiova
Key words: livestock, supply, total production, medium production
ABSTRACT
Livestock farming in Romania is of food, industrial importance, valorization of secondary fodder resources, use of labor resources, export, profit sources.
The municipality of Vitomireşti, through its surface, represents 0.84% of the total county area. In the context of agricultural production, the municipality holds 0.59% of the total county agricultural area and 0.44% of the county arable area.
As regards livestock, it can be noted that the locality has variable weights as follows: 2.63% for bee families; 0.84% for bovine animals; 0.58% for ovine animals; 0.46% Equines; 0.44% for swine; 0.36% in poultry; 0.16% in goats.
If we report the total production of the zootechnical sector to the county situation, the following weights may be highlighted: 1.85% of honey production; 0.37% of egg production; 0.18% sheep and goat milk; 0.10% of total County milk production.
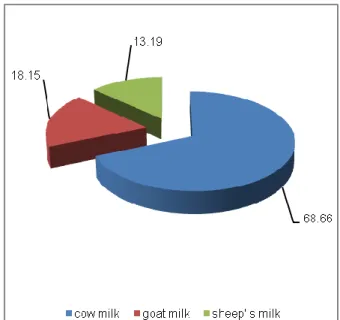
The structure of total milk production (612 hl) was as follows: 68.66% cow's milk; 18.15% goat milk; 13.19% sheep's milk.
INTRODUCTION
Located in the northern part of Oltcounty, which belongs to the ancient times, the commune of Vitomirești is at a distance of 83 km from the municipality of Slatina as a county residence, 63 km from Pitești, 54 km from Rm. Vâlcea. The closest city is the town of Drăgășani, which is 45 km away.
Geographically, Vitomirești
commune is located in the northern part of Olt county between the meridians of 24 ° and 15 ′ east longitude and 24 ° and 30 ′ east longitude, bordering to the north and northwest with Vâlcea county, respectively the communes of Dănicei and Stoilești; to the south by Sâmburești and Dobroteasa - Olt county, and to the west by Drăgoiești and Olanu localities from Vâlcea county.
The settlement of the commune confers a temperate - continental climate in which the seasons are distinguished precisely by elements of the hill with the winters not too cold but, in contrast, with strong meadows and warm summers.
The commune's hydrological
network includes temporary and
semi-permanent flowing waters and
groundwater.
The surface waters have a high density, attributing to the relief a strong fragmentation. All are collected directly or through 1st degree tributaries from the Olt River. They belong to the Olt basin and have a varied flow regime.
The commune of Vitomirești, prevalent on the hills, presents site-specific soils, predominating the brown-podzolic type, which crosses the brown and podzolic soils. This soil has a lower degree of fertility, depending on the thickness of humus, which usually varies between 10-20 cm. The color of the brown forest soil is brown or yellowish-brown.
3 The cultivation of vines is one of the oldest tasks in the locality and its surroundings.
In the specialized studies, we talk about the fruit-growing basin of Vitomiresti. The name is fully deserved. This assignment is sent from generation to generation from ancient times.
The development of the vine-fruit sector was dictated by the pedo-climatic conditions favorable to this culture.
According to the 2011 census, the population of Vitomiresti commune stands at 2,282 inhabitants, decreasing from 2002 when 2,746 inhabitants were registered. The majority of the inhabitants are Romanian (96.06%). For 3.94% of the population, ethnicity is not known. From the confessional point of view, the majority of the inhabitants are orthodox (95.66%). For 3.99% of the population, the confessional membership is not known.
In the spoken language, we notice a mixture of the mountain dialect with the Oltenian dialect, which can be explained by placing the locality at the intersection of the two determined historical regions.
In Vitomirești commune the utilities networks are materialized in: electricity, mail, telephony and internet, cable, drinking water supply, transport, etc.
Since 2002, cable television has been introduced. Currently, the villages of Vitomiresti, Bulimanu, Stănuleasa, Trepteni, Dejești and Donești have cable television network.
Feeding the locality with drinking water is one of the great achievements. In all the component villages, the households are connected to the distribution network through individual connections. The whole network is
metered. The locality has two
workstations, equipped with modern technology that fetches drinking water from deep wells supplying the distribution network through PVC pipes.
In Vitomirești commune the
distribution network of drinking water is developed on the length of 37.60 km, with
a number of 850 households subscribing. The distribution network is supplied to the villages of Vitomiresti,
The transport of people from Vitomirești locality, as well as the connection with the neighboring localities and urban centers (Slatina, Drăgășani, Rm. Vâlcea, Pitești, etc.), is provided by minibuses for the transport
of people through specialized
companies (on the
Vitomirești-Drăgășani, Vitomirești - Vitomirești routes Pitești; Vitomirești- Rm. Vâlcea and a bus on the Vitomirești –Slatina route).
At the commune's level we discuss a variety of species, in operation: cattle, pigs, sheep, goats, birds, horses and bees.
METHOD AND MATERIAL
The paper presents the evolution of livestock, total and average production, for the period 2016-2018. For this purpose, the statistical data provided by the Vitomiresti City Hall were used.
The elaboration of the paper presupposed the use of the comparison method in time and space. For this purpose, the annual and multiannual average of the monitored phenomena were analyzed.
As a result, dynamic series were built, during which the first component year (2016) became a reporting term.
4 RESULTS AND DISCUSSIONS
Table 1 includes the data for the situation of the workforce distributed across different activity directions.
It can be seen that in the milk production level the number of cattle used ranged from 85 heads in 2016, to 95 heads in 2017, while the average period reached 90 heads (level similar to 2017).
The dynamics of the indicator underline the uneven evolution of the numbers.
In sheep, the numbers used in milk production ranged from 400 to 432 heads
in the case of 2018 and 2016
respectively. In these conditions, the average period reached 417 heads. The evolution of the indicator was strictly downward.
Table 1.
The number of animals on operating directions
Specification
Year
Period average**
2016 2017 2018
Effective* heads
Dynamic**
Effective* heads
Dynamic**
Effective* heads
Dynamic**
Effective heads
Dynamic
Ibf Ibm Ibf Ibm Ibf Ibm Ibf Ibm
Milk
-cattle 85 100 100 95 111.76 111.76 90 105.88 94.74 90 105.88 100.0
- sheep 432 100 100 420 97.22 97.22 400 92.59 95.24 417 96.53 104.25
- goats 107 100 100 90 84.11 84.11 118 110.28 131.11 105 98.13 88.98
Eggs 3,950 100 100 4,000 101.27 101.27 5,580 141.27 139.50 4,510 114.18 80.82
Wool 680 100 100 790 116.18 116.18 571 83.97 72.28 680 100.0 119.09
Honey 850 100 100 950 111.76 111.76 900 105.88 94.74 900 105.88 100
*primary records, Vitomiresti City Hall **my calculation
For goats, there was an average of 105 heads, with variation limits from 90 heads in 2017, up to 118 heads at the level of 2018. The indicator is on an uneven trend.
The number of laying birds ranged from 3,950 to 5,580 in 2016 and 2018, respectively, with the average period
being 4,510 heads (if 2017 is
characterized by a 4,000 head). The
dynamics of the indicator highlights its upward trend.
For the production of wool, it is considered that the entire herd of livestock was used, a situation similar to that specific to honey production (all bee families being exploited as such).
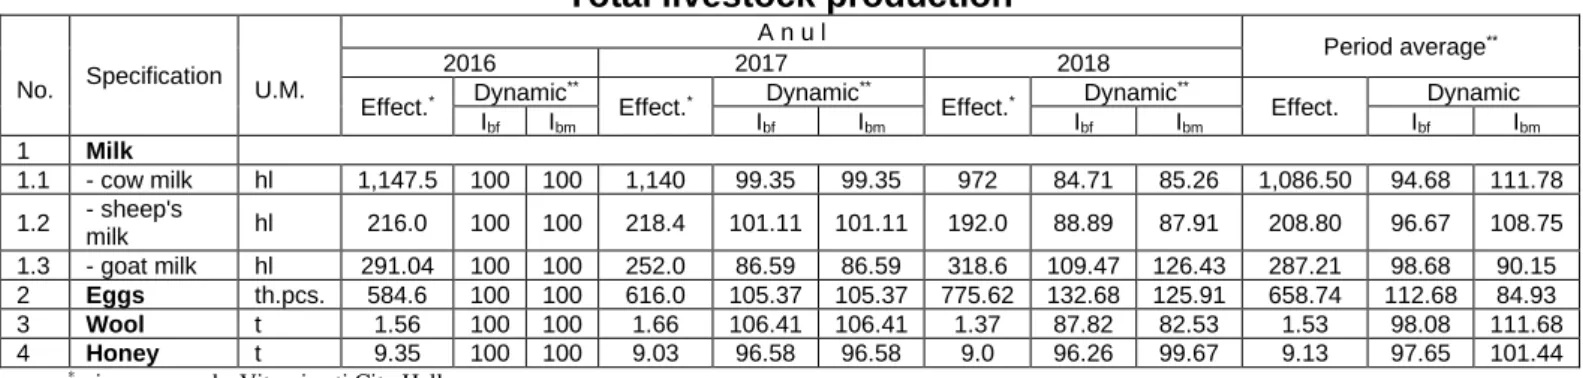
Data for total milk, meat, egg, wool and honey production levels are presented in Table 2.
Table 2.
Total livestock production
No. Specification U.M.
A n u l
Period average**
2016 2017 2018
Effect.* Dynamic** Effect.* Dynamic** Effect.* Dynamic** Effect. Dynamic
Ibf Ibm Ibf Ibm Ibf Ibm Ibf Ibm
1 Milk
1.1 - cow milk hl 1,147.5 100 100 1,140 99.35 99.35 972 84.71 85.26 1,086.50 94.68 111.78 1.2 - sheep's milk hl 216.0 100 100 218.4 101.11 101.11 192.0 88.89 87.91 208.80 96.67 108.75 1.3 - goat milk hl 291.04 100 100 252.0 86.59 86.59 318.6 109.47 126.43 287.21 98.68 90.15
2 Eggs th.pcs. 584.6 100 100 616.0 105.37 105.37 775.62 132.68 125.91 658.74 112.68 84.93
3 Wool t 1.56 100 100 1.66 106.41 106.41 1.37 87.82 82.53 1.53 98.08 111.68
4 Honey t 9.35 100 100 9.03 96.58 96.58 9.0 96.26 99.67 9.13 97.65 101.44
*primary records, Vitomiresti City Hall **my calculation
The total production of cow's milk was between 972 hl, in 2018, and 1,147.5 hl, at the level of 2016, the average period being 1,086.5 hl. The dynamics of the indicator highlights its downward
3 The average is lower by 5.32% compared to the first term of the dynamic series, but it is higher by 11.78% than the previous term (2018).
In the case of sheep, there was an average of milk production of 208.8 hl, the average based on sequential annual levels of: 216 hl in 2016, 1,218.4 hl in 2017 (+ 1.11% in dynamics), 192 hl for the year 2018 (decreases by 11.11 and 12.09% respectively compared to the reference bases).
The goats provided between 252.0 and 318.6 hl of milk (2017 and 2018 respectively), the average being 287.21 hl (under the conditions of a level of 291.04 hl in 2016). The dynamics of the indicator highlights its sinuous evolution - decreases by 13.41% in 2017 compared to 2016, increases by 9.47 and 26.43% respectively compared to the reporting terms in 2018 (subunit values for fixed base indices and subunit for those with mobile base - in the case of the average of the period - 98.68 and 90.15% respectively).
The birds provided, on average, 658.74 thousand pieces of eggs (+12.68 and -15.07% compared to the reporting
terms). This situation was induced by annual sequential levels of 584.6 thousand pieces in 2016, 616.0 thousand pieces in 2017, respectively 775.62 thousand pieces in the case of 2018 (+32.68 and + 25.91% compared to the reference bases).
Under the ratio of wool production, there are limits of 1.37 t in 2018 and 1.66 t in 2017, the average period being 1.53 t (-1.92 and + 11.68% in dynamics). The evolution of the indicator is uneven, the increases in 2017 (+ 6.41% compared to the first term of the dynamic series - 1.56 t), followed by decreases in 2018 (-12.18 and -17.47% respectively compared to the comparison bases).
The beekeeping production sector provided between 9.0 and 9.35 tons of honey (2018 and 2016 respectively), the average of the indicator being 9.13 t. with 2016, followed by other decreases in 2018 (-3.74 and -0.33% respectively compared to the reporting terms).
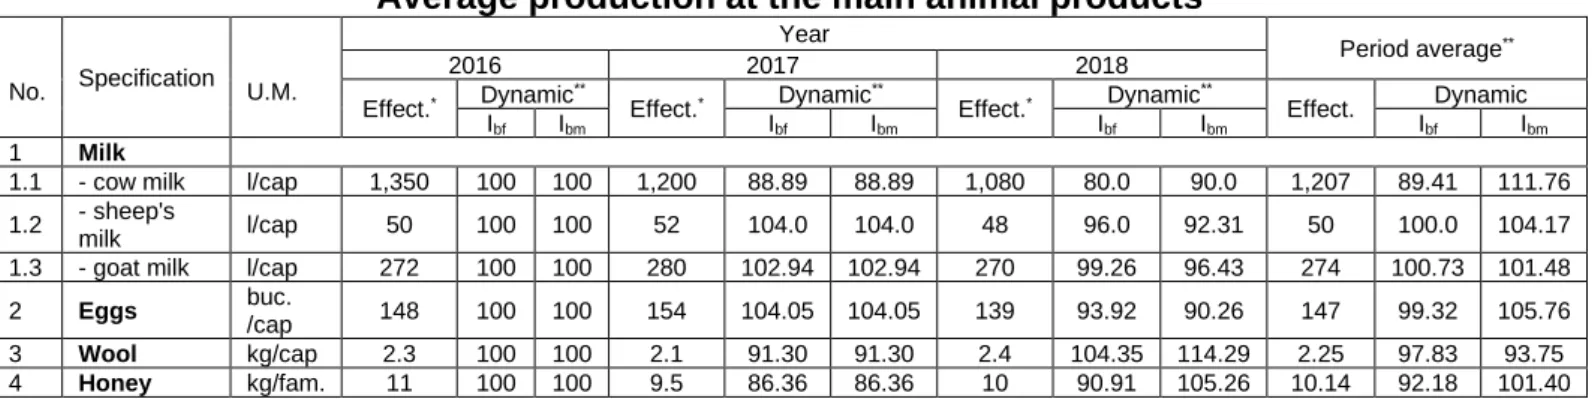
The data on the average
productions, specific to the zootechnical sector, of production, are included in table 3.
Table 3.
Average production at the main animal products
No. Specification U.M.
Year
Period average**
2016 2017 2018
Effect.* Dynamic** Effect.* Dynamic** Effect.* Dynamic** Effect. Dynamic
Ibf Ibm Ibf Ibm Ibf Ibm Ibf Ibm
1 Milk
1.1 - cow milk l/cap 1,350 100 100 1,200 88.89 88.89 1,080 80.0 90.0 1,207 89.41 111.76 1.2 - sheep's
milk l/cap 50 100 100 52 104.0 104.0 48 96.0 92.31 50 100.0 104.17
1.3 - goat milk l/cap 272 100 100 280 102.94 102.94 270 99.26 96.43 274 100.73 101.48
2 Eggs buc.
/cap 148 100 100 154 104.05 104.05 139 93.92 90.26 147 99.32 105.76
3 Wool kg/cap 2.3 100 100 2.1 91.30 91.30 2.4 104.35 114.29 2.25 97.83 93.75
4 Honey kg/fam. 11 100 100 9.5 86.36 86.36 10 90.91 105.26 10.14 92.18 101.40
*primary records, Vitomiresti City Hall **my calculation
In the case of milk production, the situation is as follows: the average production per cow was 1,207 l, with limits of variation from 1,080 to 1,350 l - 2018 and 2016 respectively. 11.11 and -10.0% at the level of 2017 and 2018 respectively compared to the previous
3 of the period), against which the absolute variations were: 4 l in the case of 2018, -2 l in -2016 and +6 l for -2017. The indicator performed unevenly for the analyzed period (+ 2.94% in 2017, -0.74 and -3.57% for 2018).
The average egg production was 147 pcs / capita (-0.68 and + 5.76% compared to the terms of reference), with variation limits of 139 pcs / capita in 2018 and 154 pcs / capita at year level 2017. The indicator evolved unevenly, the 4.05% increases specific to 2017, followed by decreases with 6.08 and 9.74% in 2018.
The sheep provided between 2.1 and 2.4 kg of wool / head (2017 and 2018 respectively), the average period reaching a level of 2.25 kg / head. As in most of the cases presented above, the
indicator has evolved unevenly
(decreases by 8.70% in 2017, increases by 14.29% in 2018 compared to the previous year).
The bee family provided a quantity of honey from 9.5 to 11 kg (2017 and 2016 respectively), while the average reached 10.14 kg. The evolution of the indicator is irregular. Thus we discuss the decreases by 13.64% in 2017 compared to 2016, increases by 5.26% for the year 2018 compared to the previous term of the dynamic series.
CONCLUSIONS
The commune of Vitomirești, by its area, represents 0.84% of the total county area. In the context of agricultural production, the commune owns 0.59% of the total agricultural area of the county and 0.44% of the arable area of the county.
With regard to livestock, it can be seen that the locality has variable weights, as follows: 2.63% for bee families; 0.84% for cattle; 0.58% for sheep; 0.46% horses; 0.44% for pigs; 0.36% in birds; 0.16% in goats.
If we report the total productions related to the zootechnical sector, in the county situation, we can highlight the
following weights: 1.85% of the honey production; 0.37% of egg production; 0.18% sheep and goat milk; 0.10% of the total county milk production.
The structure of total milk production (612 hl - fig. 1.) was as follows: 68.66% cow's milk; 18.15% goat's milk; 13.19% sheep's milk.
It is worth noting, the need for the
assiduous development of the
zootechnical sector, both under the ratio of the reinvigoration of the herds, and also through the prism of improving the breed structure of the herds, so that to realize the adequate exploitation of the existing potential, both from a natural point of view and from a point of view. see economic-social.
Fig. 1.Structure of milk production, by species (%)
BIBLIOGRAPHY
1. Barbu C., R.L. Pânzaru, 2000, Agrarian Economy, Hyperion Publishing House, Craiova.
2. Brezuleanu S., 2008, Production systems in agriculture, Alfa Publishing, Iasi.
4 4. Constantin M., 2017, Marketing of Agro-Food Production, Publishing house of the Romanian Academy of Scientists, Bucharest.
5. Pânzaru R.L., Medelete D.M., 2005,
Agrarian Economy - Applications, Universitaria Publishing House, Craiova, 6. Ștefan G., D. Bodescu, A. D. Toma, R. L. Pânzaru, 2007, The economy and the branch of agro-food production, Alfa Publishing House, Iasi.
7. X XX, Vitomiresti City Hall, Primary records
8.http://www.insse.olt.ro/
9.https://ro.wikipedia.org/wiki/Comuna_Vit omire%C8%99ti,_Olt
10.http://www.primariavitomiresti.ro/portal