The difference between individuals and social groups in
multidirectional movement
Yanghui Hu, Jun Zhang*, Weiguo Song*
State Key Laboratory of Fire Science University of Science and Technology of China No.96, JinZhai Road Baohe District, Hefei, China
[email protected]; [email protected];[email protected]
Abstract - Social groups exhibit some degree of social cohesion that is more than a simple collection or aggregation of individuals. The study on behaviours of social groups is essential to gain a deeper understanding on pedestrian dynamics. In this paper, the crowd movement among individuals and social groups are studied by performing a series of multidirectional pedestrian flow experiments under laboratory condition. Interestingly, we found that the speed of individual is not always higher than that of social groups. Pedestrians try to use different strategies to arrive their destination. With different strategies, their speed and movement time show different properties. These findings may provide basis for facility design and evacuation plan.
Keywords: Social group; Individual; Pedestrian dynamic; Speed; Movement time
1. Introduction
The studies on human safety and pedestrian dynamics are growing rapidly in recent years. The comprehensive understanding on pedestrian dynamics is essential for crowd management and facility design. The major component of the crowd is social groups [1-4]. However, most of previous studies focused on individuals but only a few works consider the influence of social groups in a crowd on pedestrian dynamics.
Speed is one of the basic parameters for describing pedestrian dynamics. Many researchers have pointed out that the velocity of social groups is smaller than that of individuals. Moussaid et al. took an observation and found that the walking speed of pedestrians decreased linearly with the increasing of group size [3]. Zanlungo et al. concluded that three-person groups walked slower than two-person groups, and the latter walked slower than individual pedestrians [5]. Li et al. observed that the average velocity of group members (v=1.072 m/s) was smaller than that of individuals (v=1.15 m/s) from a field study [6]. Gorrini et al. focused the impact of different densities on pedestrian velocity [7, 8]. They found that the walking speed of social groups was slower than that of individuals in both low and high densities. Zhao et al. found that the walking speed of individuals was significantly faster than that of dyads both in low and high densities in a subway station [9]. However, from control experiments Wagnlid et al. found that the speed of male dyads was larger than that of male individuals [10]. From these studies, it seems that there is no consensus on the speed difference between social groups and individuals.
Besides, under the same situations individuals and social groups may choose different walking path due to their different flexibility and synergy. Gorrini et al found that the walk path of individual was 4% longer than that of social group through observation [8]. Besides, they noticed that the walk path of adult individuals was longer than that of adult dyads and elderly dyads [11]. Zhao et al. found no difference of the walking path between individuals and social groups in low densities from an observation in a subway station in Beijing. However, under high density situations dyads trended to walk in a more straight way compared to individual [9].
and subway stations and so on. In these locations, pedestrians come from different directions and go to different destinations. To investigate the difference between social groups and individuals, we carried out experiments to study the difference between social groups and individuals under multidirectional flow.
2. Experiment Setup
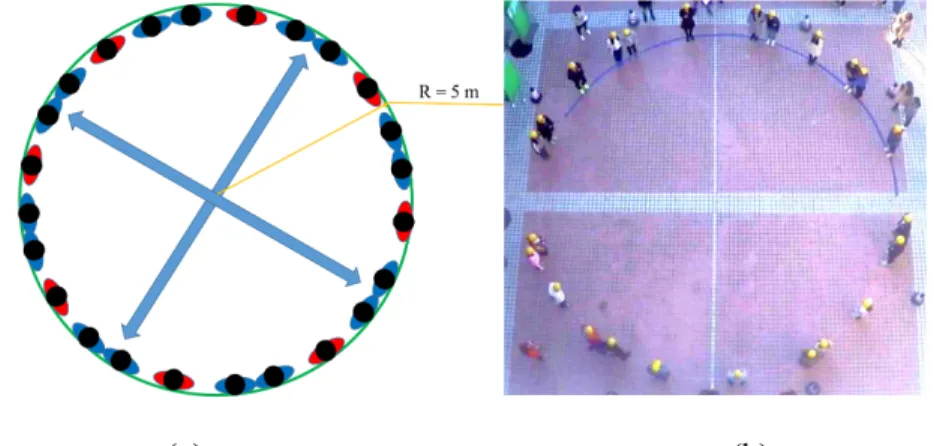
The experiment was carried out in November 2017 in the University of Science and Technology of China, Anhui, China. The experiment scenario is a circle with the radius of 5m which is used to form multidirectional flows [11] . Fig. 1 shows the sketch of the experiment scenario and a snapshot of the experiment (the red pedestrians represent the individuals and the blue pedestrians represent the social groups). In this paper, we only consider pairs as social group since the proportion of pair is larger than 50% of crowd in most case [1-4]. In this paper, a special relationship that is the strong paired relationship between pairs was adopted. For each pair, they were asked to keep in physical touch (arm in arm) with each other in the experiment. At the beginning of the experiment, participants stood on the border of the circle (cross standing between social groups and individuals in theory) and individuals separated different groups uniformly. The destination of each pedestrian is the opposite circle arc through the centre of the circle. Pedestrians were asked to reach their destination as quickly as possible in each run with the same instruction. During the movement, they can freely choose their preferred manner to avoid collision with other participants to arrive at their destinations. In total, 72 participants took part in the experiment. They are all undergraduate students from University of Science and Technology of China and 18-24 years old. Six runs were performed with different numbers of participants. In each run, the numbers of social groups and individuals are the same (except scenario 01 where the number of individual is one more than that of social groups). The ratio of boys to girls is close to one and thus we ignored the impact of gender and age on the results. The details of the experiment are shown in Table 1.
(a) (b)
Fig. 1: (a) The schematic illustration of the scenario and (b) a snapshot of the experiment.
Table 1. The details of the experiment.
Scenario Pedestrians number Number of social groups Number of individuals
01 13 4 5
02 24 8 8
03 36 12 12
04 48 16 16
05 60 20 20
06 72 24 24
[12]. Finally, the trajectories of the whole experiment were corrected manually. The frame rate of the trajectories data corresponds to 25 fps.
3. Trajectories
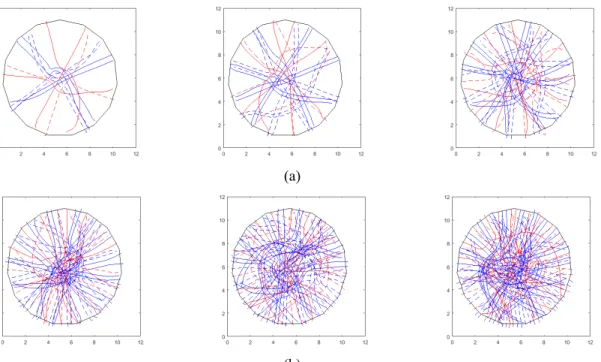
Based on high precision tracking of PeTrack, the characteristics of pedestrians including trajectories, velocity and density can be determined. Due to the head swing of the pedestrian, the trajectories display the periodic change and cannot show the real position of the body. We smooth the trajectories according to the step frequency which is about 2 Hz. We use 1 s as the smoothing window and calculate the average value as the x and y coordinate. Results show that it can eliminate the effect of head swing well. We draw the trajectories of pedestrians for run 1 to run 6 in Fig 2. The red lines represent the individuals and the blue lines represent the trajectories of social groups.
(a)
(b)
Fig. 2. The trajectories of (a) scenario 01 to 03 (b) scenario 04 to 06.
From the figures, we can see that social group move together and they keep a relative small interpersonal distance. In low density, the walk path is more orderliness and few detour phenomenon appears. Pedestrians can get through the central area straight. However, with the increase of participants, the trajectories of pedestrians becomes complicated gradually. The trajectories in central area (area 2 which will be explained below) is seriously crossed and obvious detour behaviour appears in the experiment. Serious congestion occurred in the central area and pedestrian are stuck in the area and cannot move quickly. In order to reach the target quickly, some pedestrians made a detour.
4. Data Analysis Method
The instantaneous velocity 𝑣𝑣�𝚤𝚤(𝑡𝑡)is defined as below:
𝑣𝑣�𝚤𝚤(𝑡𝑡) =
��𝑥𝑥𝑖𝑖�𝑡𝑡+ ∆𝑡𝑡′� �− 𝑥𝑥2 𝑖𝑖�𝑡𝑡− ∆𝑡𝑡′� ��2 2+�𝑦𝑦𝑖𝑖�𝑡𝑡+ ∆𝑡𝑡′� �− 𝑦𝑦2 𝑖𝑖�𝑡𝑡− ∆𝑡𝑡′� ��2 2
∆𝑡𝑡′ (1)
where 𝑥𝑥𝑖𝑖(𝑡𝑡) and 𝑦𝑦𝑖𝑖(𝑡𝑡) are the x and y coordinates of pedestrian i at time t and ∆𝑡𝑡′= 0.4 𝑠𝑠 is used in this paper.
The average velocity v(𝑡𝑡) is calculated by equation (2):
v(𝑡𝑡) = ∑ ‖𝑣𝑣𝑖𝑖 �𝚤𝚤(𝑡𝑡)‖
The global density ρ is calculated by equation (3):
ρ=𝑁𝑁𝐴𝐴 (3) where N is pedestrian number in measurement area, A = 28.26 m2 is the size of the measurement area.
The walk path is calculate by equation (4):
S = ∑𝑡𝑡𝑖𝑖=𝑡𝑡𝐷𝐷 𝑂𝑂�(𝑥𝑥𝑡𝑡=𝑖𝑖+1− 𝑥𝑥𝑡𝑡=𝑖𝑖)2+ (𝑦𝑦𝑡𝑡=𝑖𝑖+1− 𝑦𝑦𝑡𝑡=𝑖𝑖)2 (4)
where 𝑡𝑡𝑂𝑂 and 𝑡𝑡𝐷𝐷 is the origin and destination time of pedestrian, 𝑥𝑥𝑡𝑡=𝑖𝑖 and 𝑦𝑦𝑡𝑡=𝑖𝑖 are the x and y
coordinate of pedestrian at time i, 𝑥𝑥𝑡𝑡=𝑖𝑖+1 and 𝑦𝑦𝑡𝑡=𝑖𝑖+1 are the x, y coordinate of pedestrian at time i+1.
5. Results and Discussion
5.1. The average speed of pedestrians
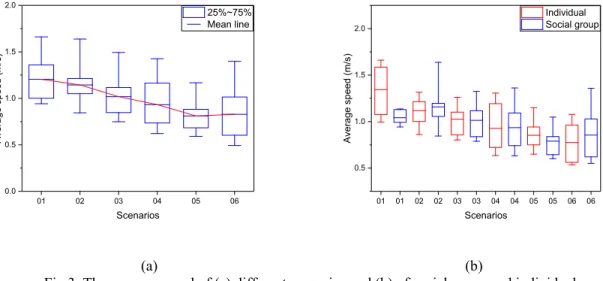
To investigate pedestrian speed in different scenarios, we calculate average speed of each pedestrian by equation 1 and 2 and results are shown in figure 3.
01 02 03 04 05 06
0.0 0.5 1.0 1.5 2.0
Scenarios
Av
er
age s
peed (m/
s)
25%~75% Mean line
01 01 02 02 03 03 04 04 05 05 06 06 0.5
1.0 1.5 2.0
Scenarios
Av
er
age s
peed (m/
s)
Individual Social group
(a) (b)
Fig 3. The average speed of (a) different scenarios and (b) of social group and individual.
As shown in Figure 3(a), with the increasing number of pedestrians in the experiment, the average speed decreases. Since the probability of collision between pedestrians increases with the increasing density in the central area, most of pedestrians have to decrease the walking speed to avoid the conflict with others.
The average speeds of individuals and social groups in different runs are shown in Fig 3. The speed of individual is not always higher than that of social groups. This is contrary to the findings of [7, 8] who found that individuals are more flexible than social groups and the latter have a negative influence on the speed of crowds. The influence of social group on pedestrian speed should be deeply investigated.
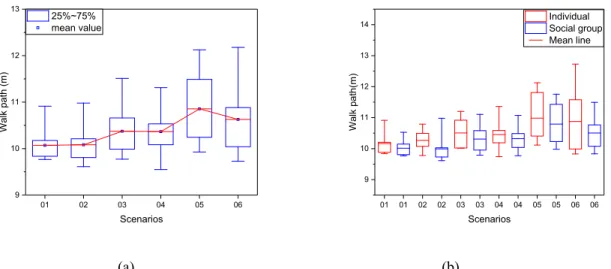
5.2. The walk path of pedestrians
01 02 03 04 05 06 9
10 11 12 13
Scenarios
W
al
k pat
h (m)
25%~75% mean value
01 01 02 02 03 03 04 04 05 05 06 06 9
10 11 12 13 14
Scenarios
W
al
k pat
h(m)
Individual Social group Mean line
(a) (b)
Fig 4. The walk path (a) in different scenarios and (b) of social group and individual.
5.3. Strategies of pedestrians
By analyzing the factors influencing the speed and movement time further, we find that pedestrians adopt different strategies in the process of multi-directional movement. To avoid collisions with others, pedestrians mainly adopt three different strategies in the video recordings: a) decelerating the speed, b) waiting in situ and letting others go first, c) making a detour. We use pedestrian speed and DC value to classify these strategies into six strategies: 1) Straight - Movement in Steady speed (S-MS), 2) Straight -Movement with Deceleration (S-MD), 3) Straight - Movement with Waiting (S-MW), 4) Curve - Movement in Steady speed (C-MS), 5) Curve - Movement with Deceleration (C-MD), 6) Curve - Movement with Waiting (C-MW).
We define a Detour Coefficient (DC) value to represent the detour probability of pedestrians during the movement. The DC value is defined as:
DC =�∑𝑡𝑡=𝑡𝑡𝑂𝑂𝑡𝑡𝐷𝐷�(𝑥𝑥�(𝑥𝑥𝑡𝑡+1−𝑥𝑥𝑡𝑡)2+(𝑦𝑦𝑡𝑡+1−𝑦𝑦𝑡𝑡)2
𝐷𝐷−𝑥𝑥𝑂𝑂)2+(𝑦𝑦𝐷𝐷−𝑦𝑦𝑂𝑂)2 −1�× 100% (9)
where 𝑥𝑥𝑡𝑡 and 𝑦𝑦𝑡𝑡 are x and y coordinates of pedestrians at time t, 𝑥𝑥𝑡𝑡+1 and 𝑦𝑦𝑡𝑡+1 are x and y coordinate of pedestrians at time t+1, 𝑥𝑥𝑂𝑂 and 𝑦𝑦𝑂𝑂 are x and y coordinates of pedestrians at origin position, 𝑥𝑥𝐷𝐷 and 𝑦𝑦𝐷𝐷 are x and y coordinates of pedestrians at destination positions.
During the experiment, the scenario can be approximately divided into two areas where pedestrians show different movement states: 1) the free movement state area: pedestrians move freely and less influenced by others in this area. This area contains two processes, a) at the beginning of the experiment, the self-accelerating process of the pedestrian from standstill to movement, b) at the end of the experiment, the self-deceleration process of the pedestrian from movement to standstill. 2) Congested movement area: congestion occurs in this area due to the accumulation of pedestrians and their speeds are influenced by each other. To facilitate the calculation, we divide the experiment scenario into two parts. Area 1 is a circle with the radius of 3m and locates at the center of the experimental site. Moreover, area 1 is the rest of experimental site. From data analysis, we find that there is no difference in speed and movement time between pedestrians in area 1. Here we focus on the movement of pedestrian in area 2.
is consistent with the shortest path principle in our normal life that most of people prefer to move straight. After manual verification, the 5% DC value is used as a standard to divide pedestrians into straight movement and curve movement, the accuracy of the detour criterion is as high as 90%.
Secondly, we divide the pedestrians into three classes according to the speed variation ratio. 1) Movement in Steady speed (MS): the speed variation ratio is less than 25%. 2) Movement with Deceleration (MD): the speed variation ratio is larger than 25%. The minimal speed is larger than 0.3 m/s. 3) Movement with Waiting (MW): the speed variation ratio is larger than 25%. The minimal speed is smaller than 0.3 m/s. In this paper, we think the pedestrian is waiting for others when the speed is less than 0.3 m/s.
The classify basis and proportion of different strategies are shown in table 2.
Table 2: The classify basis and proportion of different strategies.
Strategies DC value Speed variation ratio
(𝑣𝑣𝑚𝑚𝑚𝑚𝑥𝑥− 𝑣𝑣𝑚𝑚𝑖𝑖𝑚𝑚) 𝑣𝑣𝑚𝑚𝑚𝑚𝑥𝑥
𝑣𝑣𝑚𝑚𝑖𝑖𝑚𝑚(m/s) Proportion
Straight – Movement in Steady speed
(S-MS)
< 5% < 25% > 0.3 2.4%
Straight – Movement with Deceleration
(S-MD)
< 5% > 25% > 0.3 18.1%
Straight – Movement with Waiting
(S-MW)
< 5% > 25% < 0.3 34.9%
Curve - Movement in Steady speed
(C-MS)
> 5% < 25% > 0.3 1.8%
Curve - Movement with Deceleration
(C-MD)
> 5% > 25% > 0.3 22.9%
Curve - Movement with Waiting
(C-MW)
> 5% > 25% < 0.3 19.9%
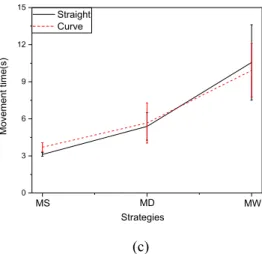
We plot average speed, density and movement time of different strategies in figure 6.
0.0 0.5 1.0 1.5 2.0 2.5
MW MD
Speed(m/
s)
Strategies
Straight Curve
MS 0
1 2 3 4
MW MD
D
ens
ity
(ped/
m
2)
Strategies Straight
Curve
MS
0 3 6 9 12 15
MW MD
M
ov
em
en
t ti
m
e(s
)
Strategies Straight
Curve
MS
(c)
Fig. 6: (a) the average speed (b) average density and(c) movement time of different strategies.
As can be seen from Fig 6, in six strategies, the MS strategy leads to a higher speed, lower density than and the shortest movement time during the movement. However, this strategy is only observed when the number of participants is small. When the number of pedestrian increases, there is no enough space for them to get through the congested areas in high speed and thus the MS strategy does not work anymore. Due to the change of directions in movement along curve, pedestrian speed of C-MS strategy is smaller than that of S-MS. Owing to the increase of the movement path, the movement time is slightly larger than that of S-MS. However, the density of pedestrians who select the straight movement strategy is larger than that of curve movement strategy. The detour strategy keeps pedestrians away from crowded areas, which results in a lower density and a lower probability of collision with other pedestrians. There is little difference in speed and movement time between S-MD strategy and C-MD strategy. However, the density under C-MD strategy is obviously lower than that under S-MD strategy. It shows that detour strategy is beneficial to keep a certain distance with other pedestrians and to avoid overcrowding between pedestrians. Compared with S-MW strategy, under C-MW strategy pedestrian has higher speed, lower density and shorter movement time. Therefore, curve strategy (detour) is beneficial to improve the movement efficiency in our experiment.
5. Conclusion
We conducted a series of experiments with different number of pedestrians to investigate the difference between individuals and social groups in multidirectional crowd movement. We analyse the trajectories, speed and movement time of pedestrians. The results indicate that the speed difference between individual and social group changes based on different conditions. The length of pedestrian walk path increases with the pedestrian density. Moreover, the walk path of social group is shorter than that of individual. Social group do have influence on pedestrian dynamics. We find different strategies for pedestrians to reach their destinations and the speed, density and movement time for different strategies are different. The experiment shows that detour is beneficial in multidirectional movement.
Acknowledgements
The authors acknowledge the foundation support from the National Natural Science Foundation of China (Grant No. 71704168), from Anhui Provincial Natural Science Foundation (Grant No. 1808085MG217) and the Fundamental Research Funds for the Central Universities (Grant No. WK2320000040).