Applied Magnetic Forces Enhance Nanoparticle Based Gene Delivery and Characterize Intracellular Rheology and Transport
Kris Iniko Ford
A dissertation submitted to the faculty of the University of North Carolina at Chapel Hill in partial fulfillment of the requirements for the degree of Doctor of Philosophy in the Department of Biomedical Engineering.
Chapel Hill 2013
Approved by:
Abstract
KRIS I. FORD: Applied Magnetic Forces Enhance Nanoparticle Based Gene Delivery and Characterize Intracellular Rheology and Transport
(Under the direction of Richard Superfine)
iii
Acknowledgements
I have truly enjoyed my years in graduate school and the time I have spent in NSRG/CISMM. Everyone I have worked with has been a pleasure to work with and know every day, and I could not have asked for a better group of individuals to be surrounded by. I have progressed personally and professionally in my time here, and a great portion of that growth is due to being around so many people that are striving to achieve excellence in their work and being inspired by their words and efforts. I cannot suitably put into words the tremendous impact this group has had on me, but I will take the lessons and the people with me everywhere I go from this point forward.
I would like to thank the committee members for their wisdom and guidance during my graduate school career. Rich, thank you for providing me an opportunity to work in NSRG during my time at UNC. You provided a wealth of scientific knowledge and expertise to me, but perhaps more importantly, you taught me how to ask the right questions and how to think about problems. Thank you for your leadership, counsel, and support that allowed me to get to this point. Tim, thanks for your all of the biology conversations that we’ve had over the years. Your insight has helped me to better
was something that I was very interested in at the beginning of my time here and the opportunity to learn about it first hand was truly incredible. Dr. Gomez, thank you for your time and insight, and for helping me to get organized in the process of fulfilling my requirements. Dr. Favorov, thank you for your time and contributions to my dissertation and defense, and for the support you have given me as a teacher and BME adviser.
I would like to thank the funding agencies who have helped to support me during my time at UNC, making my studies here possible. I would like to thank the National Institutes of Health for funding my research project. I would like to thank the UNC Board of Governors for providing funding during my first year. Additionally I would like to thank the Carolina Center of Cancer Nanotechnology excellence for funding several years of my research. I would also like to thank the Initiative for Maximizing Student Diversity at UNC Chapel Hill for several years of support during my graduate career.
All of the members of NSRG have contributed to my success as a graduate student. To Lamar Mair, I enjoyed working together on the projects we shared and I enjoyed our conversations and having you as a friend. To Jeremy Cribb, thanks for all of the work you put into the MATLAB programs that make so much of everyone’s work
v
being a friend and bringing the pastries to the defense. To Lauren, thanks for all of the help with experiments, which made possible the completion of the dissertation and the paper. It has been really good working with you and congratulations on your own graduation. Thanks also go out to Robert Judith, Suzy Lynch, Kellie Pickler, Ben Evans, Jay Fisher, Adam Shields, Vinay Swaminathan, Briana Fiser, Ashley Estes, Cory Quammen, Joe Ping-Lin Hsiao, and David Marshburn.
Thanks also go to Leandra Vicci, for all of the electronics and magnetics wisdom you have shared with me. Thanks go to Mike Falvo, who has always offered support and counsel on research and graduate school. Thanks go to Sean Washburn who sets the bar high for our scientific rigor, and won’t let us settle for anything less. Thanks go to Russ Taylor who always makes us ask difficult questions in our research and for the wide range of computer science assistance. Thanks to everyone at the Chapel Hill Analytical and Nanofabrication Laboratory (CHANL), especially Carrie Donley and Wallace Ambrose for their microscopy assistance. Special thanks go to Mike Fisher, who trained me in tissue culture and cell transfection, which became key tools in my graduate school career. Thank you for your wisdom, time, and friendship through the years.
I would like to thank my family for all of the support and love they have given me for my entire life. Nothing I do would be possible without you. Thanks to my Mom and Dad for all of the guidance they have given me throughout the years. This work is dedicated to you and I hope to take what I have learned and make the most on all that you have invested in me. Thank you to my sister, Keisha, who has also supported me throught the years. I love you, I truly appreciate it, and hope I can be a support for you also in your future endeavors. Thanks to my brother-in-law Joel, for the encouragement since I have been in graduate school. Finally, I would like to thank my wife Vidya, who has been there for the majority of my time in graduate school. I love you very much and I wouldn’t be where I am without your love and support. Graduate school has been a
vii
Table of Contents
List of Figures ... xii
Chapter 1 Introduction ... 1
1.1 Thesis Statement and Contributions ... 1
1.2 Outline ... 2
Chapter 2 Paramagnetic Nanoparticle Transfection ... 4
2.1 Overview ... 4
2.2 Vector Selection ... 7
2.2.1 Particle Functionalization ... 9
2.2.2 DNA Binding Verification ... 9
2.2.3 DNA Binding Quantification ... 11
2.2.4 Polyethylenimine Properties ... 13
2.3 Size Dependent Nanoparticle Transfection ... 14
2.3.1 Permanent Magnet Array ... 15
2.3.2 Nanoparticle/Lipofectamine Dosage ... 16
2.3.3 The Sub-200nm Particles are Most Effective for Oligo Delivery ... 17
2.4 130nm Nanoparticle Dosage Response ... 19
2.4.1 Transfection ... 20
2.4.2 BCA Results ... 22
2.4.3 A 50-100nM Dosage Yields Optimal Results with Minimal Toxicity ... 23
2.5 Transfection with Size-Uniform 200nm Fe Post Particles ... 24
2.5.1 Transfection ... 24
2.5.2 Our Size-Uniform Nanoparticle Effectively Delivery the Antisense Oligos ... 25
Chapter 3 Development of an Oscillating Magnetic Field Transfection Device ... 28
3.1 Overview ... 28
3.2 Oscillating Magnetic Force Transfection Device ... 30
3.2.1 Cell Culture Holder ... 31
3.2.3 Force Calibration ... 34
3.2.4 Rotating Magnetic Array ... 38
3.2.5 Frequency Calibration ... 39
3.2.6 Force Determination ... 41
Chapter 4 Transfection is Enhanced with Oscillating Magnetic Fields ... 48
4.1 Overview ... 48
4.2 Published Oscillating Field Transfections have not Revealed Mechanisms Responsible for Enhancing Effects... 49
4.3 Protocol to Effectively Study Oscillating Force Effects... 50
4.4 Frequency Response Experiments ... 53
4.5 Oscillating Field Transfections ... 55
4.5.1 Magnetic Field Application ... 55
4.5.2 2Hz Oscillation Produces an Increase in Relative Fluorescence Intensity of Transfected Cells ... 57
4.5.3 Frequency Response Transfection ... 58
4.5.4 Oscillating Field Enhancement is Frequency Dependent, and Peaks at 10Hz ... 60
Chapter 5 Oscillating Magnetic Field Transfection Enhances Specific Endocytic Pathways ... 62
5.1 Overview ... 62
5.2 Endocytosis Pathways ... 63
5.2.1 Clathrin Mediated Endocytosis ... 64
5.2.2 Caveolae Mediated Endocytosis ... 64
5.2.3 Macropinocytosis ... 65
5.2.4 Non-Caveolae/Clathrin Mediated Endocytosis ... 65
5.3 Experiment ... 66
5.4 Actin Inhibition of Transfection ... 66
5.4.1 Latrunculin B Dose Determination... 67
5.4.2 Determination of Lat B Incubation Time ... 69
5.4.3 Expression is Restored Unless Lat B Remains in Culture Several Hours after Transfection ... 70
ix
5.4.5 Actin Inhibition Results ... 74
5.5 Endocytic Pathway Inhibition ... 77
5.5.1 No Inhibitors were Toxic in any Samples ... 78
5.5.2 Endocytic Inhibition Results ... 79
5.5.3 Macropinocytosis is Up-Regulated by Oscillating Forces, and does not Contribute to Transfection Efficiency Without Them ... 82
5.5.4 Caveolae/Lipid raft Pathways Increase in Efficiency due Oscillating Forces ... 82
5.5.5 Clathrin-Mediated Endocytosis is not Affected by Oscillating Forces ... 83
5.5.6 Oscillating Force Enhancement is not seen without Dynamin ... 83
5.5.7 “No Field” and Lipofectamine Controls ... 84
5.5.8 Possible Mechanisms of Force Sensitivity: Flexing of Membrane Ruffles ... 85
5.5.9 Possible Mechanisms of Force Sensitivity: Increased and Faster Binding with Trans-membrane Proteins ... 90
5.5.10 Possible Mechanisms of Force Sensitivity: Improved Transport Through the Glycocalyx ... 92
5.5.11 Advantages to stimulating macropinocytosis and caveolae/lipid raft pathways ... 94
5.6 Conclusion ... 96
Chapter 6 In vivo Molecular Motor Transport and Force Response ... 98
6.1 Introduction ... 98
6.2 Intracellular Constituents ... 103
6.2.1 Actin ... 103
6.2.2 Microtubules ... 104
6.2.3 Intermediate Filaments ... 104
6.2.4 Organelles ... 105
6.3 Process of Microbead Internalization and Intracellular Fate ... 106
6.4 Molecular Motor Transport Experiments ... 108
6.4.1 1m Microsphere Functionalization to Achieve Internalization ... 108
6.4.2 Microbeads are Tracked and Mean-Squared Displacement Can Show Driven vs. Passive Transport ... 111
6.4.3 3-D Isosurfaces Can Show the Position of the Microbead and Verify Internalization ... 113
6.4.4 Active Microbead Transport is Temperature Dependent ... 114
6.5 in vivo Motor Stalling Results in Different Microbead Displacement Phenomena ... 124
6.5.1 Case 1: The Motor Stall ... 127
6.5.2 Case 2: The Viscoelastic Response ... 128
6.5.3 Case 3: Direction Reversal ... 130
6.5.4 Case 4: Assisting Transport ... 131
6.5.5 Case 5: Breaking Through ... 133
6.5.6 Case 6: Translation ... 134
6.6 A Maximum of 6 Dynein Motors act on a Single Microbead ... 136
6.7 Conclusion ... 140
Chapter 7 Probing Intracellular Mechanics with 1mm Paramagnetic Microspheres ... 142
7.1 Overview ... 142
7.2 Mechanical Models ... 143
7.2.1 Springs ... 144
7.2.2 Dashpots ... 145
7.2.3 Kelvin-Voight Model ... 146
7.3 Intracellular Rheology Measurements ... 146
7.4 Cytoplasm Rheology ... 147
7.5 Cytoskeletal Disruption ... 150
7.6 Probing of the Cortical Actin of the Inner Cell Membrane ... 153
7.7 Conclusion ... 155
Chapter 8 Appendix ... 156
8.1 Appendix One: Instrumentation ... 156
8.1.1 3-Dimensional Force Microscope ... 156
8.1.2 Nikon Eclipse TE 2000-E ... 160
8.1.3 Environmental Microscope... 161
8.1.4 Motorized 3DFM Stage ... 161
8.2 Appendix Two: Cell Lines ... 169
8.2.1 HeLa Wild Type, Luc-705 and EGFP-654 ... 169
8.2.2 HeLa GFP-Actin and RFP Tubulin ... 170
8.3 Appendix Three: Chapter 2 ... 173
8.3.1 Polyethylenimine/Nanoparticle Functionalization ... 173
8.3.2 Cell Plating ... 174
xi
8.3.4 Luciferase Assay ... 175
8.3.5 BCA Protein Assay ... 176
8.3.6 Transfection Reagent Preparation ... 176
8.3.7 Dose Response Reagent Preparation ... 177
8.3.8 Imaging/Segmentation ... 178
8.3.9 Size Uniform 200nm Fe Post Particles ... 178
8.4 Appendix Four: Chapter 4 ... 179
8.4.1 Cell Plating ... 179
8.4.2 Transfection Reagent Preparation ... 180
8.4.3 Cell Imaging and Counting Assay ... 180
8.4.4 Oscillating Field Effects are not Due to Vibration of the Sample ... 185
8.5 Appendix Five: Chapter 5 ... 186
8.5.1 Cell Plating ... 186
8.5.2 Transfection Reagent Preparation ... 187
8.5.3 Endocytic Pathway Inhibition ... 188
8.5.4 Cell Staining and Imaging ... 188
8.5.5 Imaging and Cell Counting ... 189
8.6 Appendix Six: Chapter 6 ... 190
8.6.1 Cell Culture and Plating ... 190
8.6.2 1m Bead Dosing and Imaging ... 190
List of Figures
2.1 Sample micrographs of the particles ...8
2.2 Schematic of a 12-well cell culture plate and 12-magnet array ...10
2.3 Luciferase expression from size dependent nanoparticle transfection ...13
2.4 Schematic of a 12-well cell culture plate and 4 magnets per well array ...16
2.5 Dose response of 130nm particles ...17
2.6 Images and data from size-uniform 200nm particle transfection ...21
2.7 Verification of DNA Binding ...23
2.8 Oligo binding per nanoparticle ...26
3.1 Drawings of plate holder ...31
3.2 1” Disk magnet calibration ...33
3.3 0.25” Disk magnet calibration ...36
3.4 Force vs. distance of single 0.25"magnet ...37
3.5 Rotating magnet array ...39
3.6 Frequency vs. voltage ...40
3.7 Frequency vs. voltage 2 ...41
3.8 Rectangular magnet field calibration ...41
3.9 Vertical magnetic field and gradient vs. angle...43
3.10 Vertical force vs. time ...44
3.11 Horizontal magnetic field and gradient vs. angle ...45
3.12 Horizontal force vs. time...46
4.1 Typical oscillating field transfection protocol ...51
xiii
4.3 Calibration of 1” disk magnet ...54
4.4 Initial oscillating field transfection results ...57
4.5 Transfection in 96 well plate ...59
4.6 Frequency response data ...60
5.1 Illustration of endocytosis pathways ...63
5.2 Bright field images of Lat B treated cells ...68
5.3 Lat B transfection results 1 ...69
5.4 Lat B transfection results 2 ...71
5.5 Lat B transfection schematic ...73
5.6 Oscillating field Lat B transfection results ...74
5.7 Schematic for pathway inhibition studies ...77
5.8 Cell viability...79
5.9 Pathway inhibition controls ...80
5.10 Pathway inhibition relative transfection efficiency ...81
5.11 Pathway inhibition transfection efficiency ...81
5.12 Buckling force of actin filaments ...87
5.13 Schematic of possible macropinocytosis enhancement ...89
5.14 Schematic of possible caveolae enhancement ...91
5.15 Theoretical velocity vs. force plots ...93
6.1 Process of 1m microbead cellular uptake ...107
6.2 Microbead SEM images ...109
6.3 Fluorescently labeled microbead images ...110
6.5 Images and Isosurfaces of fluorescent beads in cells ...114
6.6 Temperature dependence of transport on a single microbead ...116
6.7 Active transport temperature dependence ...117
6.8 Probability distribution functions for 1-D diffusion ...123
6.9 Probability distribution for 1-D diffusion ...124
6.10 Typical 3DFM experiment ...125
6.11 Motor stall example ...127
6.12 Viscoelastic example ...129
6.13 Direction reversal example ...131
6.14 Assisted transport example ...132
6.15 Break through example ...133
6.16 Translation example ...135
6.17 3DFM force calibration...136
6.18 Displacement and velocity vs. force ...137
6.19 Max motor stall force ...138
7.1 Schematic diagram of a spring ...144
7.2 Schematic diagram of a dashpot ...145
7.3 Schematic drawing the Kelvin-Voight model...146
7.4 Image of 3DFM cytoplasm rheology measurement...148
7.5 The elastic moduli and viscosity of 6 cells ...149
7.6 The elastic moduli and viscosity of single cell ...150
7.7 Images from cytoskeletal disruption ...151
xv
7.9 Probing of cortical actin from the interior of the cell ...154
8.1 3DFM lid and stage ...157
8.2 3DFM voltage signal and calibration curve ...160
8.3 Schematic drawings of the 3DFM lid adapter ...164
8.4 Stage adapter for the Olympus IX81 ...165
8.5 Assembly of the motorized 3DFM ...166
8.6 Assembled motorized stage ...166
8.7 Installation of the motorized 3DFM ...168
8.8 Images to verify efficacy of fluorescent actin and tubulin transfection ...172
8.9 Micrograph of size uniform 200nm particles...179
8.10 Image of Syto 82 stained cells ...181
8.11 ImageJ screenshot of cell counting process ...182
8.12 ImageJ screenshot of cell counting process 2 ...183
8.13 Images of EGFP expressing in the cell counting pipeline ...184
Chapter 1 Introduction
Cell transfection involves the introduction of exogenous genes into a cell of interest for the purpose of affecting some aspect of the cell’s gene expression. Introduction of exogenous genes is done to up-regulate the expression of a gene, knockdown expression of a gene, or correct a pre-existing genetic error. The use of magnetic nanoparticles offers the possibility of targeted localized delivery to cells and tissues. To fulfill the promise of this technology, the aspects of transport and delivery must be fully understood to be optimized for clinical applications.
1.1 Thesis Statement and Contributions
2
magnetic fields have been shown to enhance transfection efficiency of paramagnetic nanoparticles, and I present a protocol to better study the phenomenon. I demonstrate frequency dependence and show for the first time that oscillating forces enhance transfection by stimulating certain endocytic pathways.
The second area of focus examines the active transport of a nanoparticle once it is in the intracellular environment. I present a method for introducing 1m microbeads to the interior of cells. I characterize transport of microbeads by kinesin and dynein molecular motors and its temperature dependence. I present for the first time characteristic responses that occur when attempting to stall molecular motors in vivo. I also show for the first time the maximal force exerted by dynein motors on microbeads as it is transported towards the nucleus, a primary target for gene delivery. I will also present data on the rheology of the cell interior, which help to describe the environment that surround the nanoparticle after internalization.
1.2 Outline
This work is outlined as follows:
Chapter 3 details the development of a device to apply oscillating magnetic fields to nanoparticles in cell cultures. This device is designed to apply oscillating fields of varying frequencies to enhance the transfection of paramagnetic nanoparticles.
Chapter 4 presents the protocol to effectively study oscillating field effects on nanoparticle transfection. The frequency dependence on transfection efficiency is established.
Chapter 5 discusses the enhancement of transfection with oscillating forces through specific endocytic pathways. I show for the first time that certain pathways are sensitive to force stimulation and propose mechanisms to explain how the enhancement is achieved.
Chapter 6 presents the data on the active transport of microbeads after they have been internalized into cells. I characterize the displacements and velocities of microbeads transported via molecular motors. I demonstrate for the first time transport phenomena that can occur when externally applied forces are applied to transported microbeads in vivo. I also characterize the maximum forces applied to a microbead by dynein motors in vivo, which are responsible for transporting cargoes to the nucleus.
Chapter 2
Paramagnetic Nanoparticle Transfection
2.1 Overview
Nanoparticles can be used in biomedical research as vectors for gene delivery and as probes of intracellular rheology. Nanoparticles can be fabricated in a variety of materials, sizes, and a multiplicity of functionalizations. The proper selection of vector is a key step in any experiment, as the wrong vector can produce unfavorable or misleading results. The nanoparticle must be must be designed for the particular biomedical application in order to be successful for the chosen purpose. For gaining entry into the cell, size is a key feature in achieving entry into the cell. For gene delivery, the ability to conjugate polymers and nucleic acids is the significant feature of concern. Proper attention to these details is the beginning steps to successful non-viral vector delivery.
Paramagnetic nanoparticles offer the potential to exert control over non-viral vectors by applying a magnetic field and field gradient to the particle, focusing particles for transfection to a site of interest. Magnetofection, as it has been termed, was introduced in the early 2000’s as a means to transfect a variety of cells types and show
6
theory a sufficient magnetic force can achieve this localization. So then it becomes possible to optimize delivery of the vectors to the desired cells, while minimizing the amount of vector that is lost to untargeted sites. Moreover, in the case of a deleterious drug or gene, the reagent can be localized at the site of interest, reducing unintended side effects to other cells. For example, chemotherapy to treat cancer is delivered systemically to patients, and the compounds, which target rapidly reproducing cells, target cancer cells (the intended target) as well as cells of the bone marrow, digestive tract, and hair follicles (the healthy, unintended targets). These effects produce a number of harmful side effects to the patient making the treatment often extremely difficult to undergo. Potentially, such effects could be localized to the site of the tumor, leaving healthy cells unharmed, and increasing the effectiveness in treating the tumor.
this way. Any particle that is intended to act as a non-viral gene vector must be able to, at some point, escape this digestive pathway in order to effectively deliver the gene payload. If it does not, the genes to be delivered will be subject to lysosomal degradation and unable to effect the expression they are meant to produce or modify.
2.2 Vector Selection
In order to transfect cells non-virally, an appropriate vector must be chosen. At the beginning of the transfection project a wide variety of particles and sizes were considered as possible vectors. There are a number of companies that commercially produce nanoparticles. All particles are not created equal however, and there will be differences in uniformity, functionalization, and composition. Size-uniformity is ideal in particle fabrication, but difficult to achieve in particles less than 500nm. Although ideal, size-uniformity is not necessary to achieve transfection. Based on the fabrication process, nanoparticles will have differences in iron oxide percent composition, and as such will vary in magnetization. The ability for nanoparticles to bind moieties is also not the same among all varieties. For this reason a reasonably broad selection of particles is chosen to determine which types will be effective for transfection. Particles should generally be smaller than 1 micron in diameter in order to be effective for uptake into the cell. (Desai, Labhasetwar et al. 1997; Prabha, Zhou et al. 2002) Particles larger than this are generally be excluded for endocytosis, with the exception being phagocytic cells.
8
Brand Size Functionalization
Micromod Nanomag 20,50,100,130, 250nm COOH, (1 type of 250nm made with PEI)
Spherotech 200, 510nm COOH
Dynal Dynabeads 1m COOH
Kisker 50nm COOH
Chemicell PolyMag 100nm PEI
Table 2.1. Nanoparticle selection for initial transfection experiments
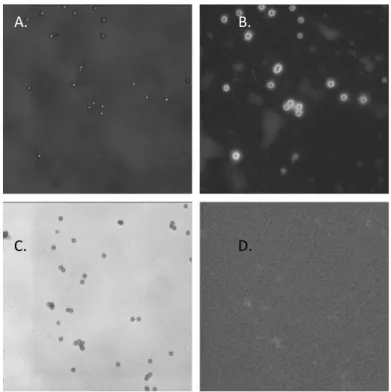
Figure 2.1 Sample micrographs of the particles used in transfection experiments. (Top Left) Dynal 1m Dynabeads. (Top Middle) Spherotech 510nm. (Top Right) Micromod 250nm COOH. (Bottom Left) Micromod 250nm PEI. (Bottom Middle) Micromod 130nm. (Bottom Right) Chemicell 100nm. At the 100nm level and smaller, clear images were difficult to acquire.
bind additional moieties to the surface. The sizes ranged from 20-1000nm in diameter and were carboxyl group functionalized on the surface. The carboxyl functionalization was chosen to enable a wide variety of secondary functionalizations, such as proteins or polymers, especially with its ability to form amine bonds.
2.2.1 Particle Functionalization
In order to be effective as a non-viral vector these particles need to be further surface functionalized with a moiety to bind DNA. Reviewing literature revealed 2 potential options for DNA binding, poly-lysine and polyethylenimine (PEI). Poly-lysine is a homopolymer consisting of the amino acid L-lysine. It has been shown to be effective as a transfection reagent and a valid option for functionalizing with a carboxyl group. PEI is also shown to be effective as a transfection reagent. (Boussif, Lezoualch et al. 1995) PEI also has the additional feature of helping a so-coated particle to escape the lysosomal degradative pathway. (Akinc, Thomas et al. 2005) PEI was chosen as the polymer of choice because of this feature. The nanoparticles were functionalized via an EDAC reaction as is described in the appendix in section 2.6.1.
2.2.2 DNA Binding Verification
10
Sytox Green Nucleic Acid Stain (InvitrogenTM, 5mM concentration in DMSO) at a 1/1000 concentration. These beads are then washed twice and re-suspended in 50 l of MES. Another sample of beads, without calf thymus DNA, also is mixed with Sytox Green, at similar volume and concentration. This sample is also washed twice and re-suspended in MES. The Sytox Green Nucleic Acid Stain is designed to adhere to nucleic acids and fluoresce. Beads with the DNA will fluoresce green and those without DNA will not. This is shown in Figure 2.2:
Figure 2.2 (A) Bright field image of 1m beads functionalized with PEI, DNA, and Sytox Green. (B) Fluorescent image of same field of view as (A) verifying attachment of DNA to the beads. (C) Bright field image of 1m beads mixed with DNA and Sytox Green. Without the PEI functionalization, no DNA is seen attached to the beads
The images on the left are bright field images taken at 100X magnification. On the right are fluorescent images taken of the exact same field of view as the bright field images. The sample of beads that were mixed with DNA show clear fluorescence localized at the beads from the nucleic acid stain. The beads without the DNA do not show any
D. C.
fluorescence from the stain. This experiment verified that my protocol of binding DNA to beads was effective.
2.2.3 DNA Binding Quantification
An important question to answer regarding the efficacy of a particle for oligo delivery is the capacity of the individual particle to bind the oligo effectively. A particle is meant to enter the cytoplasm of a cell and release some portion of its payload to the cytoplasm, making it available for gene correction in the cell. The bead must bind the molecules strongly enough to remain attached while suspended in fluid, such as blood or cell culture media. On the other hand, it must not bind to them so strongly so as to prevent their release into the cell. To determine the extent to which the PEI coated particles bind the oligos, I performed a series of experiments to empirically determine the average number of oligonucleotide molecules attached to the bead and the average number released over the duration of a typical experiment. Absorbance of DNA in the electromagnetic spectrum is at a maximum for the UV wavelength. This enables the use of UV-vis spectrophotometry for measurement of DNA concentrations experimental samples. The Beer-Lambert law states that the transmission of light through a substance is logarithmically dependent on the product of the absorption coefficient of the substance and the path length of the light through the substance. This can be shown in the below equation.
(2.1)
12
coefficient of the light can be expressed as the product of the extinction coefficient () of the absorbing molecules and their concentration (c) in solution.
(2.2)
Taking the log of the Beer-Lambert equation yields the quantity known as absorbance A.
(2.3)
Therefore if path length and extinction coefficient are known, the concentration of the absorbing molecule can be determined.
For our studies, the oligonucleotide is provided at 5250 g/mL or 210 OD/mL. A
sample is drawn from this stock and diluted to 50 M. Ten l of the 50 M is added to
990 l for a dilution factor 100. Theoretically this formulation should give an absorbance reading of 0.1155 on a UV spectrophotometer set to read at 260nm. From this same stock 10 l of DNA are added to 20 and 30 l of the magnetic particles that are at a mass
experiment. The original DNA formulation is measured at 260nm as a standard. The supernatant of the initial binding to the particles is measured and by subtraction with the standard formulation a determination is made of how much of the DNA has been bound to the particles. The 24 hour supernatant is measured and a determination is made of how much of the DNA is released after 24 hours. Results are shown in Figure 2.3.
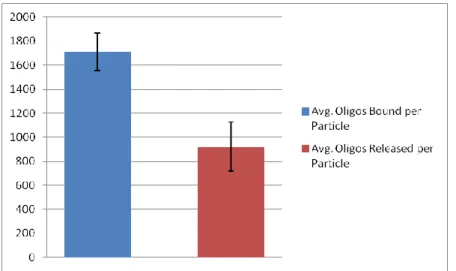
Figure 2.3 Plot of average oligos bound and released per 130nm nanoparticle
Data show that on average 1710±155 (mean±SE) molecules were bound to a single
130nm particle, and that over a 24 hour duration, 921±207 molecules were released per particle. This resulted in an average bioavailability of 52% of the oligos originally bound to the particle.
2.2.4 Polyethylenimine Properties
14
nucleic acids. PEI has been also found to be one of the compounds able to escape lysosomal degradation via the so-called “proton sponge effect”. (Akinc, Thomas et al. 2005) PEI is a highly branched polymer containing amine groups able to accept H+ ions. Because of this PEI possesses a high buffering capacity and acts as a buffering agent within the endosome. Proton pumps, which were once facing the extracellular space, are now pointed into the interior of the early endosome once the particle is fully enveloped into the endosome. The buffering capacity of the PEI, combined with the continued influx of H+ from the proton pumps, causes the endosome to osmotically swell, to the point of rupturing the membrane. This enables the particle and genes to escape what would be inevitable degradation. This capability also makes PEI useful reagent for delivery of genes. This is not to say that PEI is without issues. In spite of its promise, this PEI has been shown to induce cytotoxicity based on in-sample concentration and polymer structure. (Kafil and Omidi 2011) Modifications to polymer structure have been shown to improve cytotoxicity and improve delivery, (Kafil and Omidi 2011) so properly balanced, PEI can be an incredibly useful carrier.
2.3 Size Dependent Nanoparticle Transfection
2.3.1 Permanent Magnet Array
16
Figure 2.4 Schematic of a 12-well cell culture plate and 12-magnet array used in early transfection experiments. Modeled after commercially available kits, the magnets were approximately the same diameter as the cell culture wells.
2.3.2 Nanoparticle/Lipofectamine Dosage
stage in my attempts these variables were still being fine tuned. All transfections were performed in the presence of Opti-MEM media, as described in section 8.3.2.
The first cell plate was placed over the magnetic plate and both cell plates were placed in an incubator at 37°C. The plates were placed at different ends of the incubator on separate shelves to negate the influence of the magnets on the control samples. After 4 hours media was replaced with 1 ml of DMEM and allowed to incubate for another 20 hours. The total incubation time was 24 hours. The magnets were present for the duration of the 24 hour incubation period.
2.3.3 The Sub-200nm Particles are Most Effective for Oligo Delivery
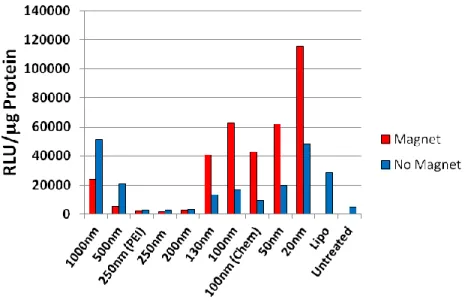
Transfection results are shown in Figure 2.5:
18
The 1m and 500nm particle samples produced higher transfection rates in the non magnetic controls (magnetic samples 24086 and 5238 respectively versus non-magnetic 51400 and 20711). The reason for this is the ability of the particles of this size to sediment over the 4 hours of the transfection. The second reason would be the geometry of the magnetic plate. The magnets are roughly the diameter of the cell culture well. As they are disk magnets the regions of highest field and gradient are near the circumference of the disk. Microspheres of this size have significantly more volume than their smaller counterparts (0.53 m3 for 1 micron particle vs. 0.00053 m3 for a 100nm particle, a
dosage and magnet geometry. However, in practical terms, as a model for potential in vivo application, the smaller sized particles are better suited as a vector choice.
2.4 130nm Nanoparticle Dosage Response
A dosage response is necessary to understand the optimal dose to achieve transfection. As dosage is increased it should be expected that the expression level of the target gene should also increase. There is a point at which optimal levels of expression are reached and beyond this point diminishing returns would be expected as the dosage is increased. Additionally, transfection reagents, as with any drug or compound, will become toxic in a cell culture and cells will begin to die from the exposure.
20 2.4.1 Transfection
Figure 2.6 Schematic of a 12-well cell culture plate and 4 magnet array
As in the previous magnetic array, the magnets are arranged in a strictly alternating polarity.
22 2.4.2 BCA Results
The results of the BCA test are shown in Table 2.2:
Table 2.2. BCA Results of Dose Response. Toxicity was observed above 125nM
2.4.3 A 50-100nM Dosage Yields Optimal Results with Minimal Toxicity
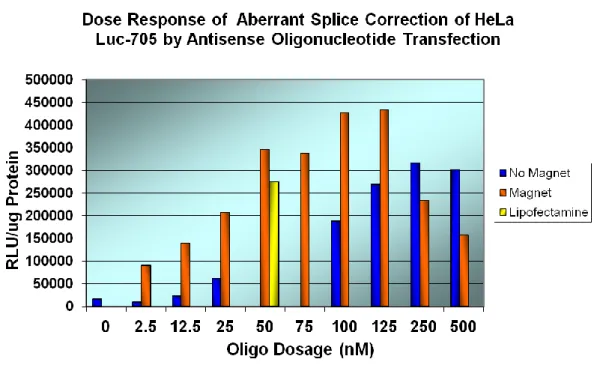
The results of the nanoparticle dose response are shown in Figure 2.7.
Figure 2.7 Dose response of 130nm particles. Best results were seen in the 50-100nM dosages
24
comparable Lipofectamine dosage (345516 versus 275121 RLU/g protein, a 26% improvement). For the 250 and 500 nM dosages, the no magnet controls exceeded the magnet samples. This is due to the high dosages of particles in those samples causing significant toxicity and reducing the overall transfection. The high dosage combined with the increased sedimentation by the magnets induces high levels of toxicity and is likely harsher on the cells than the non-magnetic sample. This study established the optimal dosage range for transfecting with 130nm particles. Prior experimentation was focused on establishing the capacity of various particle types to transfect the antisense oligos. This study informed for the first time the appropriate dosage to achieve expression and minimize toxicity.
2.5 Transfection with Size-Uniform 200nm Fe Post Particles
A novel type of size uniform Fe post particles was fabricated as described in section 2.6.10. This work represents the first instance in which metal evaporation onto post structures was used for the formation of released, shape-defined metal particles. This was the first use of lithographically defined particles as agents of magnetofection (Mair, Ford et al. 2009).
2.5.1 Transfection
diluted 1:5000 and conjugated with the antisense oligonucleotide. It was also added to the cell culture at 200 nM and allowed to incubate for 1 hour, at which time the media was replaced with fresh media. For magnetic nanoparticle transfections one sample was placed over the NdFeB magnets for 1 hour and a second sample did not receive an external magnetic field. The media was changed in all samples to D-MEM F-12 with 10% FBS after 1 hour. Replacing media after the field application removed free-floating ODN-laden particles from the solution, as well as any free ODN remaining in solution. The cells were incubated for an additional 23 hours before imaging. The total duration of the experiment was 24 hours. After 24 hours fluorescence microscopy was used to quantify the transfection efficacy. The imaging and segmentation process is described in section 2.6.9.
26
Figure 2.8 Representatives images of cells transfected with PEI-ODN, Lipofectamine, and nanoparticles with and without an applied magnetic field. Oligonucleotide concentrations were all 200 nM. Average fluorescence intensities are calculated based on image segmentation collected across the wells.
Chapter 3
Development of an Oscillating Magnetic Field Transfection Device 3.1 Overview
own oscillating magnetic force device. My first iteration was modeled after the commercially available device as I attempted to improve upon its design. This device produced the initial results presented in section 4.5.2. My second iteration sought to improve upon this, and was designed to produce uniform forces across the well and the desired higher frequency range. This device produced all of the transfection results after section 4.5.2.
To design a platform to test the effects of alternating fields on non-viral magnetic particle transfection, a crucial factor in the design is the distance of the magnets from the cell culture. The magnetic force exerted on a paramagnetic bead is governed by the equation:
(3.1)
where is force, is the diameter of the bead, is the permeability of free space (in SI units), is the relative permeability of the bead, and is the magnetic field. A bead’s permeability is related to its susceptibility by the equation:
(3.2)
30
permeability of the particle can be adjusted to increase force. This is done by adjusting the material composition of the particles. As the relative permeability increases, the
limit of the quantity increases asymptotically to 1, placing an upper bound on the
contribution permeability makes to the overall force. Lastly the force is dependent upon the field and field gradient. In order to apply a force to a paramagnetic particle a magnetic field alone is not sufficient to induce translational motion a field gradient must also be present. To achieve this, the magnet must be placed in closest practical proximity to the sample in order to be in the region of highest gradient.
The importance of distance from the magnetic pole can be shown in the equation:
(3.3)
where r is the distance between the magnetic pole and the bead. The force on a bead decays by a factor of 1/r5 so the distance between pole and sample is one of the primary factors when designing such a system.
3.2 Oscillating Magnetic Force Transfection Device
3.2.1 Cell Culture Holder
To control the distance of the cell culture and the magnetic plate, I employed an XYZ translation stage. I used a Thorlabs ½” XYZ translation stage as a basis for the transfection device. A stage was designed to hold standard 6 or 12 well tissue culture dishes. It is designed to allow access to the bottom of the cell culture dish, enabling the magnets to physically contact the bottom of the wells. It is screwed into the translator stage and the distance between the dish and the magnets can be vertically adjusted with the micrometer. The micrometers have a resolution of 10 m and the distance of the travel can be shown by the tick marks labeling the micrometer. This enables easily reproducible adjustments for z-distance between the plate and magnets, and allows us to bring the cell culture dish as close to the magnets as possible and still allow for free translation of the magnetic plate.
Figure 3.1 (A) Isometric view of cell culture plate holder. (B) Side view. (C) Front view. (D) Top view.
A. B.
32 3.2.2 Magnet Geometry
The magnetic plate is composed of a lid of a standard 6-well tissue culture dish. Its similarity in size to the tissue culture plate made it a simple yet effective component for making the plate. Magnets were acquired from K and J Magnetics Inc. (Jamison, PA). The magnets chosen were axially magnetized 0.25" diameter by 0.2" height cylindrical magnets. These magnets’ diameters are significantly smaller than the diameter of a 6-well (~1.4”) or 12-6-well (~0.9”) plate. These magnets are rare earth magnets composed of
Figure 3.2 (Top) Disk magnet calibrated across the diameter. The probe is actually in contact with the surface during measurement. (Bottom Left) Magnetic field along the top surface of a 1” neodymium magnet, along the diameter. (Bottom Right) Calculation of the magnetic gradient. The biggest changes in field and gradient occur at the edges of the magnet.
Each data point is 250m apart which is smaller than the reported magnet displacement
of 200m. While the change in gradient is relatively high at the edges of the magnet, for roughly 75% of the diameter of the magnet the change in gradient on average is only 5 T/m. Therefore, oscillating a magnet with an amplitude of 200m would only produce a minimal change in force application for the majority of the cells which are not at the periphery of the magnet edge. This does not optimize the field effects. Alternately, sweeping a magnet underneath the entire cell culture will allow all of the cells to experience the full range of magnetic gradients from the maximum to zero. The oscillating effect, that is, changing the force application upon the magnetic vectors, is only optimized by applying the full range forces including the zero force range. Otherwise, the change in gradient will be orders of magnitude smaller for the majority of the cells.
34
vast majority of the cells. It stands to reason that a more favorable geometry would be composed of a series of smaller magnets arrayed over the surface of the well. This would provide for higher gradients throughout a greater percentage of the cell culture and thus higher forces applied to more particles over a greater portion of the well.
3.2.3 Force Calibration
To calibrate the forces on a particle by a magnet it is standard to mix the particles into a Newtonian fluid, and measure the velocity and calculate the force based on Stokes’
law:
(3.4)
However, the particles used in these transfection experiments are below the diffraction limit of an optical microscope (200nm). So we refer to physical laws of magnetism to give us estimations for the forces the particles experience. We do this based on the equation:
(3.5)
which tells us that the force on a particle depends on its volume (V), volume magnetic susceptibility (), the permeability of free space (), the magnetic field (B), and field gradient. The particles are not perfectly spherical, but for calculation purposes, we will treat them as an idealized sphere of volume:
(3.6)
squared per meter). To convert the H field, 1 Oe = 1000/4A/m so then 1000 Oe is equal to 250000/ A/m. Magnetization is described mathematically by:
(3.7)
where m is the mass magnetic susceptibility and H is the magnetic field. Solving for susceptibility yields:
(3.8)
The conversion for volumetric susceptibility is:
(3.9)
The bead density is 3.0 g/ml3 (3,000,000 g/m3) as reported by the manufacturer. This yields a susceptibility of:
(3.10)
36
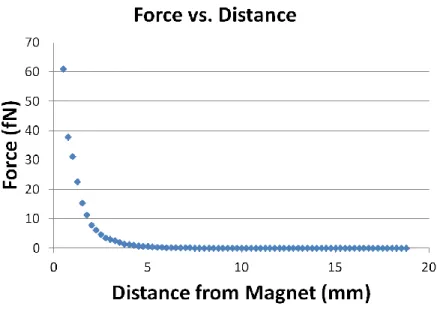
Figure 3.3 (Left) Magnetic field is measured from the center of the disk magnet. (Right) Field vs. distance of single 0.25" diameter by 0.2" height cylindrical magnets
Taking the particle to be an idealized sphere of radius 65nm yields a volume of 1.15x10 -21
m3. To calculate the gradient we use a five point stencil method:
(3.11)
The permeability of free space = 4x10⁻⁷ Vs/(Am). The theoretical force is then
Figure 3.4 Force vs. distance of single 0.25" diameter by 0.2" height cylindrical magnets.
The magnets were arrayed in such a manner that an equal number of magnets would be underneath each well. For the 6-well cell culture dish, the magnetic plate had 9 equally spaced magnets arranged under each well. The magnets are positioned in alternating north/south polarity, with no two poles being similar in an adjacent left/right or up/down position.
The magnetic plate is attached to a linear induction motor to produce the oscillations in the X-Y plane. A stage was designed to screw into the motor that would hold the magnetic plate in place underneath the cell plate. The linear motor is controlled using a Wavtek Model 801 50MHz Pulse Generator. Connections are made to the motor using fully insulated 5/16” alligator clips via the 50output connector. With the device
fully assembled, testing was performed to test the magnitude and frequency that the motor would drive the plate. A square wave signal was sent to the motor and the width was varied from 10s to 100ms. The delay was set to 0s, and the period was adjusted
38
undergoing oscillating motions while driven by the pulse generator at different settings. Video was taken using a Sony Cyber-shot W510 digital camera. Video was captured at 30 frames per second and analyzed using Video Spot Tracker.
3.2.4 Rotating Magnetic Array
An alternate means of producing the oscillating magnetic field was produced using a rotating DC motor. Previous studies have reported enhanced transfection producing an oscillating field with a rotating magnet array. (D. Vainauska 2011) In light of the issues faced with the previous set up, this methodology proved to be a way to continue experiments without significant loss of time. The motor is connected as previously described to the Wavtek pulse generator. The magnetic array consists of 4 Neodymium block magnets arranged at 45 angles at the vertices and along the diagonals of a square. The block magnets are rectangular prism with dimensions of 1” ¼” ½”
Figure 3.5 (A) Top view of magnet array (B) Image of magnetic system as it is setup in the cell culture incubator (C) Schematic of experiment in 96 well plate.
3.2.5 Frequency Calibration
40
video, the dependence of voltage vs. rotational frequency is established. A plot of this is shown below.
Figure 3.6 Calibration of motor to determine rotational frequency vs. voltage. Because there are 4 magnets attached to the motor, magnets actually pass under the sample at 4X the calibrated frequency.
Figure 3.7 Magnet frequency vs. voltage
3.2.6 Force Determination
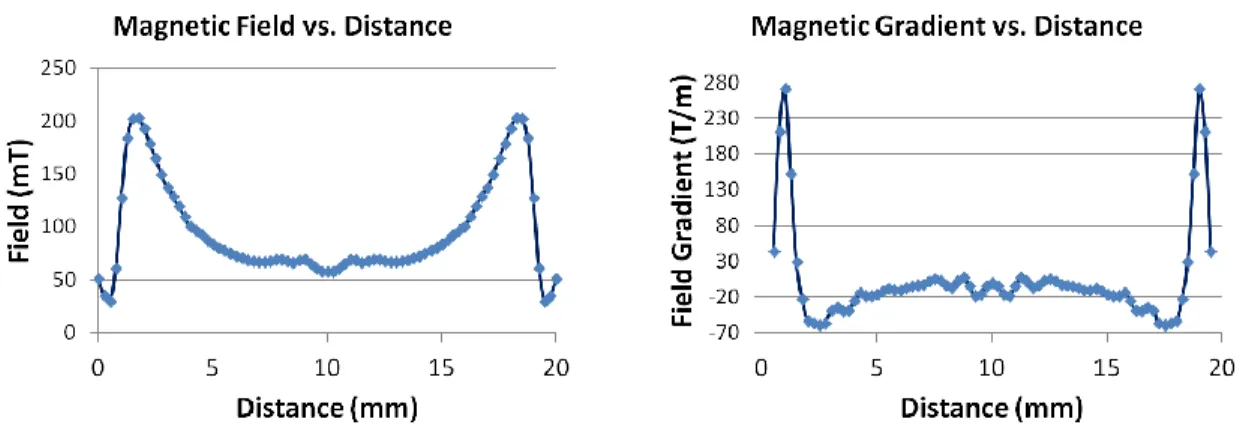
The magnets are calibrated with a F.W. Bell Model 5080 gaussmeter to measure the field at 250 m increments from the face of the magnet. This gives information about the point that the particles experience the greatest z-component of the force. A plot of the magnetic field vs. distance is shown below:
42
Because of the rotation of the motor the magnetic field, force, and gradient at the sample follow a periodic wave pattern. The distance between the magnets and the underside of the cell culture dish is determined to be 0.015”. This is determined by placing the magnet underneath a sample 96 well plate, and then using the micrometer to move the plate down to the magnets to the point at which the plate contacts the magnets. The Thorlabs MT3 XYZ translation stage has micrometers with tick marks that provide 0.001” resolution.
The NUNC 96-well plate specifications indicate that the thickness of the polymer surface is 0.01”, and therefore the sum of these measurements gives us the total of 0.025” or 6.35mm distance between the magnets and the cells.
360. These measurements were done at the z-height of the magnet and at a height twice the distance the magnets would be from the cells in an experiment. This was done so that a z-gradient could be calculated at the location of the cells during an experiment. Given this field and gradient is calculated as previously described. (Figure 3.9)
Figure 3.9 Measurements of the magnetic field vs. rotation angle. (Right) Calculation of the magnetic gradient vs. rotation angle. The two peaks are a result of high field and gradient at the top two edges of the rectangular magnet.
44
Figure 3.10 Derived vertical magnetic force vs. time. (A) 2Hz (B) 4Hz (C) 10Hz (D) 20Hz
The magnetic field gradient reached a peak of 154.8 (T/m). The point of highest gradient is of course the place where the highest force is achieved. The force on the particles due to the magnetic field and gradient reached a peak of 43.4 fN and reached a minimum of essentially zero.
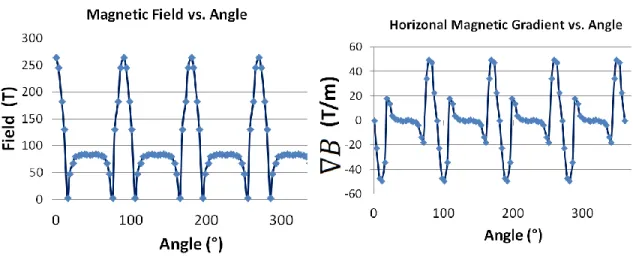
described for the vertical calibration. The field is measured and the gradient is calculated and shown in Figure 3.11:
Figure 3.11 (Left) Measurements of the horizontal magnetic field vs. rotation angle. (Right) Calculation of the horizontal magnetic gradient vs. rotation angle.
46
Figure 3.12 Calculated horizontal magnetic force vs. time. (A) 2Hz (B) 4Hz (C) 10Hz (D) 20Hz
The force in the XY plane reaches a maximum of 7.9 fN. The plots of force go into the negative values showing that the direction of the force reverses direction as the magnet passes over the sample. So in addition to the oscillation of force in the Z-direction, a significant component of the oscillation is also produced in the lateral direction.
To put this force regime in perspective, it can be contrasted with the force exerted on the particle due to gravity. The bead density is reported by the manufacturer as 3 g/cm3, (Teller and Grüttner 2012) which is equal to 3000000 g/m3. Treating the particle as an idealized sphere, the volume of the particle is 1.15x10⁻²¹ m3 as shown previously. The mass of the particle is the found using
Where m is the mass, is the density, and V is the volume. Therefore the mass is calculated to be 3.45x10⁻¹⁵ g (3.45x10⁻¹⁸ kg). The force on an object due to gravity is given by Newton’s law of universal gravitation:
(3.13)
Where G is the gravitational constant (6.674x10⁻¹⁸ Nm2kg-2), m1 is the mass of the first
object (in this case the earth, 5.9742x1024 kg), m2 is the mass of the second object (in this
Chapter 4
Transfection is Enhanced with Oscillating Magnetic Fields
4.1 Overview
This chapter details the use of the oscillating magnetic field device described in chapter 3 to enhance transfection of HeLa cells. Using a range of oscillation frequencies EGFP expression levels are increased, and I show that the effect behaves like a band pass filter. How oscillating forces actually produce enhanced transfection efficiencies has been a previously unanswered question in the field. I detail a modification to published transfection protocols that allow me to better distinguish what phases of the transfection are affected by the oscillating forces, and therefore get closer to the reasons why the forces are actually beneficial.
4.2 Published Oscillating Field Transfections have not Revealed Mechanisms Responsible for Enhancing Effects
50
1 and 5Hz, with a similarly low amplitude of 200m. (Pickard and Chari 2010) There are other studies that have investigated this effect, but overall the number of published articles is quite low, with around 10 total papers at the time of this writing. All of these papers have shown that there exists an enhancement to transfection due to an oscillating magnetic field, but they also all contain one fundamental issue in understanding the nature of the effect. These experiments do not distinguish between the transport and post-transport phases of delivery, because there are nanoparticles still free-floating in culture during the application on the oscillating fields. While this may result in improved transfections, it does not lead to a clearer understanding of how oscillating fields improve transfection rates.
4.3 Protocol to Effectively Study Oscillating Force Effects
Figure 4.1 Schematic of a typical oscillating field Magnetofection experiment in literature. Oscillating fields are applied as nanoparticles are still freely floating in the cell culture, making it impossible to distinguish transport to the cell from post-transport effects.
52
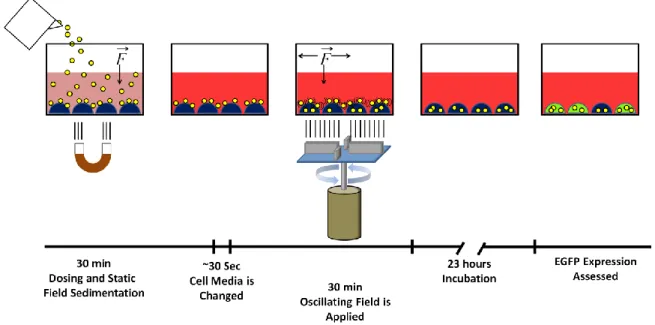
Figure 4.2a Schematic of the oscillating (AC) field transfection protocol (referred to as “Static+2Hz”, or 2Hz, 4Hz, 20Hz). 1. Oligo bearing nanoparticles are dosed into the sample and exposed to a permanent magnet for 30 minutes. 2. Cell culture media is changed to remove excess nanoparticles from solution. 3. An oscillating field is applied to the sample for an additional 30 minutes. 4. The cell culture is incubated for 23 hours. 5. Cells are imaged for EGFP expression.
Figure 4.2c Schematic of the “No Field” transfection protocol. 1. Oligo bearing nanoparticles are dosed into the sample and incubate for 30 minutes. 2. Cell culture media is changed to remove excess nanoparticles from solution. 3. The cell culture is incubated for 23 hours. 4. Cells are imaged for EGFP expression
This simple step is not done in any of the current literature of the field and the resulting data are presented here for the first time in these experiments. These data will show definitively that the oscillating field has a distinct effect on the post-transport phase of the transfection, an effect separate from the transport, with implications for future work and
in vivo therapeutic applications.
4.4 Frequency Response Experiments
54
Magnefect nano transfection system, report that the maximum operating frequency for the system is 5 Hz. It also reports that the amplitude is 0.2mm. The problems with these limitations are two-fold. First an optimal approach for probing frequency dependence would test frequencies along a wider range, beyond 1-5Hz. The peak in efficiency may exist outside of this limited range. Secondly, the amplitude of oscillation is 0.2mm. While the 0.2mm is much larger than the average length of the cell, across the face of a cylindrical disk magnet there is not much change in the magnetic field gradient over 200 microns. This is shown by the calibration of a typical neodymium disk magnet in Figure 4.3.
Figure 4.3 (Left) Calibration along the surface of a 1” neodymium magnet. (Right) Calculation of the magnetic gradient. The biggest changes in field and gradient occur at the edges of the magnet, so an oscillation of only 200m only affects a small portion of the cell culture.
Each data point is 250m apart which is smaller than the reported magnet displacement
periphery of the magnet edge. This does not optimize the field effects Alternately, sweeping a magnet underneath the entire cell culture will allow all of the cells to experience the full range of magnetic gradients from the maximum to zero. The oscillating effect, that is, changing the force application upon the magnetic vectors, is only optimized by applying the full range forces including the zero force range. Otherwise, the change in gradient will be orders of magnitude smaller for the majority of the cells.
4.5 Oscillating Field Transfections
The oscillating field transfection experiments will be described in this section. 4.5.1 Magnetic Field Application
56
using oscillating fields, their data do not elucidate the reasons the AC field produce this effect. The reasons for these results are often only qualitatively addressed in discussion. By changing the media we focus our experiment to examine the effects of the AC fields on transport of particles through the cell membrane.
After the media is changed, some samples receive an additional DC field, AC field, or no field application. The additional fields are applied for 20 minutes. A chart depicting the samples is shown below.
Name Vector
Dosage (nM) 10 min DC Media changed Additional 20 min DC field
Additional 20 min AC field
Untreated None 0 NO NO NO NO
Beads only 130nm particles 50 NO YES NO NO
DC only 130nm particles 50 YES YES NO NO
DC + DC 130nm particles 50 YES YES YES NO
DC + AC 130nm particles 50 YES YES NO YES
Lipo+623 Lipofectamine 2000 50 NO YES NO NO
4.5.2 2Hz Oscillation Produces an Increase in Relative Fluorescence Intensity of Transfected Cells
To analyze the data, images were captured of the cells via fluorescence microscopy, and were segmented in Metamorph to measure the mean intensity of EGFP expression cells. We auto-threshold for light objects and adjust the threshold as needed to capture the entirety of the cells in the image. An average and standard error is calculated from 30-50 images from each sample. The data are normalized with respect to Lipofectamine. The Lipofectamine expression level is normalized to a value of 1000, and the other averages are adjusted to the same scale. The results of the first experiment are shown below. Data are reported in Figure 4.4 as mean relative intensity SE.
58
application, nanoparticles with static plus oscillating field, and a Lipofectamine control. (Bottom) Image segmentation results from transfection.
The relative fluorescence intensity of the 10 minute static field (DC) application was 701
25 as compared to the non-magnetic particle dosage which measured 600 46. It
should be noted that there was a clear difference in the number of expressing cells between the DC application and the no magnet sample. Transfection efficiency was not measured in these experiments, but qualitatively, finding fluorescent cells in the non-magnet sample required significantly more scanning of the well between fluorescent cells, meaning the transfection efficiency is lower in that sample. Additionally, from a qualitative sense, the DC+AC samples had a higher efficiency than the other nanoparticle dosed samples. Transfection efficiency will be examined in later studies. After changing cell media, an additional application of an oscillating (AC) field measured a relative fluorescent intensity score of 901 44. These cells were on average 28.5% brighter than the cells from the DC application. These data indicate that the oscillating field has a direct impact on the endosomal uptake of the particle once it is on the membrane. These data are distinct from previous reports, because the effect of the uptake specifically has been isolated by the methodology of the experiment.
4.5.3 Frequency Response Transfection
Figure 4.5 Cells are plated in 4 adjacent wells so that all cells receive the most uniform field application possible.
This allows each well to receive the most uniform field application possible. After the oscillating field application the cells are allowed to incubate for 24 hours. Prior to imaging, cells are stained with Syto 82 nucleic acid stain to enable counting of the entire cell population. Cells are then imaged to assay for EGFP expression. The entire assay is described in section 8.4.3.
60
4.5.4 Oscillating Field Enhancement is Frequency Dependent, and Peaks at 10Hz Example images and a plot of the transfection efficiency are shown in Figure 4.6.
Figure 4.6 (Top) Images of HeLa EGFP-654 cells after transfection. Cells are imaged in the Texas Red (Syto 82) and GFP channels and merged together. (Bottom) Cells are counted and transfection efficiency calculated. Peak transfection efficiency is achieved at 10 Hz. (*) indicates significant difference between the static only sample, (**) indicates significant difference between the 10Hz and 20Hz samples, and (***) indicates significance between the static and non-magnetic samples.
Chapter 5
Oscillating Magnetic Field Transfection and Endocytosis Pathway Dependence
5.1 Overview
This chapter details for the first time an endocytic pathway dependence involved in oscillating magnetic field nanoparticle transfection. For the first time I identify the pathways that are highly sensitive to oscillating force application, that are able to increase transfection efficiency by as much as 2.3X. I present the first evidence to demonstrate that oscillating forces are a way to preferentially target certain pathways, without the need for specialized ligand-receptor modification to the nanoparticles. These results show the most detailed data of how forces influence transfection. I propose mechanisms that may be affected by forces to explain how they transfection is enhanced. The applications from these discoveries have an impact on future in vivo drug delivery and may be a means to overcome drug resistance in resistant cells.
5.2 Endocytosis Pathways
64
Figure 5.1 illustrates the various endocytosis pathways that are involved in transfection, used courtesy of Rudy Juliano of University of North Carolina at Chapel Hill. (Juliano, Ming et al. 2012) This section will discuss the pathways important in nanoparticle transfection.
5.2.1 Clathrin Mediated Endocytosis
Clathrin coated pits were first reported in 1964 in a paper by Roth and Porter. (Roth and Porter 1964) The existence of the clathrin coated lattice was first reported in 1976 by Pearse, in which coated vesicles were purified from several cell lines and imaged with electron microscopy. The clathrin protein is bound to the luminal side of the cell membrane in a complex with the adaptin protein. As a cargo molecule binds to a cargo receptor protein, the cell membrane begins to invaginate, beginning the process of transport into the cell. As this continues, the invagination begins to take on a more spherical conformation. As this enclosure is formed, dynamin and actin are recruited to this region and act to pinch it off from the cell membrane, creating a newly formed intracellular vesicle. This is referred to as a clathrin coated vesicle. The clathrin proteins form a lattice around the exterior of the vesicle and as such are generally restricted in size in the 85-110nm range for mean diameter. At some point after becoming fully engulfed into the cytosol, the clathrin coat releases from the vesicle, and the clathrin triskelions are recycled back to the luminal side of the cell membrane, where the process can continue.
5.2.2 Caveolae Mediated Endocytosis
Helenius 2002) These caveolae are formed from lipid rafts in the cell membrane, comprised of cholesterol, glycosphingolipids, and Glycosylphosphatidylinositol (GPI) anchored proteins. The primary protein constituent is the caveolin protein. Dynamin is shown to be part of the caveolae complex, a protein associated with the pinching off of vesicles at the end of the endocytic process. Lipids in the cell membrane, including the lipid rafts in caveolae, have lateral mobility across the membrane which is a function of the composition of the lipid raft. (Hancock 2006)
5.2.3 Macropinocytosis
Macropinocytosis is a third form of cellular uptake that cells use to bring nutrients from the extracellular milieu to the cytosol. First observed by Warren Lewis in 1931, the entry point for the vesicles (macropinosomes) in macropinocytosis occurs in the regions of ruffling that occurs at the periphery of spread attached cells. (Swanson and Watts 1995) This ruffling can be described as planar or circular extensions of the cell membrane which protrude out and then fold back into the membrane. This process results in the formation of the characteristic vesicles. These macropinosomes can be as large as 5m, (Fawcett 1965) significantly larger than the vesicles involved in clathrin mediated endocytosis. The ruffles are the result of actin filaments protruding and causing the membrane to ruffle, or appear to ruffle when viewed at an increased frame rate.
5.2.4 Non-Caveolae/Clathrin Mediated Endocytosis