Genome analysis
pETM: a penalized Exponential Tilt Model for
analysis of correlated high-dimensional
DNA methylation data
Hokeun Sun
1, Ya Wang
2, Yong Chen
3, Yun Li
4,5,6and Shuang Wang
2,*
1
Department of Statistics, Pusan National University, Busan 609-735, Korea,
2Department of Biostatistics, Mailman
School of Public Health, Columbia University, New York, NY 10032, USA,
3Division of Biostatistics, Perelman School
of Medicine, University of Pennsylvania, Philadelphia, PA 19104, USA,
4Department of Biostatistics,
5Department of
Genetics and
6Department of Computer Science, University of North Carolina, Chapel Hill, NC 27599, USA
*To whom correspondence should be addressed. Associate Editor: John Hancock
Received on September 29, 2016; revised on January 19, 2017; editorial decision on January 30, 2017; accepted on January 31, 2017
Abstract
Motivation:
DNA methylation plays an important role in many biological processes and cancer
pro-gression. Recent studies have found that there are also differences in methylation variations in
dif-ferent groups other than differences in methylation means. Several methods have been developed
that consider both mean and variance signals in order to improve statistical power of detecting
dif-ferentially methylated loci. Moreover, as methylation levels of neighboring CpG sites are known to
be strongly correlated, methods that incorporate correlations have also been developed. We
previ-ously developed a network-based penalized logistic regression for correlated methylation data, but
only focusing on mean signals. We have also developed a generalized exponential tilt model that
captures both mean and variance signals but only examining one CpG site at a time.
Results:
In this article, we proposed a penalized Exponential Tilt Model (pETM) using
network-based regularization that captures both mean and variance signals in DNA methylation data and
takes into account the correlations among nearby CpG sites. By combining the strength of the two
models we previously developed, we demonstrated the superior power and better performance of
the pETM method through simulations and the applications to the 450K DNA methylation array
data of the four breast invasive carcinoma cancer subtypes from The Cancer Genome Atlas (TCGA)
project. The developed pETM method identifies many cancer-related methylation loci that were
missed by our previously developed method that considers correlations among nearby
methyla-tion loci but not variance signals.
Availability and Implementation:
The R package ‘pETM’ is publicly available through CRAN: http://
cran.r-project.org.
Contact: [email protected]
Supplementary information:
Supplementary data
are available at
Bioinformatics
online.
1 Introduction
Epigenetic alterations in association with promoter CpG islands are among the most common molecular alterations in human neoplasia. Promoter hypermethylation leads to long-term silencing of key genes
involved in DNA repair, cell cycle control, apoptosis, angiogenesis and metastasis, thereby contributing to initiation and progression of
cancer (Marsitet al., 2009). Such promoter hypermethylation is
found in virtually every type of human neoplasm and is as common
VCThe Author 2017. Published by Oxford University Press. All rights reserved. For Permissions, please e-mail: [email protected] 1765
doi: 10.1093/bioinformatics/btx064 Advance Access Publication Date: 6 February 2017
as mutations in classic tumor-suppressor genes in human cancers (Baylin and Ohm, 2006;Jones and Baylin, 2002;Shenet al., 2013).
For epigenome-wide association studies (EWAS) with high-dimensional DNA methylation data, methods that take into account correlations among sites in a gene or among genes in a pathway have shown to perform better than methods that analyze DNA methylation sites one at a time (Jiaoet al., 2014;Ruanet al., 2016;
Sun and Wang, 2012,2013;Westet al., 2013). Moreover, recent
studies have observed that there are higher variations in cancer tis-sues than in normal tistis-sues across human cancer types (Hansen
et al., 2011) and several methods were developed that consider both
mean and variance signals (Chen et al., 2014;Ruanet al., 2016;
Teschendorff and Widschwendter, 2012;Teschendorffet al., 2014).
In our previous work, we developed a penalized logistic regres-sion with network-based regularization, which combines quadratic Laplacian penalty for smoothness andl1-norm penalty for sparse
se-lection for high-dimensional DNA methylation data (Sun and
Wang, 2012,2013). This method considers correlation patterns of
CpG sites within a gene or a genetic region and performs variable se-lection encouraging a grouping effect of CpG sites within a gene or a genetic region. One noticeable advantage of this network-based regularization over other group penalty regularization methods is that it can perform individual selections within a group if there exists causal and noncausal CpG sites rather than forcing all sites to be selected. However, this network-based penalized method only considers mean signals in DNA methylation data. Our group also developed a generalized exponential tilt model which captures both mean and variance signals in DNA methylation data with a case-control design (Chenet al., 2014). But this generalized exponential tilt model only examines one locus at a time. Most recently, we de-veloped a network-assisted algorithm, NEpiC algorithm, that con-siders both mean and variance signals and prior biological information from the protein-protein interaction (PPI) network
(Ruanet al., 2016). This NEpiC algorithm conducts site-level tests
first combining mean and variance signals and then searches for dif-ferentially methylated sub-networks using biological information on gene levels. It does not consider correlation patterns among nearby methylation sites in a gene or a genetic region.
In this paper, we propose the pETM method, a penalized Exponential Tilt Model that detects both mean and variance signals with the network-based regularization considering correlations among CpG sites in a gene or a genetic region in case-control de-signs. We have previously demonstrated that the generalized expo-nential tilt model can identify differentially methylated loci when cases and controls are different in methylation means only,
methyla-tion variances only or in both (Chenet al., 2014). The proposed
pETM method aims to effectively combine the generalized exponen-tial tilt model with a network-based penalty function such that it can detect both mean and variance signals when inducing a grouping effect of correlated CpG sites within a gene or a genetic region.
We conducted simulation studies to show the performance of the proposed pETM method comparing to our previously developed penalized logistic regression method with network-based regulariza-tion that does not use variance signals. We applied the pETM to the case-control type of 450K DNA methylation datasets of four sub-types of breast invasive carcinoma (BRCA) from The Cancer Genome Atlas (TCGA) project as well as the same ovarian cancer 27K DNA methylation data we previously examined as a compari-son. The results show that the proposed pETM method that con-siders correlations among CpG sites and both mean and variance signals at each CpG site identifies more cancer-related loci than method that does not consider both pieces of information.
2 Materials and methods
We denote the methylation levels of the ith individual by
xi¼ ðxi1;. . .;xipÞT;i¼1;. . .;n, wherepis the total number of CpG sites andnis the total number of individuals considered. Similarly,
we denote the m covariates such as age and gender by
ti¼ ðti1;. . .;timÞT. The exponential tilt model in logistic regressions (Chenet al., 2014;Qin, 1998) is defined as
log pðxi;tiÞ 1pðxi;tiÞ
¼b0þtTiaþh1ðxiÞTb1þh2ðxiÞTb2; (1)
where pðxi;tiÞis the probability that the ith individual is a case
based on his/her DNA methylation levels xi and covariate
in-formation ti. The functions h1ðÞ and h2ðÞ are pre-specified.
For example, h1ðxÞ ¼x and h2ðxÞ ¼x2 if the underlying dis-tribution ofxiis a Gaussian distribution, andh1ðxÞ ¼ logðxÞand h2ðxÞ ¼ logð1xÞif the underlying distribution ofxiis a Beta
dis-tribution. In this model, we are interested in estimating the intercept
b0, the regression coefficients for covariates a¼ ða1;. . .;amÞT and the regression coefficientsb¼ ðbT1;b
T
2Þ ¼ ðb1;. . .;bp;bpþ1;. . .;b2pÞT for all CpG sites.
In an exponential tilt logistic regression framework, we can test H0:bj¼bpþj¼0 to test if there are mean and variance differences
in DNA methylation at thejth CpG site,j¼1;. . .;p. We previously proposed a composite likelihood based test statistic to testH0(Chen
et al., 2014). However, this method only considers one CpG site at a time and does not incorporate correlations among nearby CpG sites. To consider correlation patterns among CpG sites within a gene or a genetic region together with covariate effects, here we combine the exponential tilt logistic regression with a network-based penalty function and develop the penalized Exponential Tilt Model (pETM). The pETM model based on a logistic likelihood can be written as:
1
n Xn
i¼1
yilogpðxi;tiÞ þ ð1yiÞlogð1pðxi;tiÞÞ
f g þPðbÞ; (2)
wherePðÞis a penalty function for regularization, and the response yiis 0 for controls and 1 for cases. The parametersb0,aandbcan
be estimated by minimizing the penalized likelihood function (2). We previously developed a network-based regularization penalty
function (Sun and Wang, 2012,2013), which is expressed as:
PðbÞ ¼ k1kbk1þk2bTLb
¼ k1
X2p
j¼1
jbjj þk2 X2p
u¼1 X
uv bu
ffiffiffiffiffi du
p bffiffiffiffiffiv dv
p !2
wherek k1is al1norm, and uvindicates the index set of all
linked CpG sites to theuth site. The Laplacian matrixL¼ fluvg rep-resents a network graph among CpG sites, defined as
luv¼
1 if u¼vanddu6¼0
ðdudvÞ
1
2 if uandvare linked with each other
0 otherwise;
8 > > < > > :
whereduis the total number of links of theuth CpG site, and it is
often called a degree of the vertexuin graph theory. The tuning par-ametersk1andk2control the amount of regularization for sparsity
and smoothness, respectively. We used ring or fully connected net-work graphs for the Laplacian matrix of the penalized logistic re-gression (Sun and Wang, 2012). In the ring network, only adjacent CpG sites and the first and the last CpG sites within a gene are con-nected with each other so that all CpG sites in a gene have two links.
In the fully connected network, any two CpG sites within a gene are
connected with each other so that each CpG site hass– 1 links
wheresis the number of CpG sites in the gene. Both network graphs
basically assume that sites within a gene or a genetic region are linked with each other so that the Laplacian penalty can induce a grouping effect on these sites. Our work and others have demon-strated that the selection using the network-based regularization outperforms that of other regularization methods (Li and Li, 2010;
Sun and Wang, 2012,2013;Sunet al., 2014).
In the proposed pETM method when both mean and variance
signals from the same site are examined, we need to consider 2p
re-gression predictors. The firstppredictorsh1ðxiÞare for mean signals and the secondppredictorsh2ðxiÞare for variance signals when the two sets ofp-dimensional predictors represent the same set ofp -di-mensional CpG sites. Therefore, we impose an additional link be-tween the mean and variance predictors from the same sites in the
Laplacian matrix. For example, for theuth CpG site, theuth
pre-dictorh1ðxiuÞfor the mean and theðuþpÞth predictorh2ðxiuÞfor the variance are linked with each other for u2 f1;2;. . .;pg. Therefore, for two CpG sitesu6¼vthat are linked, it implies thath1
ðxiuÞis connected withh1ðxivÞ, withh2ðxiuÞ, and withh2ðxivÞ. This implementation allows the selection of CpG sites with either differ-ential means or variances and at the same time takes into account the fact that the two signals are from the same CpG site.
Although the closed form solution ofðb0;a;bÞdoes not exist, the estimates ðbb0;ba;bbÞ that minimize the penalized exponential tilt model (2) can be obtained via convex optimization algorithms. One of the most popular algorithms with high-dimensional sparse data is a cyclic coordinate descent algorithm that provides the pathwise so-lution tobalong with a fine grid of tuning parameter values fork1
andk2(Friedmanet al., 2010;Simonet al., 2011;Sun and Wang,
2012,2013). We apply this algorithm to obtain a solution of the
proposed pETM method, where we have a total of 2pþmþ1
re-gression parameters withmþ1 parameters being excluded from the
regularization. More specifically, to apply the cyclic coordinate des-cent algorithm, we first replace the logistic likelihood of the
2pþmþ1-dimensional predictors by a quadratic approximation
using the Taylor expansion, and then use weighted least squares to iteratively solve for eachbj,j¼1;. . .;2pand eachal,l¼1;. . .;m,
(Sun and Wang, 2012,2013). When we solve foral, we need to set
k1¼k2¼0 since this parameter is not penalized. Once we get the
solution ofðba;bbÞ, the intercept parameterbb0 can be naturally ob-tained. The algorithm iteratively updates each parameter until a con-vergence criterion is met. The computational time to get the solutions depends mainly on the number of CpG sites and the num-ber of grids for the two tuning parametersk1andk2.
Cross-validation is generally used to find the optimal tuning par-ameter values ofk1andk2after the pathwise solutions ofðb0;a;bÞ along with different values ofk1andk2are obtained. Therefore, the
final selection results of CpG sites that are associated with an out-come rely on the tuning parameter values selected by cross-validation.
Alternatively, selection probability of each CpG site can be com-puted through a finite number of resampling of samples (Meinshausen and Bu¨hlmann, 2010). It has been shown that selec-tion probabilities provide much more stable selecselec-tion results than cross-validation. Moreover, selection of a set of optimal tuning par-ameter values is not required to obtain the selection probability for each CpG site. A few different values of tuning parameters are enough to rank selected CpG sites by frequency. The computational cost can thus be drastically reduced, which is essential in analyzing high-dimensional data. In the proposed pETM model, selection
probabilities of CpG sites are computed based on specified values of tuning parameters withk¼k1þ2k2anda¼k1=ðk1þ2k2Þ, where
k>0 controls the amount of regularization anda2 ½0;1controls the proportion ofl1-norm penalty against the Lapacian penalty. If we
denoteIkas the index set of thekth random subsample off1;. . .;ng
with the sizebn=2c, the selection probability of theuth CpG site is defined as the following for a given values ofðk;aÞ:
SPðuÞ ¼max
k;a
1
K#fkK:ðbb k;a
u ðIkÞ 6¼0Þ [ ðbb k;a
uþpðIkÞ 6¼0Þg;
whereKis the total number of resamplings andbbku;aðIkÞis the
solu-tion ofbuin the proposed pETM model using the subsampleIk. For
each resampled data, we select nonzero regression coefficients and the corresponding CpG sites. The selection frequency of each CpG site from a finite number of resamplings is then computed. That is, the selection probabilities measure relative selection frequencies of CpG sites which can be used for ranking purposes. Although tuning parameter values can affect the magnitude of selection probabilities, the ranking results should not be affected as selection probabilities are relative measures. We set the total number of resampling at K¼100 in both simulation studies and real data applications.
3 Simulation studies
We conducted simulation studies to investigate the performance of the proposed pETM method that considers both mean and variance signals and takes correlations among CpG sites into account in a penalized regression framework. We compared the performance of pETM with that of penalized logistic regression (plog) we previously developed (Sun and Wang, 2012).
We simulated methylationb-values similarly as inSun and Wang
(2012), where multivariate normal values were generated for each gene and an inverse logit transformation was applied so that methy-lation data can lie between 0 and 1. The methymethy-lation measures were
simulated on gene level where for each gene, the methylationb
-val-ues of theith individual were generated as:
xi¼
expðtiÞ
1þexpðtiÞ; where ti
ffiffi s
p
Nðl;DTRDÞ;
and the scale parameters¼4 allows the methylation levels to be en-riched at 0 and 1, mimicking the distribution of real methylation measures. Here the mean vectorl¼ ðl1;l2;. . .;l5ÞTcontrols mean differences and the diagonal matrix D¼diagð ffiffiffiffiffid1
p ; ffiffiffiffiffid2
p
;. . .; ffiffiffiffiffid5
p Þ
controls variance differences between case and control groups. The
covariance matrix R is defined as an AR(1) matrix such that
Ruv¼qjuvj, where we setq¼0:5 as the correlation among CpG
sites in a gene.
We generated 1000 genes, each having 5 CpG sites. We then se-lected 8 genes out of 1000 genes and set 4 to have 3 causal CpG sites out of the 5 sites and the other 4 to have 2 casual sites. That is, there are 20 causal sites out of 5000 sites. If thejth CpG site is causal and the mean is different between case and control groups, we then set
lj¼0:5;0:75, or 1 for cases andlj¼0 for controls. If thejth CpG
site is causal and the variance is different between case and control groups, we then setdj¼2;3 or 4 for cases anddj¼1 for controls. If
thejth CpG site is noncausal, we setlj¼0 anddj¼1 for both case
and control groups. We set the sample size to be 50 cases and 50 controls. We examined the corresponding mean and variance effect sizes of the original methylationb-values empirically and found that
the averaged mean differences ofb-values between case and control
groups are 0.148, 0.215 and 0.275 whenlis set at 0.5, 0.75 and
1.0, respectively. Similarly, the averaged ratio of variances ofb -val-ues between case and control groups are 1.342, 1.518 and 1.638
whendis set at 2, 3 and 4, respectively. We also considered two
covariates, one continuous and one binary. The continuous covari-ate follows a normal distribution with a mean of 0.5 and a variance of 1 for cases and a mean of 0 and a variance of 1 for controls. The binary covariate follows a Bernoulli distribution with a probability 0.7 for cases and 0.2 for controls.
In analysis of DNA methylation data,Zhuanget al.(2012)
pro-posed to use methylation M-values, a logit transformedb-values
with base 2, and showed that association results are more reliable
comparing to those using methylationb-values. Therefore, in
simu-lation studies, we applied the proposed pETM method and the
com-paring penalized logistic regression plog method to bothb-values
and M-values. For methylation b-values, we applied the pETM
method with a Beta distribution (pETM-B) whereh1ðxiÞ ¼logðxiÞ
andh2ðxiÞ ¼logð1xiÞinequation (1). For methylation M-values,
we applied the pETM method based on a Gaussian distribution (pETM-M) whereh1ðxiÞ ¼xi andh2ðxiÞ ¼x2i inequation (1). For
comparison, the plog method (Sun and Wang, 2012) was also
applied to both methylationb-values B) and M-values
(plog-M). We compared averaged true positive rates of the four methods based on the top ranked 20, 40 and 80 selected CpG sites by selec-tion probabilities from 100 simulaselec-tion replicaselec-tions with differ-ent values oflandd. Here the true positive rate is defined as the number of true causal CpG sites out of the selected top ranked CpG sites divided by the total number of true causal CpG sites which is 20.
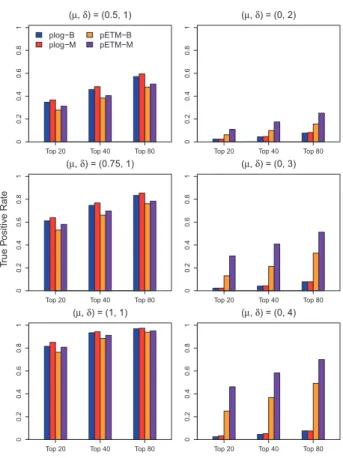
InFigure 1, the three plots in the left column show the averaged
true positive rates of the four comparing methods when there are only mean signals between case and control groups, i.e.lj¼0:5;
0:75 and 1, anddj¼1. The three plots in the right column display
the averaged true positive rates when there are only variance signals between case and control groups, i.e.lj¼0, anddj¼2;3 and 4. It
suggests that plog-B/plog-M has slightly higher true positive rates than the proposed pETM-B/pETM-M when there are only mean sig-nals. This is expected because plog-B/plog-M is more parsimonious when there is no variance signal. As pETM-B/pETM-M performs
variable selection on 2pvariables, the selection performance of
the proposed pETM method may not be as good as that of plog method due to curse of dimensionality. However, as the size of the mean differences increases, the differences among the true positive rates from the four comparing methods become almost negligible. However, plog-B/plog-M can hardly detect any CpG sites that have only variance differences between case and control groups, even if the size of the variance differences is large. Instead, the proposed pETM method can identify CpG sites when there are ei-ther mean differences or variance differences between case and con-trol groups.
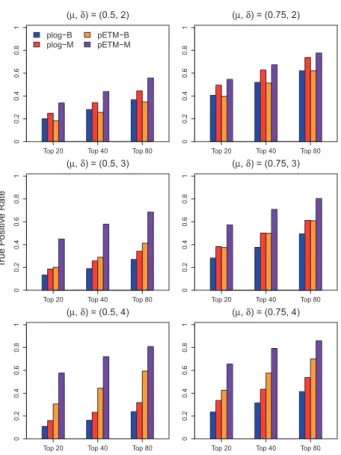
Figure 2presents results from the scenario when there are both
mean and variance differences between case and control groups. The three plots in the left column display the true positive rates of
the four comparing methods when the mean difference isl¼0:5
and the variance ratio isd¼2;3 and 4. The three plots in the right column display the true positive rates of the four comparing
methods when the mean difference is l¼0:75 and the variance
ratio isd¼2;3 and 4. Similar patterns can be observed as those in Figure 1. The proposed pETM method has a better selection per-formance than that of the comparing plog method when there are both mean and variance signals. When comparing results using
methylation b-values and M-values, both the proposed pETM
method and the plog method have higher true positive rates using
methylation M-values, which is consistent with the findings in
Zhuanget al.(2012). Therefore, in real data application, we will
apply pETM on transformed methylation M-values.
In our simulation studies, data was first generated from a multi-variate normal distribution to control for mean differences or vari-ance ratios between case and control groups. We then transformed
the Gaussian data (M-values) intob-values using the inverse of a
logistic function multiplying by 1=log 2. Although we chose the par-ameter values in the multivariate normal distribution to simulate
M-values so that the transformed methylationbeta-values have an
enriched ‘0’ (unmethylated) and enriched ‘1’ (completely methy-lated) as observed in real methylation data and simulated in our pre-vious work (Sun and Wang, 2012), we acknowledge that for the
comparison of the two versions of the pETM model (forb-values
and M-values), this may unfairly favor the version for M-values. Also, we found that the mean signal and variance signal may not be completely separated due to the transformation. For example, if only mean signals are designed in the M-values, there will be both
mean and variance signals inb-values after the transformation. We
conducted additional simulation studies to investigate these associ-ation due to the transformassoci-ation and included simulassoci-ation results in Supplementary Materials Figures S1–S4.
Although results from hypothesis testing and variable selection are difficult to compare, we conducted additional simulation studies to compare the performance of the pETM method with that of uni-variate analysis with two-sample t-test for mean differences and F-test for variance differences. We ranked genome-wide CpG sites
Top 20 Top 40 Top 80
0
0.2
0.4
0.6
0.8
1
plog−B plog−M
pETM−B pETM−M
(μ,δ) = (0.5, 1)
Top 20 Top 40 Top 80
00
.2
0
.4
0.6
0.8
1
(μ,δ) = (0, 2)
Top 20 Top 40 Top 80
0
0
.2
0.4
0
.6
0.8
1
(μ,δ) = (0.75, 1)
Top 20 Top 40 Top 80
0
0
.2
0.4
0
.6
0.8
1
(μ,δ) = (0, 3)
Top 20 Top 40 Top 80
0
0.2
0.4
0.6
0.8
1
(μ,δ) = (1, 1)
Top 20 Top 40 Top 80
0
0
.2
0.4
0
.6
0.8
1
(μ,δ) = (0, 4)
T
rue P
o
sitiv
e
Rate
Fig. 1.Averaged true positive rates of the top ranked 20, 40 and 80 CpG sites selected by the plog method using methylationb-values (plog-B), the plog method using methylation M-values (plog-M), the pETM method using methy-lationb-values (pETM-B) and the pETM method using methylation M-values (pETM-M) are displayed whenlanddare different between case and control groups (Color version of this figure is available atBioinformaticsonline.)
byp-values from the t-test or F-test and selected the same number of top ranked CpG sites byp-values and by selection probabilities from the pETM model and compared the true positive rates. As the pETM model (1) takes correlations among CpG sites into account, and (2) considers both mean and variance signals in DNA methyla-tion data, we also adapted the existing lasso and elastic-net methods (which do not consider correlations) adding variance terms and named them as lasso-var and enet-var and compared their perform-ance to that of the pETM model to examine the contribution of con-sidering correlation patterns when both mean and variance signals are used.
In this simulation study comparing performance of the two uni-variate methods and lasso-var and enet-var to that of the pETM method, we considered different effect sizes in means and variances. Specifically, for all 20 causal CpG sites,ljwas randomly generated
from a uniform distribution U(0,1) anddjwas randomly generated
from a uniform distribution either U(1,1.5) which is considered as small effect size or U(1,2) which is considered as moderate effect size. We also considered different number of selected top ranked
CpG sites and two different samples sizes n¼100 and 200. We
examined the true positive rates of the five comparing methods and summarized results in Supplementary Materials Figure S5. We no-tice that only when the number of selected top ranked sites is small (<100), sample size is small (sample size¼100) and effect size is small, the univariate t-test or F-test has a better performance than that of the proposed pETM method. In all other scenarios, the pETM method performs better. In all scenarios considered, pETM
has a better performance than that of lasso-var and enet-var methods.
4 Real data applications
We applied the proposed pETM method to the 450K DNA methyla-tion array data of the four BRCA cancer subtypes from TCGA and the 27K DNA methylation data from a case control study with ovar-ian cancer patients and healthy controls to which we previously applied the plog method (Sun and Wang, 2012). We transformed
methylationb-values into M-values as suggested by our simulation
studies.
The original TCGA BRCA data has DNA methylation measures on 485 577 CpG sites for 797 tumor samples and 97 normal sam-ples, among which there are breast cancer subtype information for 192 tumor samples. Within the 192 tumor samples, 31 are the Basal-like subtype, 12 are the Her2 subtype, 99 are the LumA sub-type, 45 are the LumB subtype and 5 are the Normal-like subtype. In addition, 59 out of the 97 normal samples are from independent subjects from the 192 tumor samples. Thus after further excluding the 5 normal-like tumor samples, we ended up with 187 tumor sam-ples and 59 independent normal samsam-ples forming a dataset with a case-control design. We then conducted standard quality control steps where we removed sites on sex chromosomes and sites overlap with known single nucleotide polymorphisms (SNPs). We also removed sites with missing values, and ended up with 317 487 CpG sites over 19 296 genes for 187 tumor samples and 59 independent normal samples. We then corrected for the type I/II probe bias using the ‘wateRmelon’ package (Pidsleyet al., 2013).
For each BRCA subtype, we summarized the top ranked 500 CpG sites based on the selection probabilities using the proposed pETM method and the plog method. We plotted the overlapping sites selected by both methods and the unique sites selected by either pETM only or plog only using a Venn diagram. This comparison en-sures a fair comparison because there are equal number of sites uniquely identified by each method. We then plotted the sample standard deviation (SD) ratios against the scaled sample mean differ-ences for the overlapping sites and the uniquely selected sites
separ-ately, where the scaled sample mean difference at thejth CpG site
was computed as
m1Pm
i¼1xij ðnmÞ1Pni¼mþ1xij
ffiffiffiffiffiffiffiffiffiffiffiffiffiffiffiffiffiffiffiffiffiffiffiffiffiffiffiffiffiffiffiffiffiffiffiffiffiffiffiffiffiffiffiffiffiffiffiffiffiffiffiffi
ðn1Þ1Pni¼1ðxijxÞ2
q ;
where the firstmobservations are cases and the othern–m observa-tions are controls, andx¼n1Pn
j¼1xij.
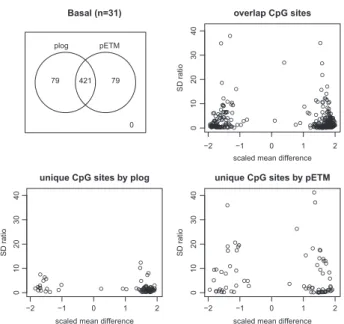
InFigure 3, the Venn diagram and the plots of SD ratios and
scaled mean differences of CpG sites that were detected by pETM and plog for the Basal-like subtypes are displayed. We can see that 421 sites out of the top ranked 500 sites were selected by both meth-ods. The plots of SD ratios against mean differences show that sites selected by pETM only have large SD ratios in general, while sites selected by plog only have smaller SD ratios. On the other hand, the scaled mean differences of the top ranked 500 sites are quite similar, with the scaled mean differences of sites uniquely selected by pETM slightly smaller than those of sites uniquely selected by plog. Further investigation found that the 79 sites uniquely selected by pETM are from 74 genes, among which 68 genes are not overlapping with uniquely selected sites by plog. We thus further investigated the top 10 genes out of the 68 genes uniquely selected by pETM and found that 7 genes were reported to be associated with cancers:
Top 20 Top 40 Top 80
0
0.2
0.4
0.6
0.8
1
plog−B plog−M
pETM−B pETM−M
(μ,δ) = (0.5, 2)
Top 20 Top 40 Top 80
00
.2
0
.4
0.6
0.8
1
(μ,δ) = (0.75, 2)
Top 20 Top 40 Top 80
0
0
.2
0.4
0
.6
0.8
1
(μ,δ) = (0.5, 3)
Top 20 Top 40 Top 80
0
0
.2
0.4
0
.6
0.8
1
(μ,δ) = (0.75, 3)
Top 20 Top 40 Top 80
0
0.2
0.4
0.6
0.8
1
(μ,δ) = (0.5, 4)
Top 20 Top 40 Top 80
0
0
.2
0.4
0
.6
0.8
1
(μ,δ) = (0.75, 4)
T
rue P
o
sitiv
e
Rate
Fig. 2.Averaged true positive rates of the top ranked 20, 40 and 80 CpG sites selected by the plog method using methylationb-values (plog-B), the plog method using methylation M-values (plog-M), the pETM method using methy-lationb-values (pETM-B) and the pETM method using methylation M-values (pETM-M) are displayed whenlanddare different between case and control groups (Color version of this figure is available atBioinformaticsonline.)
HIST1H2BJ(Joosseet al., 2011), TRIM72(Fuentes-Matteiet al.,
2014) andPCDHB15 (Zhanget al., 2015a) were reported to be
associated with breast cancer; R3HDM2 (Wang et al., 2009),
PTPRN2(Anglimet al., 2008),C3orf21(Yoonet al., 2010) and VGLL4(Zhanget al., 2014) were reported to be associated with
lung cancer; andVGLL4(Liet al., 2015) was reported to be
associ-ated with gastric cancer.
The Venn diagram and the plots of SD ratios and scaled mean dif-ferences for the other three subtypes, Her2, LumA and LumB are given in Supplementary Figures S6, S7 and S8 in Supplementary Materials, respectively. For the Her2 subtype, 391 sites were selected by both methods. The plots of SD ratios against the scaled mean differences for overlapping sites and uniquely selected sites are slightly different from those for the Basal-like subtype, where the variation of SD ratios of sites uniquely selected by pETM are not very different from those of sites uniquely selected by plog. One possible explanation is the small sample size, where there are only 12 Her2 subtypes. We similarly investigated the top 10 genes out of the 94 genes uniquely selected by pETM from 109 uniquely selected sites and found that 9 genes were reported to be associated with cancers:CLTC(P€arssinenet al., 2007) andNSD1(Stephenset al., 2009) were reported to be associated with
breast cancer; SLC25A2 (Motamedian et al., 2015) and ESRRA
(Micciet al., 2014) were reported to be associated with ovarian cancer;
FSD1(Yamashita et al., 2006) and CREB3L3 (Wichmann et al.,
2015) were reported to be associated with gastric cancer;CARD14
(Oudeset al., 2005) was reported to be associated with prostate can-cer;LRRFIP1(Ariakeet al., 2012) was reported to be associated with
colorectal cancer; andPARD3was reported to be associated with both
esophageal squamous cell carcinoma (Zenet al., 2009) and lung squa-mous cell carcinomas (Bonastreet al., 2015).
For the LumA subtype, 389 sites were selected by both methods. Similar patterns can be observed in the plots of SD ratios against the scaled mean differences for overlapping sites and uniquely selected sites as for the Basal-like subtype. Similarly, we further investigated the top 10 genes out of the 91 genes uniquely selected by pETM from
the 111 uniquely selected sites. We found that 9 genes were reported
to be associated with cancers: ZNF536 (Zhang et al., 2015b),
LOC399959(Chenet al., 2015) andTOX(Tessema et al., 2012)
were reported to be associated with breast cancer; FAM171A1
(Mullapudiet al., 2015) was reported to be associated with lung can-cer;RBMS3was reported to be associated with both esophageal
squa-mous cell carcinoma (Liet al., 2011) and nasopharyngeal carcinoma
(Chenet al., 2012);OR5B12(Gandhiet al., 2015) was also reported
to be associated with hepatocellular carcinoma; EGFLAM (Dong
et al., 2014) was reported to be associated with ovarian cancer; PRRX1(Leeet al., 2015) was reported to be associated with cervical
cancer; andBMP2(Tokumaruet al., 2004) was reported to be
associ-ated with head and neck squamous cell carcinoma.
For the LumB subtype, 415 sites were selected by both methods. Again, similar patterns can be observed in the plots of SD ratios against the scaled mean differences for overlapping sites and uniquely selected sites as for the Basal-like subtype and in the LumA subtype. The further investigation of the top 10 genes out of the 79 genes uniquely selected by pETM from the 85 uniquely selected site found
that 9 genes were reported to be associated with cancers:SORBS1
(Hickset al., 2011) andCDH13(Moelanset al., 2011) were reported to be associated with breast cancer;BCL9L(Steget al., 2012) was re-ported to be associated with ovarian cancer;TTBK1(Langevinet al.,
2015) was reported to be associated with lung cancer;A2BP1(Chung
et al., 2011) was also reported to be associated with bladder cancer; AAK1(Guoet al., 2011) andABHD2(Chenet al., 2006) were
re-ported to be associated with gastric cancer;GPR75(Ashktorab and
Brim, 2014) was reported to be associated with colorectal cancer; RASSF5(Djoset al., 2012) was reported to be associated with
neuro-blastoma; andABHD2was also reported to be associated with
hepa-tocellular carcinoma and colon cancer (Chenet al., 2006).
In our earlier article, we applied the plog method to ovarian can-cer 27K methylation data (Sun and Wang, 2012). For comparison purposes, here we applied both pETM and plog methods to the ovarian cancer data and investigated top ranked 50 CpG sites se-lected by both methods based on selection probabilities. There are 60 distinct CpG sites from the two top 50 lists using the two meth-ods, among which, 40 CpG sites overlap, and 10 sites were uniquely identified by each method. For the 40 overlapping CpG sites, the scaled mean differences range from –1.005 to 0.880, and the SD ratios range from 0.806 to 1.680. This indicates that both the pro-posed pETM method and plog method can identify CpG sites that have relatively large mean differences between cases and controls. The 10 CpG sites uniquely identified by the plog method have rela-tively smaller mean differences comparing to the 40 overlapping sites with the scaled mean differences ranging0:6220:774, and
SD ratios ranging 0.988 1.696). In contrast, the 10 CpG sites
uniquely identified by the pETM method have larger SD ratio with
the scaled mean differences ranging0:9640:892, and SD ratios
ranging 0.8894.230. One CpG site, ‘cg02331561’, has the scaled
mean difference of 0.0162 but SD ratio of 4.23. Therefore, it could not be identified by the plog method. This CpG site is in gene ABCA3, which is a known cancer-related gene according to the human protein atlas (http://www.proteinatlas.org/) and has been
re-ported to be associated with some cancers (Januchowski et al.,
2014;Yasuiet al., 2004).
5 Discussion
In this article, we proposed a penalized exponential tilt model (pETM) to identify differentially methylated sites for analysis of plog pETM 0 79 79 421 Basal (n=31) ● ● ● ● ● ● ● ●● ● ● ● ● ● ● ● ● ● ● ● ●● ● ●● ●●●●●● ●●●● ●●●●●●●●● ● ● ● ●●● ● ●● ●● ● ● ● ● ●●● ● ● ● ● ●●●● ● ● ● ● ● ● ●● ● ● ● ● ●● ● ● ●●● ● ● ● ● ● ● ● ●●● ● ● ●●●●●● ● ● ● ●● ● ● ● ● ● ●● ● ● ● ● ● ●● ● ● ● ● ● ● ● ● ●● ● ● ● ● ● ●● ● ● ● ●●● ● ●●● ●●●●●● ● ● ● ● ● ● ● ●● ● ●●●●● ● ● ●●●●● ● ● ● ● ● ● ● ● ● ● ● ● ●● ● ● ●●●●●●●● ● ● ● ● ● ● ●● ● ● ● ● ● ● ● ● ● ●● ● ● ● ● ● ● ●● ● ● ● ● ● ● ● ● ●●● ● ● ●●●●● ● ● ● ● ● ● ● ● ● ● ● ● ● ● ● ●●●● ● ●● ● ●●● ● ● ● ● ●● ●●●● ●● ●●● ● ● ● ●●● ● ● ● ● ● ● ● ● ● ● ● ● ●●●●●● ● ● ● ● ●●●●● ● ● ● ●● ● ● ●●● ●●● ● ● ●● ● ● ● ● ● ● ● ● ●●●●●● ● ● ● ● ● ● ● ●●●● ● ● ● ● ● ●● ● ● ● ● ● ● ● ● ● ● ● ●●● ● ● ●●● ● ● ● ●● ●●● ● ●●● ● ● ● ● ●●● ● ● ● ● ● ● ● ● ● ●
−2 −1 0 1 2
01 0 2 0 3 0 4 0
overlap CpG sites
scaled mean difference
SD r a tio ● ● ●●●●●●●● ● ● ● ● ● ● ● ●●●● ● ● ● ● ● ● ● ● ● ●● ● ●● ● ● ● ●● ● ●●● ●●● ●●●●●●●●● ● ● ● ● ● ● ● ● ● ● ● ● ●● ● ● ● ● ● ● ● ● ●
−2 −1 0 1 2
0
10
20
30
40
unique CpG sites by plog
scaled mean difference
SD r a tio ● ● ● ● ● ● ● ● ● ● ● ● ● ● ● ● ● ● ● ● ● ● ● ● ● ● ● ● ● ● ● ● ● ● ●●●● ● ● ● ● ● ● ● ● ● ● ● ● ● ● ● ● ● ● ● ● ● ● ● ● ● ● ● ● ● ● ● ●●● ● ● ● ● ● ● ●
−2 −1 0 1 2
0 1 02 03 04 0
unique CpG sites by pETM
scaled mean difference
SD r
a
tio
Fig. 3.For the BRCA Basal-like cancer subtype, the top ranked 500 sites se-lected by the pETM and plog methods are summarized in the Venn diagram in the top-left panel. Scaled mean differences and SD ratios of sites selected by both methods are shown in the top-right panel. Scaled mean differences and SD ratios of sites uniquely selected by either plog or pETM are shown in the bottom-left panel or the bottom-right panel, respectively
high-dimensional DNA methylation data that considers both mean and variance signals when correlations among CpG sites in a gene or a genetic region are taken into account. Although the model formu-lation of pETM is similar to our previous work (Sun and Wang, 2012), the new pETM method incorporates the nice features of the generalized exponential tilt model (ETM) when different types of kernel functions can be employed to capture variance signals and higher order signals. Simulation studies demonstrated the superior performance of the proposed pETM method when there are both mean and variance signals or only variance signals comparing to that of our previously developed penalized logistic regression (plog) method that considers correlations among CpG sites in a gene or a genetic region but ignores variance signals. When there are only mean signals in DNA methylation data, the proposed pETM method might be slightly underpowered comparing to the plog method.
The proposed pETM method uses the Laplacian matrix for network-based regularization where we used the ring and the fully connected network graphs for correlated CpG sites with a gene. It is possible that CpG sites from different genes of the same pathway are also correlated. However, to consider correlations both ‘between gene levels’, and ‘within gene levels’ is very challenging and could be a separate research topic that deserves full attention.
We currently used the Laplacian matrix with 0/1 to represent existing/not-existing links between CpGs in a gene for the network-based regularization to reflect the network structure among CpGs. However, correlations among nearby CpG sites may decrease as dis-tances between sites increase, i.e. spatial correlations may exist. In this case, a weighted Laplacian matrix may capture this spatial cor-relation. Our past experience with weighted Laplacian matrix sug-gests a minimum improvement in variable selection performance over 0/1 connections. However, this deserves further investigation in future work.
With the pETM method, we selected top ranked CpG sites by se-lection probabilities for further investigation. Although there is no theoretical justification on how many top ranked CpGs sites should be selected, we recommend to further investigate CpG sites that are selected in at least 60% of the resamplings, i.e. sites with selection
probability>60% based on our experience. We developed the
pETM method for a case-control design with high-dimensional DNA methylation data. It can be readily extended to other types of study designs. In DNA methylation studies, a matched case-control design with methylation data from tumor and adjacent normal tis-sues is commonly used. For matched case-control designs, a penal-ized exponential tilt model for conditional logistic regression can be adapted and developed. The R package ’pETM’ implementing the developed pETM method is available through CRAN.
Funding
Dr. Hokeun Sun was supported by Basic Science Research Program through the National Research Foundation of Korea (NRF) funded by the Ministry of Education (NRF-2016R1D1A1B03930218). Dr. Yun Li was supported by re-search grants NIH-R01HG006292 and NIH-R01HL129132.
Conflict of Interest: none declared.
References
Anglim,P.et al. (2008) Identification of a panel of sensitive and specific DNA methylation markers for squamous cell lung cancer.Mol. Cancer,7, 62.
Ariake,K.et al. (2012) GCF2/LRRFIP1 promotes colorectal cancer metastasis
and liver invasion through integrin-dependent RhoA activation. Cancer
Lett.,325, 99–107.
Ashktorab,H. and Brim,H. (2014) Dna methylation and colorectal cancer.
Curr. Colorectal. Cancer Rep.,10, 425–430.
Baylin,S. and Ohm,J. (2006) Epigenetic gene silencing in cancer – a mechanism for early oncogenic pathway addiction.Nat. Rev. Cancer,6, 107–116.
Bonastre,E.et al. (2015) PARD3 inactivation in lung squamous cell
carcin-omas impairs STAT3 and promotes malignant invasion.Cancer Res.,75,
1287–1297.
Chen,J.et al. (2012) RBMS3 at 3p24 inhibits nasopharyngeal carcinoma
de-velopment via inhibiting cell proliferation, angiogenesis, and inducing apop-tosis.PLoS One,7, e44636.
Chen,W.et al. (2015) Analyzing the differentially expressed genes and path-way cross-talk in aggressive breast cancer.J. Obstet. Gynaecol. Res.,41, 132–140.
Chen,Y.et al. (2006) Elevated expression and potential roles of human Sp5, a
member of Sp transcription factor family, in human cancers.Biochem.
Biophys. Res. Commun.,340, 758–766.
Chen,Y. et al. (2014) Semiparametric tests for identifying differentially
methylated loci with case-control designs using Illumina arrays.Genet.
Epidemiol.,38, 42–50.
Chung,W.et al. (2011) Detection of bladder cancer using novel DNA
methyla-tion biomarkers in urine sediments.Cancer. Epidemiol. Biomarkers Prev.,
20, 1483–1491.
Djos,A.et al. (2012) The RASSF gene family members RASSF5, RASSF6 and
RASSF7 show frequent DNA methylation in neuroblastoma.Mol. Cancer,
11, 40.
Dong,X.et al. (2014) Advances in tumor markers of ovarian cancer for early
diagnosis.Indian J. Cancer,51, 72–76.
Friedman,J.et al. (2010) Regularization paths for generalized linear models via coordinate descent.J. Stat. Softw.,33, 1–22.
Fuentes-Mattei,E.et al. (2014) Effects of obesity on transcriptomic changes
and cancer hallmarks in estrogen receptorpositive breast cancer.J. Natl.
Cancer Inst.,106, dju158.
Gandhi,D.et al. (2015) An integrated genomic and proteomic approach to
identify signatures of endosulfan exposure in hepatocellular carcinoma cells.
Pestic. Biochem. Physiol.,125, 8–16.
Guo,T.et al. (2011) Global molecular dysfunctions in gastric cancer revealed
by an integrated analysis of the phosphoproteome and transcriptome.Cell.
Mol. Life Sci.,68, 1983–2002.
Hansen,K.et al. (2011) Increased methylation variation in epigenetic domains across cancer types.Nat. Genet.,43, 768–775.
Hicks,C.et al. (2011) An integrative genomics approach to biomarker discov-ery in breast cancer.Cancer Inform.,10, 185–204.
Januchowski,R. et al. (2014) Drug transporter expression profiling in
chemoresistant variants of the A2780 ovarian cancer cell line. Biomed.
Pharmacother.,68, 447–453.
Jiao,Y.et al. (2014) A systems-level integrative framework for genome-wide
DNA methylation and gene expression data identifies differential gene ex-pression modules under epigenetic control.Bioinformatics,30, 2360–2366. Jones,P. and Baylin,S. (2002) The fundamental role of epigenetic events in
can-cer.Nat. Rev. Genet.,3, 415–428.
Joosse,S.et al. (2011) Genomic signature of BRCA1 deficiency in sporadic
basal-like breast tumors.Genes Chromosomes Cancer,50, 71–81.
Langevin,S.et al. (2015) Epigenetics of lung cancer.Transl. Res.,165, 74–90. Lee,H.et al. (2015) Identification of differentially expressed genes by DNA
methylation in cervical cancer.Oncol. Lett.,9, 1691–1698.
Li,C. and Li,H. (2010) Variable selection and regression analysis for covariates
with a graphical structure with an application to genomics.Ann. Appl.
Stat.,4, 1498–1516.
Li,H.et al. (2015) VGLL4 inhibits EMT in part through suppressing Wnt/
b-catenin signaling pathway in gastric cancer.Med. Oncol.,32, 83. Li,Y.et al. (2011) Downregulation of RBMS3 is associated with poor
progno-sis in esophageal squamous cell carcinoma.Cancer Res.,71, 6106–6115. Marsit,C.et al. (2009) Epigenetic profiling reveals etiologically distinct
pat-terns of DNA methylation in head and neck squamous cell carcinoma.
Carcinogenesis,30, 416–422.
Meinshausen,N. and Bu¨hlmann,P. (2010) Stability selection.J. R. Stat. Soc. B,
72, 417–473.
Micci,F.et al. (2014) Low frequency of ESRRAC11orf20 fusion gene in ovar-ian carcinomas.PLoS Biol.,12, e1001784.
Moelans,C.et al. (2011) Frequent promoter hypermethylation of BRCA2,
CDH13, MSH6, PAX5, PAX6 and WT1 in ductal carcinoma in situ and in-vasive breast cancer.J. Pathol.,225, 222–231.
Motamedian,E.et al. (2015) Investigation on metabolism of cisplatin resistant ovarian cancer using a genome scale metabolic model and microarray data.
Iran. J. Basic Med. Sci.,18, 267–276.
Mullapudi,N.et al. (2015) Genome wide methylome alterations in lung
can-cer.PLoS One,10, e0143826.
Oudes,A.et al. (2005) Application of Affymetrix array and massively parallel signature sequencing for identification of genes involved in prostate cancer progression.BMC Cancer,5, 86.
P€arssinen,J.et al. (2007) High-level amplification at 17q23 leads to
coordi-nated overexpression of multiple adjacent genes in breast cancer. Br. J.
Cancer,96, 1258–1264.
Pidsley,R.et al. (2013) A data-driven approach to preprocessing Illumina
450k methylation array data.BMC Genomics,14, 293.
Qin,J. (1998) Inferences for case-control and semiparametric two-sample density ratio models.Biometrika,85, 619–630.
Ruan,P.et al. (2016) NEpiC: a network-assisted algorithm for epigenetic stud-ies using mean and variance combined signals.Nucleic Acids Res., gkw546. Shen,J.et al. (2013) Exploring genome-wide DNA methylation profiles altered in hepatocellular carcinoma using infinium HumanMethylation 450 BeadChips.Epigenetics,8, 34–43.
Simon,N.et al. (2011) Regularization paths for Cox’s proportional hazards
model via coordinate descent.J. Stat. Softw.,39, 1–13.
Steg,A.et al. (2012) Stem cell pathways contribute to clinical chemoresistance in ovarian cancer.Clin. Cancer Res.,18, 869–881.
Stephens,P.et al. (2009) Complex landscapes of somatic rearrangement in
human breast cancer genomes.Nature,462, 1005–1010.
Sun,H. and Wang,S. (2012) Penalized logistic regression for high-dimensional
DNA methylation data analysis with case-control studies.Bioinformatics,
28, 1368–1375.
Sun,H. and Wang,S. (2013) Network-based regularization for matched case– control analysis of high-dimensional DNA methylation data.Stat. Med.,32, 2127–2139.
Sun,H.et al. (2014) Network-regularized high dimensional Cox regression for analysis of genomic data.Stat. Sin.,24, 1433–1459.
Teschendorff,A. and Widschwendter,M. (2012) Differential variability im-proves the identification of cancer risk markers in DNA methylation studies profiling precursor cancer lesions.Bioinformatics,28, 1487–1494.
Teschendorff,A.et al. (2014) The dynamics of dna methylation covariation
patterns in carcinogenesis.PLoS Comput. Biol.,10, e1003709.
Tessema,M.et al. (2012) Differential epigenetic regulation of TOX subfamily
high mobility group box genes in lung and breast cancers.PLoS One,7,
e34850.
Tokumaru,Y.et al. (2004) Inverse correlation between cyclin A1 hypermethy-lation and p53 mutation in head and neck cancer identified by reversal of epigenetic silencing.Cancer. Res.,64, 5982–5987.
Wang,X.et al. (2009) An integrative approach to reveal driver gene fusions from paired-end sequencing data in cancer.Nat. Biotechnol.,27, 1005–1011.
West,J. et al. (2013) An integrative network algorithm identifies
age-associated differential methylation interactome hotspots targeting stem-cell differentiation pathways.Sci. Rep.,3, 1630.
Wichmann,I.et al. (2015) Identification of novel upregulated microRNAs in
the pathogenesis of gastric cancer by the use of open access databases and bioinformatics tools.J. Clin. Oncol.,33, abstr 15.
Yamashita,S.et al. (2006) Chemical genomic screening for
methylation-silenced genes in gastric cancer cell lines using 5-aza-2’-deoxycytidine treat-ment and oligonucleotide microarray.Cancer Sci.,97, 64–71.
Yasui,K.et al. (2004) Alteration in copy numbers of genes as a mechanism for acquired drug resistance.Cancer Res.,64, 1403–1410.
Yoon,K.et al. (2010) A genome-wide association study reveals susceptibility
variants for non-small cell lung cancer in the Korean population.Hum.
Mol. Genet.,19, 4948–4954.
Zen,K.et al. (2009) Defective expression of polarity protein PAR-3 gene
(PARD3) in esophageal squamous cell carcinoma.Oncogene,28, 2910–2918.
Zhang,C.et al. (2015a) The identification of specific methylation patterns
across different cancers.PLoS One,10, e0120361.
Zhang,M.et al. (2015b) DNA methylation patterns can estimate
nonequiva-lent outcomes of breast cancer with the same receptor subtypes.PLoS One,
10, e0142279.
Zhang,W.et al. (2014) VGLL4 functions as a new tumor suppressor in lung
cancer by negatively regulating the YAP-TEAD transcriptional complex.
Cell Res.,24, 331–343.
Zhuang,J.et al. (2012) A comparison of feature selection and classification methods in DNA methylation studies using the Illumina Infinium platform.
BMC Bioinformatics,13, 1471–2105.