KNOWLEDGE, SCIENCE, AND RELIGION IN THE UNITED STATES: AN ANALYSIS OF FACTORS THAT CONTRIBUTE TO ACCEPTANCE AND REJECTION OF CONTESTED
KNOWLEDGE AT THE INTERSECTION OF SCIENCE AND RELIGION.
J. Micah Roos
A dissertation submitted to the faculty at the University of North Carolina at Chapel Hill in partial fulfillment of the requirements for the degree of Doctor of Philosophy in the Department
of Sociology
Chapel Hill 2013
ABSTRACT
J. Micah Roos: Knowledge, Science, And Religion In The United States: An Analysis of Factors That Contribute to Acceptance and Rejection of Contested Knowledge at the Intersection of
Science and Religion.
(Under the direction of Ken Bollen and Andy Perrin)
religious tradition, age, sex, race, and other factors. An additional finding is that relative to unaffiliated respondents, evangelical Protestants and Catholics have an overall lower level of uncontested science knowledge. A fourth chapter examines the persistence of RSO and examines whether there is a downward, upward, or stable trend in individuals’ RSO. Additionally, this chapter tests three models representing the relationship between RSO and religious attendance, where: (1) RSO is specified to influence religious attendance, (2) religious attendance is
ACKNOWLEDGEMENTS
Like many dissertations, I would have been unable to complete this one without the help and support of many people. I would like to thank my advisors, Ken Bollen and Andy Perrin - Both have been mentors, colleagues, and friends and helped me move from an idea to a
dissertation. Francois Nielsen has also been a mentor and collaborator over the last several years. Additional committee members Lisa Pearce and Neal Caren have provided invaluable advice, comments, and intellectual support. Among the faculty of the University of North Carolina at Chapel Hill Department of Sociology, Mike Shanahan provided financial support for a number of years while I was learning how to be a researcher, and Charlie Kurzman has provided valuable advice during my years at UNC.
TABLE OF CONTENTS
LIST OF TABLES ... xi
LIST OF FIGURES ... xiii
LIST OF ABBREVIATIONS ... xiv
CHAPTER I: INTRODUCTION ... 1
1 - Introduction ... 1
2 - Religion and Disparities in Science Knowledge ... 3
3 - Theoretical Foundation ... 4
Contested and uncontested science knowledge ... 4
4 - Contributions ... 6
5 - Structure of this Volume ... 7
CHAPTER II: MEASURING SCIENCE OR RELIGION? A MEASUREMENT ANALYSIS OF THE NSF SPONSORED SCIENCE LITERACY SCALE 2006-2010 ... 10
1 - Introduction ... 10
2 - Background ... 15
3 - Specific Hypotheses ... 17
4 - Data and Methods ... 19
5 - Results ... 20
Test of models on subsequent waves ... 27
6 - Discussion ... 28
CHAPTER III: CONTESTED KNOWLEDGE: COMPETING TRUTH CLAIMS
AT THE INTERSECTION OF SCIENCE AND RELIGION ... 35
1 - Introduction ... 35
2 - Background ... 37
Public Understanding of Science ... 37
Science and Religion ... 39
Contested Knowledge ... 41
Spillover ... 43
Rejection of Scientific Orthodoxy (RSO) ... 44
3 - Specific Research Questions ... 47
4 - Data and Methods ... 49
Data ... 49
Outcome Variables ... 49
Intervening Variables ... 51
Exogenous Variables ... 52
Measurement Model ... 53
Full Structural Models ... 55
5 - Results ... 57
Model Fit ... 57
Sensitivity Analyses ... 62
6 - Discussion ... 64
AREA FROM 2006-2010 ... 68
1 - Introduction ... 68
2 - Background ... 72
Science, Religion, and Origins ... 72
Rejection of Scientific Orthodoxy (RSO) ... 73
Religious Attendance ... 75
Religious Identity and Cultural Dispositions ... 77
3 - Data, Methods, and Measures ... 79
Latent Curve Models ... 79
4 - Models ... 81
Basic RSO Measurement Model ... 81
Religious Attendance ... 84
Latent Curve Models (LCM) A, B and C ... 84
Model Arbitration ... 87
5 - Model C with covariates ... 88
Covariates ... 88
Parameter Estimates ... 91
6 - Sensitivity Analyses ... 93
7 - Discussion ... 95
Limitations ... 97
Conclusions ... 97
CHAPTER V: CONCLUSIONS ... 100
1 - Disparities in Science Knowledge ... 100
5 - General Conclusions ... 106
6 - Limitations and Future Research ... 108
APPENDIX ONE: MEASURES OF MODEL FIT ... 110
APPENDIX TWO: ALTERNATE MODELS FROM CHAPTER TWO ... 112
Additional Science Knowledge Indicators ... 112
Denominational Affiliation ... 112
Additional items from the GSS: “Astrosci” and “scistudy” ... 114
Models D, E, and F with “bible” added to YEW ... 119
APPENDIX THREE: ALTERNATE QUESTION WORDINGS IN 2012 ... 121
Table 1: NSF science knowledge scale questions with GSS variable names ... 13
Table 2: Descriptive statistics: Number of cases and percent correct for NSF science knowledge items in each wave of GSS ... 20
Table 3: Models estimated with first half of 2006 sample and tested on subsequent samples ... 21
Table 4: Comparison of models D and E with the bible variable added ... 25
Table 5: Descriptive statistics for RSO indicators ... 51
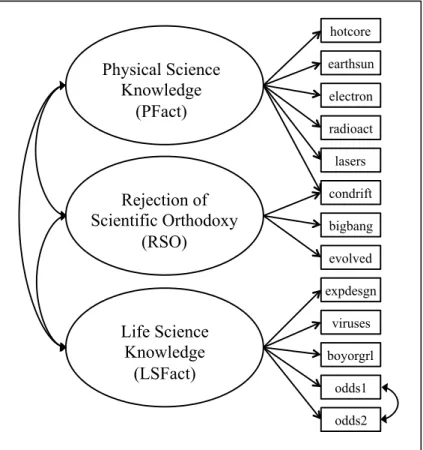
Table 6: Parameter estimates from full structural model (outcome variables and RSO) ... 58
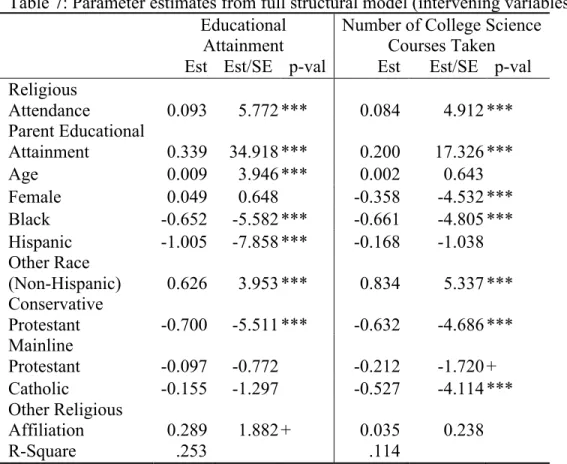
Table 7: Parameter estimates from full structural model (intervening variables) ... 60
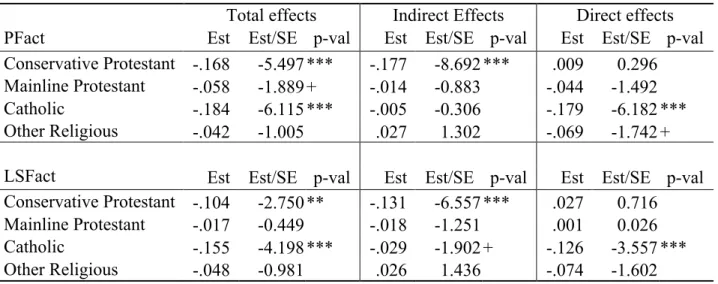
Table 8: Total (direct and indirect) effects of religious tradition variables on science knowledge from the full model ... 61
Table 9: Multiple Group Analysis (MGA) results for full model, groups are GSS waves 2006, 2008, 2010, and 2012 ... 63
Table 10: RSO indicators ... 83
Table 11: Religious Attendance frequencies, from 2006 time point of 2006-2010 GSS panel ... 84
Table 12: Model fit statistics ... 87
Table 13: Parameter estimates for bivariate latent curve model with time invariant covariates ... 91
Table 14: Model Fit, alternate models from Chapter 2 ... 113
Table 15: Item wordings for “scistudy”, “scitext”, and “astrosci” indicators from the GSS ... 115
Table 16: Additional Models from Chapter 1: “astrosci” and “scistudy” ... 116
Table 17: Model Z with “bible” indicator added ... 118
Table 21: Factor loadings for indicators for Model E, from 1st half of 2006
Figure 1: Science Knowledge from 2006 GSS (Model E). Three dimensions:
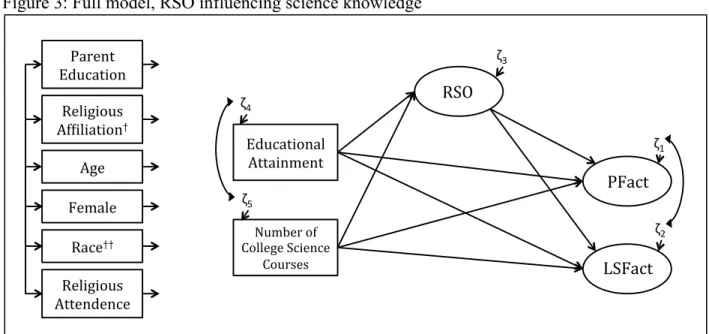
Life sciences, Physical sciences, and Young Earth Worldview ... 18 Figure 2: Measurement model for RSO and science knowledge ... 55 Figure 3: Full model, RSO influencing science knowledge ... 56 Figure 4: Indirect effect of Conservative Protestant affiliation on Physical
sciences knowledge, through RSO ... 62 Figure 5: Measurement model for RSO, using only the GSS 2006 time point ... 82 Figure 6: Measurement model structure for RSO across three time points
BIC Beyesian Information Criterion CFA Confirmatory Factor Analysis
CFI Comparitive Fit Index
GSS General Social Survey
LCM Latent Curve Models
LSFact Life Sciences fact-based knowledge NSF National Science Foundation
Origins The knowledge area explaining the origin of life, the source of life’s complexity and variation, and the origins of the universe PFact Physical Sciences fact-based knowledge
RMSEA Root Mean Square Error Approximation RSO Rejection of Scientific Orthodoxy SBIC Schwarz Beyesian Information Criterion SEM Structural Equation Model
SKFact Science Fact-Based Knowledge SKMeth Science Methodological Knowledge
STEM Science, Technology, Engineering, and Mathematics
TLI Tucker-Lewis Index
CHAPTER I: INTRODUCTION 1 - Introduction
The past two centuries has seen an explosion of scientific discovery. In particular,
Linnaean and other theories of evolution were upended following the publication of Darwin’s On the Origin of Species (1859), building on ideas of uniformitarianism1 from Lyell’s Principles of Geology (1830). Since Darwin’s time, the work of Julian Huxley, Stephen Jay Gould, and E. O.
Wilson have refined and expanded his original contribution, and the wealth of our understanding of the processes that contribute to the growing complexity and variation of life has grown
considerably. However, evolution remains a hotly contested set of theories in the general public of the United States, and while our society-level understanding of these processes may be detailed and expansive, at the individual level many US adults either do not understand or vehemently reject these ideas, to the point that various movement organizations press for the introduction of biblical creationism or intelligent design alongside evolution in public school science curricula (Binder 2004, 2007; Forrest and Gross 2004) or the removal of evolution from curricula altogether.
More generally, trust in science as an institution has been on the decline among certain groups (political conservatives, in particular), and science more generally may be undergoing a “legitimacy problem” (Gauchat 2010, 2012). Lack of trust in the scientific institution is likely
related to scientific knowledge, however, the associations between political conservatism and reduced trust in science that Gauchat discovered do not seem to translate to reduced levels of science knowledge for political conservatives. An investigation of how religion plays a part in general trust in and knowledge of science was beyond the scope of Gauchat’s analyses, and some argue that it is impossible to understand the US general public’s attitudes about science without an eye to religious factors (Ecklund 2010; Ellison and Musick 1995; Evans and Evans 2008; Evans 2013; Sherkat 2011). In the chapters to follow, I will examine the relation of measures of religious identity and science knowledge to better explain disparities in science knowledge in the US general public. The main foci of this dissertation are an investigation of demographic and social factors that contribute to disparities in science knowledge in the United States, as well as the structure of that science knowledge (i.e. the constructs that underlie it). As this dissertation is a part of the academic knowledge enterprise, in it I, as author, take the position that heightened general knowledge and understanding of science is a public good.
There has been some recent scholarship on general trust in science (Gauchat 2010, 2012), the intersection of science and religion in the minds of both practitioners and the general public (Ecklund and Park 2009; Ecklund and Scheitle 2007; Ecklund 2010; Evans and Evans 2008; Evans 2011; Sherkat 2011), as well as work that suggests that the United States may be lagging behind other nations in science education (Miller, Scott, and Okamoto 2006) - and in a recent report from the Programme for International Student Assessment (PISA), the US ranked only 31st out of 65 included countries (OECD 2011) in science literacy among primary and secondary school students.
knowledge about the natural world is generated may be just as critical. Whenever a science policy issue is discussed – be it tied together with moral issues like stem cell research, or business and environmental concerns like global climate change – poor science knowledge may lead to voters making poorly informed choices. What is worse, the uninformed can be easily co-opted for political goals and effectively duped into voting against their own interests due to a poor understanding of the science-related issues under debate. This dissertation aims to examine these disparities in science knowledge in the adult population of the United States.
2 - Religion and Disparities in Science Knowledge
Disparities in science knowledge have several implications. Demographic disparities in science knowledge may help understand the potential science, technology, engineering, and math (STEM) crisis. If the United States is to avoid a STEM worker shortage in the coming decades, identifying which groups are most likely to avoid or be uninterested in science is crucial.
Low overall levels of science knowledge may influence public support for science funding. As the public debate in mid 2013 over the import of political science funding shows, federal science funding is vulnerable to political attack. Those areas that are least understood are more vulnerable. Similarly, areas of scientific inquiry that are under contest (such as
evolutionary biology) are even more vulnerable. It is important to examine rates of
understanding (and acceptance) of these ideas in the general public, as well as how those rates are likely to shift over time to understand how public support for science funding may ebb and flow over the next several decades.
Certain contested areas of scientific knowledge, such as evolution (and related ideas) may have rates of acceptance or understanding that differ from overall general rates of science
unique implications. One, a population with low rates of acceptance of evolution may give rise to more motivated supporters of movements to introduce creationism or intelligent design in school curricula, a key goal of some groups (Forrest and Gross 2004). Additionally, the rejection of evolution in specific and science as an institution more generally may serve as a key form of “collective identity” (Polletta and Jasper 2001) around which social actors may be mobilized towards those goals. And, as the rejection of evolution may be a component of a broad, religious conservative constellation of ideas (Perrin, Roos, and Gauchat Forthcoming), high rates of rejection of evolution and related ideas may contribute to mobilization towards other conservative religious goals in education, such as limited sex education or in-school prayer. 3 - Theoretical Foundation
Contested and uncontested science knowledge
Many areas in science are relatively uncontested – that is, the legitimacy of science as an institution (Gauchat 2010, 2012) is not in question. Gravity, thermodynamics, kinetics,
combustion; many areas in basic physics, chemistry, biology and other sciences are not viewed by the general public (implicitly or explicitly) as in conflict with other sources of knowledge. These uncontested areas yield “facts” that are widely accepted by most in the general public. One such fact is that falling bodies fall at the same rate, regardless of mass (and net of wind
Earth. Uncontested “facts” are not universally so, nor are they necessarily truth. Rather, in the US American case (which is the perspective of this author), there are no competing truth claims.
However, not all areas of scientific discovery are uncontested. Evolution (and related ideas) is one particularly controversial area in science. While Evolution tends to be uncontested among scientific practitioners, particularly those working in closely related areas, it remains hotly debated in the US general public. A sizable minority of the US population rejects the idea that humans evolved from earlier forms (Newport 2012; Plutzer and Berkman 2008), which is evidence that at least one competing truth claim (in addition to that of mainstream science) exists in the area of explaining the origin of life, the source of life’s complexity and variation, and the origins of the universe (henceforth referred to as origins).
Contested Knowledge is a concept not too far removed from contested meanings
(Gusfield 1996; Tavory and Swidler 2009), although rather than focusing on the contestation of the cultural meanings of specific knowledges, the concept contested knowledge as I am using it here refers also to the process by which knowledge becomes contested. That process is as follows: when spheres of knowledge authority intersect, there are competing truth claims available for phenomena. There are also competing rules and criteria for judging those truth claims, and a selection of one truth claim over others is ultimately a selection of those rules and criteria as well. Thus, conflict over evolution versus creationism is, in part, conflict over the standards for collecting and assessing empirical versus faith-based evidence.
truth claim. Spillover effects then result in the devaluation of those rules and criteria being extended to uncontested knowledge outside the contested area and related to the opposed sphere of knowledge authority (spheres may differ depending on the specific knowledge area, for the area of evolution and related ideas the overlapping or opposed spheres of knowledge authority are the scientific and religious spheres).
4 - Contributions
This dissertation contributes to our understanding of religious and other factors that contribute to understanding, acceptance, and rejection of scientific ideas in several ways. The first of these is a more detailed measurement analysis of the factors that underlie a popular and widely available scale intended to measure science knowledge. This measurement analysis provides other researchers tools to adequately measure science knowledge without unnecessarily including confounding influences of religiosity.
The second contribution is evidence supporting the claim that conservative Protestants have overall lower levels of science knowledge than either unaffiliated persons or persons with other religious affiliations, in the United States. This finding addresses the disagreement encapsulated in the recent papers by Sherkat (2011) and Evans (2011, 2013) over the relation between conservative forms of Protestantism and science knowledge, although this negative effect is fully mediated by common covariates and a measure of the rejection of evolution and related ideas.
A third contribution is the introduction and explanation of the concept of contested knowledge. Related both to the concept of contested meanings (Gusfield 1996; Tavory and
Swidler 2009) as well as epistemological conflict (Evans and Evans 2008; Evans 2011),
that the legitimacy and veracity of knowledge may be challenged, discounted, or dismissed, and the ways that this challenge or dismissal may have impact beyond the specific area of
contestation.
Building on the previous contributions, this dissertation also presents an examination of the life course and demographics of the rejection of evolution and related ideas. The previous section outlined the critical nature of many of the implications of high rates of the rejection of evolution. Because relatively little previous work exists on this issue, the fourth chapter of this dissertation presents an analysis of change trajectories for the rejection of evolution (and related ideas). While there has been much scholarly interest in the life course patterns of religious service attendance (Hayward and Krause 2013; Petts 2009; Schwadel 2011; Uecker, Regnerus, and Vaaler 2007), there is some disagreement about what survey measures of religious
attendance are really measuring, behavior or identity (Brenner 2011; Hadaway, Marler, and Chaves 1993). Chapter four explores the change trajectories of religious attendance as well as the relation between rejection of evolution and religious service attendance without forcing the conceptual definition of the attendance measure to be either solely an indicator of behavior or identity.
5 - Structure of this Volume
This dissertation consists of three inter-related papers, as well as introductory and concluding chapters. A brief synopsis of the chapters follows. Chapter 2 details a measurement analysis of the NSF science knowledge scale. This scale was included in the NSF Surveys of Public Attitudes Toward And Understanding of Science And Technology, 1979-2006 (Miller et
scale, as well as a new structure introduced in the chapter using confirmatory factor analysis (CFA) within the structural equation modeling (SEM) framework. I also identify several scale indicators that may be tapping an aspect of religiosity as well as science knowledge. I
demonstrate evidence that these indicators are indeed tapping religiosity, and moreover that two of them are very poor measures of science knowledge. I term this dimension Young Earth Worldview (YEW), and find YEW to be negatively correlated with other dimensions of science
knowledge. This chapter has been published in the journal Public Understanding of Science (Roos 2012).
Chapter 3 is an explication of the relationship between YEW (renamed in this and subsequent chapters The Rejection of Scientific Orthodoxy (RSO)) and uncontested forms of science knowledge. This chapter also develops the concept of contested knowledge in greater depth, and proposes that in certain cases there may be spillover effects from positions within contested knowledge areas to uncontested areas, resulting in reductions in acceptance or awareness of uncontested knowledge. In this chapter I also explore the relation of conservative Protestantism and science knowledge, a relationship that in the sociology of religion literature is alternately marked and negative (Sherkat 2011) or insignificant (Evans 2011). I explore these questions by fitting a SEM where RSO is an intervening variable between demographic covariates and uncontested science knowledge.
Chapter 4 is an examination of the change trajectory of RSO over time as well as the relation between the RSO dimension and a survey measure of religious service attendance
strong association between attendance and RSO is evident. I propose three likely models to capture this relationship: (1) religious attendance influences RSO, (2) RSO influences attendance, and (3) while correlated, both RSO and religious attendance have unique change trajectories with unique slopes and intercepts. I test this using latent growth curve models (LCMs) within the SEM framework.
CHAPTER II: MEASURING SCIENCE OR RELIGION? A MEASUREMENT ANALYSIS OF THE NSF SPONSORED SCIENCE LITERACY SCALE 2006-2010 1 - Introduction
High scientific literacy in a nation’s citizens is generally considered a public good, particularly in democratic societies, as an informed public makes better choices. It is also
important to develop means of assessing the scientific literacy of the public, and towards that end the National Science Foundation (NSF) science knowledge scale is the main instrument for measuring civic scientific literacy in the United States. However, the scale is frequently misused, and this misuse provides an inaccurate picture of the landscape of science literacy in the US American public, contributes to poor sociological understandings of science knowledge inequalities, as well as weakening understandings of the effects of poor science knowledge2.
Recent studies of science knowledge have used variations of the same science knowledge scales; substituting in some items for others and dropping other items entirely (Miller 1998, 2004; National Science Board 2010, 2012) -- often without attention to how this may alter the validity and reliability of the scale. This paper uses the NSF science knowledge scale, which has appeared in each cross-sectional wave of the General Social Survey (GSS) since 2006 and in the NSF Surveys of Public Attitudes Toward And Understanding of Science And Technology since 1979 (with the current scale form since 1995). This scale has been used by those writing within the Public Understanding of Science (PUS) area as well as within general Sociology (Bauer,
Allum, and Miller 2007; Evans 2011; Gauchat 2010; Miller 1998, 2004; Sherkat 2011; Sturgis and Allum 2004)3.
Confirmatory factor analyses of this scale have not been published since Miller’s review (1998, 2004), the most recent of which used 1999 data from the NSF Surveys dataset. This paper contributes a measurement analysis of the NSF science knowledge scale in the 2006-10 and will demonstrate a model structure that fits the data better than either Miller’s two dimensions of science literacy or the unidimensional way the scale is normally used. In this paper I present a measurement analysis for science knowledge as a latent variable using data from the 2006, 2008, and 2010 General Social Survey (GSS), as well as earlier non-GSS samples.
Jon Miller (1983, 1987, 1998) proposed a two-dimensional structure for science literacy: a fact-based knowledge dimension and a methodology or process dimension. Miller (1998) calls these two dimensions combined civic scientific literacy, and stresses the difference between lay understanding of science and professional understanding -- the scale is meant to measure the former. Miller’s own definition of his dimensions are: “(1) a vocabulary of basic scientific constructs sufficient to read competing views in a newspaper or magazine, (2) an understanding of the process or nature of scientific inquiry” (Miller 1998:205). Miller raises the problem of multidimensionality in his paper and leaves the door open for structures other than the one he proposed.
For the purposes of this paper, I define science knowledge as follows: The knowledge required to read and understand the science section or science-focused articles of a major news
website, such as npr.org or cnn.com; allowing for topical areas of interest. Necessarily
Table 1: NSF science knowledge scale questions with GSS variable names
Now, please think about this situation. Two scientists want to know if a certain drug is effective against high blood pressure. The first scientist wants to give the drug to one thousand people with high blood pressure and see how many of them experience lower blood pressure levels. The second scientist wants to give the drug to five hundred people with high blood pressure, and not give the drug to another five hundred people with high blood pressure, and see how many in both groups experience lower blood pressure levels.
EXPDESGN: Which is the better way to test this drug? 1: All 1000 get the drug
2: 500 get the drug; 500 don't
Now, think about this situation. A doctor tells a couple that their genetic makeup means that they’ve got one in four chances of having a child with an inherited illness. (Answers took the form: Yes, No, or Don’t Know)
ODDS1: Does this mean that if their first child has the illness, the next three will not have the illness?
ODDS2: Does this mean that each of the couple’s children will have the same risk of suffering from the illness?
Now, I would like to ask you a few short questions like those you might see on a television game show. For each statement that I read, please tell me if it is true or false. If you don’t know or aren’t sure, just tell me so, and we will skip to the next question. Remember true, false, or don’t know.
HOTCORE: First, the center of the Earth is very hot. Is that true or false? RADIOACT: All radioactivity is man-made. (Is that true or false?)
BOYORGRL: It is the father’s gene that decides whether the baby is a boy or a girl. (Is that true or false?)
LASERS: Lasers work by focusing sound waves. (Is that true or false?) ELECTRON: Electrons are smaller than atoms. (Is that true or false?)
VIRUSES: Antibiotics kill viruses as well as bacteria. (Is that true or false?) BIGBANG: The universe began with a huge explosion. (Is that true or false?)
CONDRIFT: The continents on which we live have been moving their locations for millions of years and will continue to move in the future. (Is that true or false?)
EVOLVED: Human beings, as we know them today, developed from earlier species of animals. (Is that true or false?)
EARTHSUN: Now, does the Earth go around the Sun, or does the Sun go around the Earth? SOLARREV1: How long does it take for the Earth to go around the Sun: one day, one month, or
one year?
All items had a “don’t know” response option, and these were coded as incorrect answers in each case, as done by Evans (2011) and (Gauchat 2010), with the reasoning that for an item assessing factual knowledge, a “don’t know” response is incorrect.
In recent months, there has been some debate over the validity of two of the items in the NSF science scale -- “evolved” and “bigbang” (see question wording in Table 1). These two items, the result of answers to questions about evolution and the big bang, respectively, are seen as either spanning multiple domains (that of science and that of religion), and thus requiring additional specification text (i.e. “according to astronomers”, see Bhattacharjee 2011), or as not relating to science knowledge at all. All of which lead to the decision to drop descriptive statistics about the two items from the 2010 Indicators (Bhattacharjee 2011; National Science Board 2010) report. One potential explanation for why “bigbang” and “evolved” may not serve as good indicators of science literacy is that together with the “condrift” item they are instead indicators of a certain belief structure which I term “Young Earth Worldview”. A “young earth” worldview (YEW) is one where the Earth is held to be between 5,700 and 10,000 years old (Numbers 2006). The prevalence of this view was recorded as variously 47% in 1991 to 53% in 2006 (Numbers 2006:1) depending on question wording, data from Gallup polls reveal that between 43% and 47% believe that human beings were created by God “…pretty much in the present form at time within the last 10,000 years or so.” (Keeter and Horowitz 2009). This worldview has implications for the survey items included in the YEW dimension. Specifically, holders of a young earth worldview will be much more likely to report “false” rather than “true” for the evolution question, the big bang question, and potentially the continental drift question.
a “Young Earth Worldview” then evolution-related items may be as influenced by it as the “evolved” item. The debate has largely centered around whether the “evolved” and “bigbang” items are of a religious nature in addition to their relation to science knowledge or in lieu of any useful relation to science knowledge. The power of confirmatory factor analysis in the SEM framework lets me test these assertions.
2 - Background
In a recent review article on public understanding of science (PUS), Bauer et al. (2007) discuss how conceptualizations (and thus, methods of study) of PUS have changed since the 60’s. They document the trend away from examining attitudes about science and education as sources of deficit in PUS in the late 1980s, and towards a lack of trust or confidence from the 1990s on. Jon Miller (1983, 1998, 2004) has defined science literacy as the level of
understanding needed to “read and comprehend” the science section of The New York Times, with the assumption that policy and public discourse will be framed at a similar language level. A popular early definition of science literacy or understanding was of three discrete measures: consumer science literacy, citizenship science literacy, and general science literacy (Miller 2004; Shen 1975) -- and Miller admits that most of his own work has focused on the citizenship aspect of science literacy, rather than a professional or practitioner science literacy (i.e. science literacy among scientists).
understanding the nature of an experiment is separate from, but not any less important than knowledge of general scientific facts and terms.
While Miller found that there was an uptick in science literacy from 1988 to 1999 in Americans over 18 (from 10% to 17%; see Miller, 2004, p. 288), the overall rate of literacy remains low given how many Americans have had basic science courses in higher education and high school. The rate at which respondents give what mainstream science would consider correct answers to the basic science facts items found in the GSS have been relatively stable in the US population since the late 1980s (though the items themselves have not been in the GSS proper), save for a steady increase in rate of mainstream science correct answers about antibiotics since 1988 and an uptick in understanding of DNA since 1997 (Miller 2004; National Science Board 2010, 2012). The inclusion of these items in a data set as rich and varied as the GSS allows for a more nuanced sociological explanation of science understanding and my goal is to suggest proper specification of the NSF science knowledge scale in subsequent analyses.
The primary contribution of this paper is a measurement model of the NSF science knowledge scale. Typically this scale is used as a summed scale -- which doesn’t account for either measurement error or for multidimensionality within the scale itself. This work also contributes to the debate surrounding the degree to which the “evolved” and “bigbang” items present in the NSF science knowledge scale serve as indicators of science knowledge
3 - Specific Hypotheses
The NSF science knowledge scale is frequently used as a unidimensional construct (Gauchat 2010; Sherkat 2011). In this type of model structure the implicit assumption is that the latent variable affects each indicator variable equally. Jon Miller proposed a two dimensional structure that makes better theoretical sense (1987, 1998, 2004) and should fit the data better. This is the structure used in J. H. Evans (2011) and argued for in Bann and Schwerin (2004).
H0: Underlying the NSF science knowledge scale is a single dimension of science knowledge.
H1: Underlying the NSF science knowledge scale is a two-dimensional latent variable for science knowledge, with one dimension for fact-based knowledge and a second dimension for methodological knowledge.
I propose that Miller’s fact-based knowledge dimension (Bann and Schwerin 2004; Miller 1998, 2004) may be multidimensional, and that allowing it to break into topical sub dimensions will result in better model fit than Miller’s original two dimensional structure, specifically letting science literacy indicators load on a physical sciences facts dimension and a life sciences facts dimension:
H2: Underlying the NSF science knowledge scale is a two-dimensional structure that breaks sub- dimensions along topical areas of interest, such as life and physical sciences.
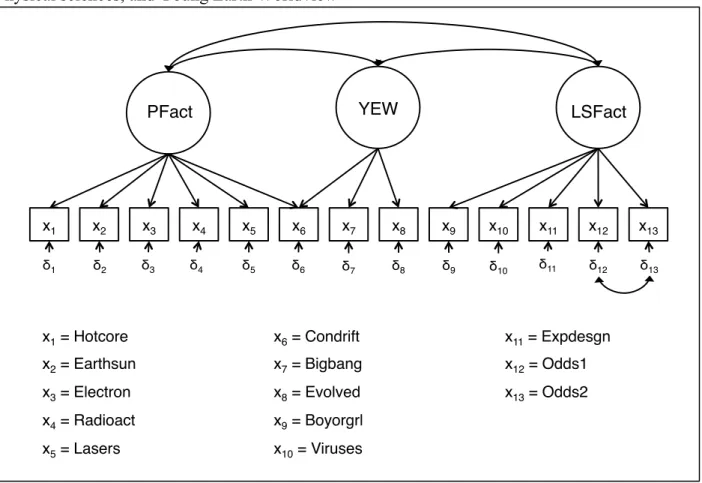
Figure 1: Science Knowledge from 2006 GSS (Model E). Three dimensions: Life sciences, Physical sciences, and Young Earth Worldview
H3: Underlying the NSF science knowledge scale is an additional, religious dimension that is unrelated to science knowledge.
To account for the critique that any model structure is merely an effect of the particular sample, I split the 2006 wave of the GSS into an exploratory sample and a test sample, and further use the 2008 and 2010 waves as well as data from the NSF Surveys dataset (Miller et al. 2009) for years 1995, 1997, 1999, and 2001 to test model fit. A model that fits well across all available samples is likely not merely an effect of a particular sample, nor of overall survey design (as data from two different surveys are used, collected in different ways).
PFact!
x1!
δ1! x2!
δ2! x3! δ3!
x4! δ4!
x5!
δ5! x6!
δ6!
x7!
δ7! x8!
δ8!
x9!
δ9!
x10!
δ10! x11! δ11!
x12!
δ12! x13!
δ13!
LSFact! YEW!
x1 = Hotcore!
x2 = Earthsun!
x3 = Electron!
x4 = Radioact!
x5 = Lasers!
x6 = Condrift!
x7 = Bigbang!
x8 = Evolved !
x9 = Boyorgrl!
x10 = Viruses!
x11 = Expdesgn!
x12 = Odds1!
4 - Data and Methods
This paper uses cross-sectional data from the 2006, 2008, and 2010 waves of the General Social Survey (GSS), a nationally representative sample of United States adults, and as such can be used to make inferences about the US population at large (Davis, Smith, and Marsden 2009; Smith et al. 2010). Additional analyses are performed on the National Science Foundation’s Surveys of Public Attitudes Toward And Understanding of Science And Technology, which
consists of earlier cross-sectional samples with the same items now present in the GSS (Miller et al. 2009).
I test the hypotheses above by performing confirmatory factor analysis (CFA) as a case of a measurement model within the structural equation models framework (Bollen 1989). SEMs cannot prove whether or not a given model is the true model, but they can allow researchers to compare different structures and reject poorly fitted models (Bollen 1989; Gideon Schwarz 1978; Kline 2005; Raftery 1995). I modeled the dimensions of science knowledge as latent variables. In one model, I break science knowledge into Miller’s two subdimensions (fact based knowledge and methodological or procedural knowledge) and in other models I adopt structures suggested by the above hypotheses. All models were estimated using Mplus 6.12 (Muthén and Muthén 2011). CFAs allow me to assess overall model fit, the variance explained in the individual items by the latent variables, and the extent of measurement error in the individual items. The observed variables are the NSF science knowledge scale items from the GSS, which are listed in Table 1 (Davis et al. 2009; Miller et al. 2009; Smith et al. 2010). These are categorical measures and treated as such when estimating the models.
indices to assess the overall fit of the model. The additional fit indices include the RMSEA (values less than 0.05 indicate good it), the CFI and TLI (values above 0.95 indicate good fit), and the Schwarz BIC or SBIC (χ2 - df*nl(N); values less than 0 indicate good fit) (Gideon Schwarz 1978; Hu and Bentler 1999; Kline 2005; Tucker and Lewis 1973). The SBIC also can be used to compare two models as long as they have the same set of observed variables. A difference of 10 or greater indicates a given model has a significantly better fit with the data than an alternative model (Raftery 1995).
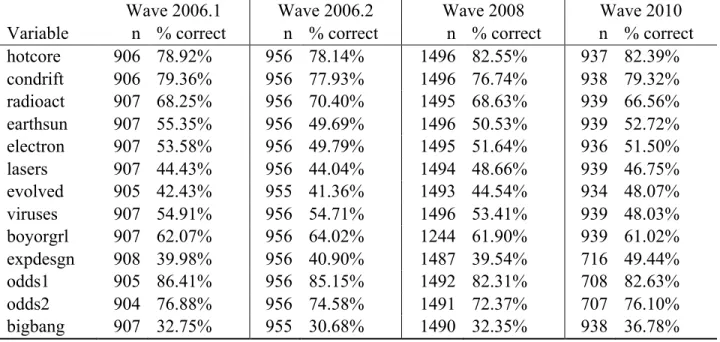
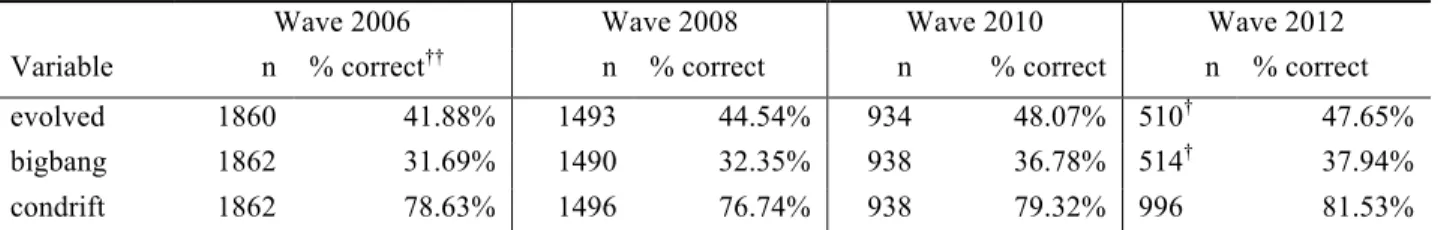
Table 2: Descriptive statistics: Number of cases and percent correct for NSF science knowledge items in each wave of GSS
Wave 2006.1 Wave 2006.2 Wave 2008 Wave 2010
Variable n % correct n % correct n % correct n % correct hotcore 906 78.92% 956 78.14% 1496 82.55% 937 82.39% condrift 906 79.36% 956 77.93% 1496 76.74% 938 79.32% radioact 907 68.25% 956 70.40% 1495 68.63% 939 66.56% earthsun 907 55.35% 956 49.69% 1496 50.53% 939 52.72% electron 907 53.58% 956 49.79% 1495 51.64% 936 51.50% lasers 907 44.43% 956 44.04% 1494 48.66% 939 46.75% evolved 905 42.43% 955 41.36% 1493 44.54% 934 48.07% viruses 907 54.91% 956 54.71% 1496 53.41% 939 48.03% boyorgrl 907 62.07% 956 64.02% 1244 61.90% 939 61.02% expdesgn 908 39.98% 956 40.90% 1487 39.54% 716 49.44% odds1 905 86.41% 956 85.15% 1492 82.31% 708 82.63% odds2 904 76.88% 956 74.58% 1491 72.37% 707 76.10% bigbang 907 32.75% 955 30.68% 1490 32.35% 938 36.78%
5 - Results
poor; however, while the SBIC negative (-73.77), the CFI and TLI are both below 0.9, and the RMSEA is marginal.
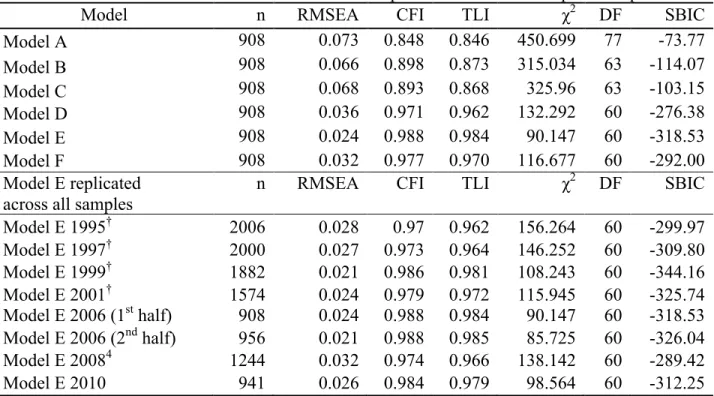
Table 3: Models estimated with first half of 2006 sample and tested on subsequent samples
Model n RMSEA CFI TLI χ2 DF SBIC
Model A 908 0.073 0.848 0.846 450.699 77 -73.77
Model B 908 0.066 0.898 0.873 315.034 63 -114.07
Model C 908 0.068 0.893 0.868 325.96 63 -103.15
Model D 908 0.036 0.971 0.962 132.292 60 -276.38
Model E 908 0.024 0.988 0.984 90.147 60 -318.53
Model F 908 0.032 0.977 0.970 116.677 60 -292.00
Model E replicated across all samples
n RMSEA CFI TLI χ2 DF SBIC
Model E 1995† 2006 0.028 0.97 0.962 156.264 60 -299.97 Model E 1997† 2000 0.027 0.973 0.964 146.252 60 -309.80 Model E 1999† 1882 0.021 0.986 0.981 108.243 60 -344.16 Model E 2001† 1574 0.024 0.979 0.972 115.945 60 -325.74 Model E 2006 (1st half) 908 0.024 0.988 0.984 90.147 60 -318.53 Model E 2006 (2nd half) 956 0.021 0.988 0.985 85.725 60 -326.04 Model E 20084 1244 0.032 0.974 0.966 138.142 60 -289.42
Model E 2010 941 0.026 0.984 0.979 98.564 60 -312.25
Model Legend: A: Unidimensional structure factor loadings forced to 1; B: Miller’s structure, facts and methods dimensions; C: Two dimensions, life and physical sciences dimensions; D: Non-Young Earth Worldview dimension added to model C, loadings forced to 1; E: Model C with YEW, “evolved” and “bigbang” load on YEW only; F: Model B with YEW, “evolved” and “bigbang” load on YEW only. See figure 1 for structural representation of Model E.
†: not from the GSS – from National Science Foundation Surveys of Public Understanding of Science and Technology combined dataset, 1979-2006. 1995 was the first year the “expdesgn” and “boyorgrl” items were present. (Miller et al, 2009).
4 The 2008 wave of the GSS alternated the boyorgirl item with a different wording for
Model B in Table 3 is one that conforms to Jon Miller’s (Bann and Schwerin 2004; Miller 1983, 1987, 1998, 2004) two dimensions of science knowledge (or what he calls literacy). The observed variables do not correspond perfectly to those in his 1998 and 2004 papers, as some of the items he used are not present; in particular one of the indicators of methodological knowledge (an open-ended explanation of the meaning of studying something scientifically, see appendix for a detailed explanation). Model B has the following variables in the methodological dimension (SKMeth): “odds1”, “odds2”, and “expdesgn”. Further, the model allows correlated errors between the “odds1” and “odds2” items, both of which are questions related to the same vignette (see Table 1). Both of these questions rely on an understanding of odds and probability as well as a basic understanding of Mendelian genetics, and in the NSF Indicators document as well as Miller’s 1998 analysis they are even combined into a single indicator (giving each respondent in effect two chances to get it wrong). The model specified correlated error between these two items is to account for their interconnectedness in both the survey design and in
substantive knowledge of genetics and heredity. Model B has a better fit than the unidimensional model, with a difference of SBICs of over 40, indicating “very strong support” for B over A (Raftery 1995:139), though the Tucker-Lewis index and Comparative fit index are both below 0.9.
“boyorgrl”, and “evolved”. While the “odds1”, “odds2” and “expdesgn” items are normally treated as indicators of methodological knowledge, they each have a life sciences component and thus theoretically may group together with the “viruses”, “evolved” and “boyorgrl” items, and an empirical comparison of the two structures favors model C over model A, however based on a comparison of the SBIC scores, model C does not improve over model B, and the SBIC difference of 10.92 is very strong support for B over C. Like model B, model C has poor fit statistics other than the SBIC.
As an initial test for hypothesis 3, separate models for B and C with the following correlated errors were estimated but are not reported here. The additional correlated error structure is between three items: “bigbang”, “evolved”, and “condrift”. There has been some discussion over the inclusion of the “bigbang” item recently, as any question about the origins of the universe may tap religious dimensions as well as dimensions of scientific knowledge. The question on evolution was dropped from the scale in Sherkat’s analysis (2011) for similar reasons (though the Big Bang item was still included), and J. H. Evans (2011) dropped both “evolved” and “bigbang” from his analysis. The third item, “condrift” is not scrutinized in the same way as either “bigbang” or “evolved”, but I argue here that there is a common thread with all three indicators: each may be an indicator of a “Young Earth” worldview -- the belief that the Earth is between 5,700 and 10,000 years old (Numbers 2006), and thus that the principle of uniformitarianism -- or the idea that the natural processes we see now have always been in place -- does not exist. If there is something like a young earth worldview, it would be an essentially religious dimension that would also be tapped by these indicators.
the young earth items as a separate dimension rather than as a correlated error structure (See Figure 1). As all three items are coded reverse (that is, high young earth dimensions correspond to a zero in the indicators, low young earth worldview to a one), this dimension is titled “Young Earth Worldview” (YEW). To make the YEW dimension easier to interpret, the dimension in the models is reverse-coded by forcing the factor loading for “evolved” to be negative one rather than one. This change does not alter model fit, only the direction of correlations between YEW and other dimensions. Thus, a decrease in young earth worldview would increase the likelihood of responding correctly (as mainstream science holds) on “condrift”, “bigbang”, or “evolved”. Due to the fact that this dimension’s indicators each load on other dimensions, the model where the parameters for factor loadings are left free is unidentified (Bollen and Davis 2009; Reilly and O’Brien 1996). To mitigate this, model D was estimated with the factor loadings for each path from YEW to observed variables forced to one (correlations between dimensions and R2 are in Table 4). In this model, however, the paths for the “evolved” indicator factor loading on life sciences facts (LSFact) and for the “bigbang” and “condrift” indicator loadings on physical sciences facts (PFact) are insignificant.
To test whether the YEW dimension is indeed a religious one, a model was estimated identical to D with the addition of the “bible”5 item as an added indicator for YEW, with “condrift”, “evolved”, and “bigbang” factor loadings kept at one, and named D’ (fit statistics in
5 The “bible” item was generated from the following question:
Appendix). The factor correlations and r2 for this second model can be compared with those from model F below, with the same indicators for PFact and LSFact as in model C above.
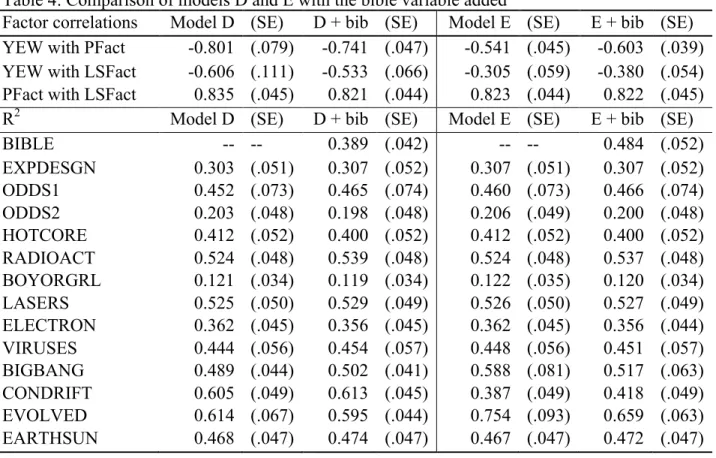
Table 4: Comparison of models D and E with the bible variable added
Factor correlations Model D (SE) D + bib (SE) Model E (SE) E + bib (SE) YEW with PFact -0.801 (.079) -0.741 (.047) -0.541 (.045) -0.603 (.039) YEW with LSFact -0.606 (.111) -0.533 (.066) -0.305 (.059) -0.380 (.054) PFact with LSFact 0.835 (.045) 0.821 (.044) 0.823 (.044) 0.822 (.045) R2 Model D (SE) D + bib (SE) Model E (SE) E + bib (SE)
BIBLE -- -- 0.389 (.042) -- -- 0.484 (.052)
EXPDESGN 0.303 (.051) 0.307 (.052) 0.307 (.051) 0.307 (.052) ODDS1 0.452 (.073) 0.465 (.074) 0.460 (.073) 0.466 (.074) ODDS2 0.203 (.048) 0.198 (.048) 0.206 (.049) 0.200 (.048) HOTCORE 0.412 (.052) 0.400 (.052) 0.412 (.052) 0.400 (.052) RADIOACT 0.524 (.048) 0.539 (.048) 0.524 (.048) 0.537 (.048) BOYORGRL 0.121 (.034) 0.119 (.034) 0.122 (.035) 0.120 (.034) LASERS 0.525 (.050) 0.529 (.049) 0.526 (.050) 0.527 (.049) ELECTRON 0.362 (.045) 0.356 (.045) 0.362 (.045) 0.356 (.044) VIRUSES 0.444 (.056) 0.454 (.057) 0.448 (.056) 0.451 (.057) BIGBANG 0.489 (.044) 0.502 (.041) 0.588 (.081) 0.517 (.063) CONDRIFT 0.605 (.049) 0.613 (.045) 0.387 (.049) 0.418 (.049) EVOLVED 0.614 (.067) 0.595 (.044) 0.754 (.093) 0.659 (.063) EARTHSUN 0.468 (.047) 0.474 (.047) 0.467 (.047) 0.472 (.047)
What is most striking here is that the factor correlations do not change much with the addition of the “bible” item as an anchor for YEW. Further, the r-squares for indicators for the overall model do not change a great deal, either. This means that the “bible” indicator did not change how YEW behaved overall and suggests that the indicators in YEW are very likely tapping a religious dimension -- that of a young earth worldview.
that for evolution or the big bang. In addition, continental drift is obscure enough a concept that it may still serve as an indicator for science knowledge, where evolution and the big bang have been politicized enough that most US Americans have heard of them regardless of their stance on the issue. This change to the model structure makes model E identified even without forcing factor loadings to 1, and so all factor loadings are freely estimated. The resulting model fit is superior to either models B or C as well as to model D (SBIC = -318.53), and has favorable model fit indices. A similar modification was done for Miller’s two dimensional model (Model F), and YEW was added with the same paths as above, the SBIC for this model was -292, demonstrating a poorer fit than model E. For clarity, the dimensions in model E are PFact or physical sciences, LSFact or life sciences facts, and YEW or young earth worldview. The indicators for PFact are: “hotcore”, “condrift”, “earthsun”, “electron”, “radioact”, and “lasers”. The indicators for LSFact are: of “odds1”, “odds2”, “expdesgn”, “viruses”, and “boyorgrl”; and the indicators for YEW are: “condrift”, “evolved”, and “bigbang” (“condrift” loads on both YEW and PFact).
self-report item about political leanings, but also would affect those items in the economic knowledge scale that are susceptible to influence by these political attitudes. This technique to separate the explained variance for indicators that may load on more than one factor requires one additional indicator to measure the confounding concept – in this example case left/right political leanings. This is similar to the method used to test for religious loading on the indicators that make up YEW.
As was the case with model D, model E and model E’ have similar factor correlations and R2 for indicators (a similar analysis was performed for Model F, but not reported here). Additionally, this table allows us to see how strong the R2 for the YEW indicators have become -- “evolved” and “bigbang” are now the two indicators with variance best explained by the model (both with and without the “bible” indicator), with “condrift” moving from poor to average. As in model D, YEW is negatively correlated with both PFact and LSFact, specifically: as YEW decreases likelihood of a respondent selecting what mainstream science holds to be the correct answer to the indicators increases. PFact and LSFact remain highly correlated but distinct dimensions. The R-square values for indicators in the table represent the explained variance. Subtracting these values from 1 yields the measurement error for each indicator for the model listed at the top of the table column.
Test of models on subsequent waves
are close to the true model, they should work equally well in other waves. Table 3 above
contains tests of model E, the final model, across all waves (both halves of 2006 as well as 2008 and 2010), as well as on earlier samples of the science scale (not administered as part of the GSS; see (Miller et al. 2009:2)).
A sensitivity analysis was performed to test if the YEW dimension simply mirrored respondents’ religious affiliation (see Appendix). Relations between YEW and other dimensions were little changed when adding denominational affiliation as controls, and a multiple group analysis between Protestants and others failed to find significant group differences in the measurement model. For further sensitivity analyses, see Appendix.
6 - Discussion
Young Earth Creationist Worldview
The Young Earth Worldview dimension is the most striking result from the models above, and requires some additional explanation. The relationship between YEW and the big bang item is the most clear -- the statement “The universe began with a huge explosion.”6 is more or less directly problematic for a young earth, as a period of expansion and cooling is implied by the concept (though perhaps not entirely necessary). It is most likely, however, that the big bang as false is packaged into the ongoing rhetoric about a young earth that “young earthers” read, hear, and create. Similarly, evolution as generally understood by biologists may have some internal disputes, but most tend to agree that whatever the process it tends to happen over very long spans of time (even punctuated equilibrium requires large periods of stability), and thus evolution as understood by specialists and the lay public is incompatible with a young
earth. Further, like the Big Bang, it is likely that the concept of evolution as a “false” theory is packaged into rhetoric and ideas about young earth creationism. The continental drift connection is weaker -- while the same conceptual problems for plate tectonics within a young earth
worldview exist, there is more nuance involved and, generally, the idea of the continents moving a few centimeters a year is not in itself a problem for a young earth; although coupled with older earth ideas and uniformitarianism7, or the idea that the processes we see working in the natural world now are the same processes that have been working in antiquity, we might expect that holders of a young earth worldview would be more likely to report “false” to the continental drift item than others. Because of the obscurity and nuance of the continental drift item, it alone remains a good indicator for science knowledge (in particular, physical sciences).
This does not hold true for “evolved” or “bigbang”, however. These items, most likely because of their lack of obscurity, are so commonplace that they make bad indicators of science knowledge (indeed, in the models above, insignificant indicators once the YEW dimension is accounted for). This is a controversial claim, but the models reported here suggest that “evolved” and “bigbang” are better treated as of a specific, religious, worldview -- that of Young Earth Creationism. Table 4 demonstrates that the YEW dimension functions almost identically with or without the “bible” item included -- an item about the literal truth of the Christian Bible. The items “condrift”, “evolved”, and “bigbang” scale together with an item about how literally truthful and inerrant the respondent views the Christian Bible. Unlike the NSF science
knowledge scale, the “bible” item has been present in the GSS in the current form since 1984 (Smith et al. 2010), and the percentage of responses in each category has been relatively stable with rates for the inerrancy category fluctuating from 32.69-38.39% across waves and from 30.63-44.79% across age groups.
Some readers may question the reasoning behind the argument that together the
“evolved”, “bigbang”, and “condrift” items measure a specific conservative religious worldview rather than science knowledge. While it is true that in some cases, individuals who respond with incorrect answers on those three items will also be lacking in other areas of science literacy, in the United States there is a long tradition of alternative rationalizations for a Young Earth Worldview. In some cases, as in that of Baraminology, allowances are made for “micro” variation (or, dog breeds, that changing color of moths over generations, etc), but speciation is fundamentally rejected8. A Young Earther conversant with the Bariminology “debate” would be able to read and understand a New York Times Science Tuesday article on genetics, provided that article did not argue for or strongly suggest a speciation event. If it did argue for a speciation event, it would be rejected out of hand – regardless of the substantive contents, as it would fundamentally conflict with the worldview of the reader in question. Other holders of a Young Earth Worldview may hold only a weak or second-hand understanding of the various attempts by
8 As one reviewer points out, in some cases speciation is not problematic for modern
baraminologists, provided this speciation occurs within baramins; that is, no new baramins arise, and any variation (micro or otherwise) does not result in either a new kind or in something that is not of the original kind. This subtle wordplay can be used to liken baramins to genera, family, or even higher order taxons. Further, baraminology generally rejects the idea of universal common descent, or that all life derives from a common ancestor. Whether or not the point of contention is at speciation events, creation of new genera, or even higher along the standard taxonomic hierarchy isn’t particularly relevant, the distinction between theologically important and
creation science to rationalize the rejection of uniformitarianism, but may still generally grasp such an article. For a lay Young Earther, speciation is complicated; discussing speciation
involving humans or their ancestors may even be offensive. It is worth noting that a recent PEW report put the percentage of creationists in the United States at 46% (Newport 2012); clearly more research in this area is necessary to tease apart these distinctions. Further, as one reviewer points out there are many Creation Science practitioners with a far more nuanced view of Young Earth Creationism than is described here, and to explore these nuanced distintions at depth is beyond the scope of this paper (however, see: Brand, 2009; Wood, 2005)
Assessment of Hypotheses
Model B, which is the structure most closely matching Miller’s fact based knowledge and methods knowledge dimensions, has better fit than model A -- the unidimensional structure. – which initially supports hypothesis 1. Subsequent models improve on the fit with more
dimensions, lending strong evidence to the claim that the NSF science knowledge scale is not best modeled as a single dimension. Thus, I reject hypothesis 0. The implications of the failure of hypothesis 0 are that to simply sum the items in the scale into a single science knowledge score are at best confusing the difference between physical sciences knowledge and life sciences knowledge, or between fact-based knowledge and methodological knowledge, and at worst to sum the items as currently presented in the GSS is to include two items that are far better indicators of a particular conservative religious worldview than of science knowledge.
has better fit than a similarly modified model B (model F), lending support for hypothesis 2 (see appendix for more detail).
Hypothesis 3 is supported with these analyses. In a naïve model, “evolved” and
“bigbang” load on life and physical sciences, respectively, but once the young earth worldview dimension is specified, neither loads significantly on either dimension. Model E has much better fit than models B or C (SBIC differences of 204.46 and 215.38, respectively), indicating very strong support for model E. Further, model E is superior to model D -- the model that forces “evolved” and “bigbang” to load on science knowledge as well as young earth worldview. This is the crux of the claim that “evolved” and “bigbang” are not indicators of science knowledge, but rather of Young Earth Creationist worldview. Further, the reversal of model preference between Miller’s two dimensional structure and the structure presented in model C above (with life and physical sciences sub dimensions) once Young Earth Worldview is taken into account is evidence of how treating “evolved” and “bigbang” as indicators of science knowledge may confound results.
Table 3 demonstrates good fit for model E across all subsequent waves (as well as the second half of the 2006 wave). This lends evidence to the claim that the model structure is not merely an artifact of the sample, though it may still be an artifact of the overall survey design of the GSS. The scale was administered outside the GSS for years 1995, 1997, 1999, and 2001, and model E has excellent fit in these samples as well, which lends support to the claim that the structure is neither an artifact of the sample nor an artifact of the GSS survey design. Recommendations
of science literacy (indeed, it is unlikely that they are). However, Based on these analyses researchers unable or unwilling to make use of the NSF science scale within the structural equation modeling framework should take special care to account for the religious loading of the “evolved” and “bigbang” items (and to a lesser extent, “condrift”). While further research is needed in this area, these results suggest the possibility that “evolved” and “bigbang” measure very little in the way of science knowledge, and instead may be primarily measures of a specific religious worldview (that is correlated with science knowledge), in samples of US Americans. Knowledge of natural history is a part of science knowledge, but what is the issue here is using two of the most controversial and emotionally charged potential items to measure it. Young Earth Worldview is, at its core, a worldview. Those that hold it are operating under a different paradigm than most others, a paradigm in which speciation ultimately leading to new high level taxons and beneficial gene mutation (resulting from new genetic information) are theological impossibilities9. To the extent that those holding this view may or may not have reduced science literacy, it may be best to assess this in areas that are not in direct ideological conflict with their views on the origins of life or the universe (indeed, we can already guess their views in those areas).
Further, it is advisable that if creating summed scales researchers create two separate scales: one for life sciences knowledge and one for physical sciences knowledge, rather than one single summed scale.
Many researchers currently using the NSF items construct summed scales -- this is problematic because it packages measurement error into the scale, conflates physical and life sciences fact based knowledge, and may even package some portion of particular conservative religious beliefs into the scale (which would almost certainly confound any bivariate relationship between science knowledge and religiosity). Grouping the NSF science knowledge scale into life and physical sciences rather than fact based and methods based knowledge is a better
representation of the data when using the available indicators. However, this will not alleviate the problem of measurement error within the subscales, which may confound analyses using the scales as covariates. Going forward, conservative religious beliefs should be included as a covariate when estimating models that predict science knowledge, whether or not the researcher conceptualizes YEW as a religious dimension or as degree of knowledge about natural history.
Further work is needed to examine how “evolved” and “bigbang” may load differently in samples from outside the United States. Additionally, the analyses above suggest that
CHAPTER III: CONTESTED KNOWLEDGE: COMPETING TRUTH CLAIMS AT THE INTERSECTION OF SCIENCE AND RELIGION
1 - Introduction
Knowledge may be said to be contested when multiple claims to truth exist – that is, one set of reasons why a particular piece of knowledge is legitimate and one or more set of reasons why it is illegitimate. In the United States, the theory of evolution and related ideas has been under contest in the public imagination since before the Scopes Trial, and remains contested to this day. The sources for this contestation are from the scientific and religious spheres. The problem area of knowledge is that of the origins of life, life’s complexity, and the beginnings of the universe (origins henceforth). The theory of evolution (and related ideas) is the set of explanations that has greatest legitimacy from the scientific sphere; competing ideas such as forms of creationism and intelligent design hold greatest legitimacy from the religious sphere.
There has been some scholarship detailing how, generally, the scientific and religious spheres are not in conflict, at least on epistemological grounds (Ecklund 2010; Evans and Evans 2008). However, these scholars still acknowledge that in certain specific areas of overlap
A number of recent studies have addressed the conflict (or lack thereof) between science and religion in American life (Baker 2012; Ecklund and Park 2009; Evans and Evans 2008; Evans 2011; Longest and Smith 2011; Roos 2012; Sherkat 2011). Typically, this new vein of work either explores the concrete epistemological incongruences between science and religion or instead the extent of the public belief and discourse about the conflict itself. These examinations raise the question of the intersection between the spheres of science and religion as a potential battleground for the legitimization of knowledge (Berger and Luckmann 1967). Gordon Gauchat (Gauchat 2010, 2012) has theorized that science has a “legitimacy problem” in the United States: which he defines as a scenario where “…the public no longer looks to scientists and scientific knowledge to provide a set of values that would improve everyday life, enlighten political perspectives, or address moral issues…” (Gauchat 2010:2), which could indicate a weakening of the influence of the scientific sphere. With the growing number of highly controversial science policy related issues at the forefront of the political scene in American politics (science
education, science funding, and the STEM workforce), just how knowledgeable the American public tends to be about those sorts of issues becomes even more important.
This article tests the effects of conservative Protestant religious affiliation on contested knowledge of origins and uncontested knowledge in general science (Roos 2012). It then compares these findings to those of recent works that fail to tease apart contested from uncontested knowledge, and demonstrates how, when properly specified, specific religious affiliations can have negative effects on even uncontested science knowledge, both directly and indirectly. In the following sections, I provide a brief discussion of the particular case of
in greater detail, a listing and explanation of specific research questions, and a section describing the data and methods used. This paper will demonstrate evidence of a direct negative effect of a contested knowledge area on uncontested science knowledge as well as indirect negative effects of conservative Protestant affiliation on science knowledge.
2 - Background
Public Understanding of Science
Science, once termed “natural philosophy” and considered a branch of philosophy, may be thought of as an empirical system of study. Thus, science knowledge is best conceived as knowledge about the substantive results and processes that occur during “normal science” (Kuhn 1962). For the purposes of this article, science is defined as: the intellectual and practical
activity encompassing the systematic study of the structure and behavior of the physical and
natural world through observation and experiment (Oxford Dictionaries 2013). Scholars of
science point out that it is difficult to disentangle the methods of science, the practitioners of those methods, and the product of those methods (Gieryn 1999; Moore 2008); however, this paper will focus on the product of those methods. And, for the purposes of this article, I shall define science knowledge as follows: The knowledge required to read and understand the science section or science-focused articles of a newspaper or news website, such as npr.org or
cnn.com, allowing for topical areas of specialization (Roos 2012). This definition is necessarily
[A]sk, find, or determine answers to questions derived from curiosity about everyday experiences. It means that a person has the ability to describe, explain, and predict natural phenomena. Scientific literacy entails being able to read with understanding articles about science in the popular press and to engage in social conversation about the validity of the conclusions. (National Academy of Sciences, Center for Science, Mathematics and Education 1996:22).
They go on to stress the importance of evaluation of evidence and the ability to make and evaluate arguments, essentially combining Miller’s two dimensions. Previous analyses (Roos 2012) have shown that topical subject area dimensions, namely physical and life sciences underlie the NSF science knowledge scale10 and have a significantly better fit to the data than Miller’s proposed structure, and further suggest that the NSF science knowledge scale poorly measures methodological knowledge about science, if at all.
Past work on disparities in science knowledge has focused on sex, age, college science instruction, number of children present in the home, educational attainment, and “informal learning”, or a measure of the use of “informal science education resources” as predictors (Miller 2004:288–289), and more recent work has begun to look at religion (Evans 2011; Gauchat 2010; Roos 2012, 2013; Sherkat 2011). The rate at which respondents give what mainstream science holds to be correct answers to the basic science facts items found in the GSS have been relatively stable in the US population since the late 1980’s, save for a steady increase in rate of correct answers about antibiotics since 1988 and about DNA since 1997 (Miller 2004; National Science Board 2010, 2012). However, the Big Bang and Evolution questions have been regarded as controversial (Bhattacharjee 2011), and I argue they are measures of an additional dimension, described below.