VALIDITY OF A LOCAL NORMS APPROACH FOR UNIVERSAL SCREENING IN EARLY CHILDHOOD RESPONSE TO INTERVENTION
LeeMarie Ayers Benshoff
A dissertation submitted to the faculty of the University of North Carolina at Chapel Hill in partial fulfillment of the requirements for the degree of Doctor of Philosophy in School
Psychology in the School of Education.
Chapel Hill 2014
ii © 2014
iii ABSTRACT
LeeMarie Ayers Benshoff: Validity of a Local Norms Approach for Universal Screening in Early Childhood Response to Intervention
(Under the direction of Ellen Peisner-Feinberg)
The purpose of this study was to examine the validity of a local norms approach used to interpret children’s universal screening scores within Recognition & Response (R&R), a tiered model of instruction in early childhood. Data for the current study were drawn from two
iv
formative assessment and outcome measures were examined to identify whether similar patterns occurred among the corresponding measures. Results of the analyses suggested moderate support for the local norms approach. Grouping by the local norms approach aligned relatively well with grouping by children’s scores on the outcome measures. Overall, similar patterns in association were found between children’s scores on the formative assessment and the
v
ACKNOWLEDGEMENTS
Completion of this dissertation would not have been possible without the support and encouragement of many individuals. First, I would like to thank Dr. Ellen Peisner-Feinberg and Dr. Virginia Buysse for their guidance and support throughout this process and for their
generosity in sharing data from the Recognition and Response Project. Further, I thank Dr. Peisner-Feinberg for serving as my advisor and mentor. She devoted countless hours to my dissertation to provide meticulous feedback, answer my numerous questions, and provide encouragement when I needed it the most. To my committee chair, Dr. Barbara Wasik, I extend my utmost appreciation for her constant support and coaching throughout my graduate career. Her guidance has undoubtedly helped build confidence in myself as a professional. I thank my other committee members, Dr. Steven Knotek and Dr. Sandra Evarrs not only for their time spent supporting me throughout the process of completing my dissertation, but also for the training they have provided in shaping my career as a school psychologist. I am grateful to Dr. Jennifer Schaaf and Dr. Rune Simeonsson for stepping in when needed to ensure the timely completion of my dissertation. I extend thanks to Dr. John Sideris for his thoughtful guidance throughout the preparation and execution of my data analyses and to Elizabeth Gunn for her assistance in organizing my data.
vi
vii
TABLE OF CONTENTS
LIST OF TABLES ... x
LIST OF FIGURES ... xii
LIST OF ABBREVIATIONS ... xiii
CHAPTER 1: INTRODUCTION ... 1
CHAPTER 2: LITERATURE REVIEW ... 3
Trends in Early Childhood Education ... 3
Response to Intervention (RTI) ... 4
Evidence for RTI... 8
RTI in Pre-K ... 10
Available models. ... 11
Recognition & response (R&R). ... 11
Assessment in Early Childhood ... 15
Literacy development... 15
Types of assessment. ... 17
Best practices. ... 19
Assessment in RTI/R&R... 19
Validity ... 25
Current Study ... 26
viii
CHAPTER 3: METHODS ... 31
Participants ... 31
Original studies. ... 31
Participating children and teachers. ... 32
Protection of human subjects. ... 37
Procedures ... 39
Key components... 39
Other components. ... 41
Measures ... 43
Formative assessment. ... 43
Outcome measures. ... 45
Demographic measures. ... 48
CHAPTER 4: RESULTS ... 49
Preliminary Analyses ... 49
Study 1 vs. Study 2. ... 49
Target vs. comparison children. ... 50
Time between assessments. ... 51
Primary Analyses ... 53
Question 1. ... 53
Question 2. ... 54
Question 3. ... 63
Question 4. ... 67
CHAPTER 5: DISCUSSION ... 73
ix
Classification accuracy. ... 74
Benchmark method. ... 76
Agreement with Cut Scores Approach ... 80
Patterns in Association between Demographic Characteristics and Scores ... 82
Limitations ... 85
Implications for Future Research and Practice ... 86
Conclusion ... 88
APPENDIX A: DIFFERENCES BETWEEN TRUE POSITIVES AND FALSE NEGATIVES BASED ON OUTCOME MEASURE SCORES FOR TARGET CHILDREN ... 90
APPENDIX B: DIFFERENCES BETWEEN TRUE NEGATIVES AND FALSE POSITIVES BASED ON OUTCOME MEASURE SCORES FOR COMPARISON CHILDREN ... 91
APPENDIX C: DIFFERENCES BETWEEN AT-RISK/NOT AT-RISK RATIOS FOR TARGET AND COMPARISON CHILDREN BASED ON OUTCOME SCORES ... 92
APPENDIX D: DIFFERENCES BETWEEN TRUE POSITIVES AND FALSE NEGATIVES BASED ON CUT SCORES APPROACH FOR TARGET CHILDREN ... 93
APPENDIX E: DIFFERENCES BETWEEN TRUE NEGATIVES AND FALSE POSITIVES BASED ON CUT SCORES APPROACH FOR COMPARISON CHILDREN ... 94
APPENDIX F: DIFFERENCES BETWEEN AT-RISK/NOT AT-RISK RATIOS FOR TARGET AND COMPARISON CHILDREN BASED ON CUT SCORES APPROACH ... 95
x
LIST OF TABLES Table
1. Classroom Characteristics and Settings ... 32
2. Demographic Characteristics of Teachers ... 34
3. Demographic Characteristics of Child Participants: Full Sample ... 35
4. Demographic Characteristics of Child Participants: Sample with Outcome Measures... 36
5. Description of Scores for C-PALLS+ Subtests and Outcome Measures ... 44
6. Matching Constructs for C-PALLS+ Subtests and Outcome Measures ... 48
7. Differences between Target (n = 191) and Comparison Group (n = 468) Performance on C-PALLS+ Subtests: Full Sample ... 51
8. Differences between Target and Comparison Group Performance on C-PALLS+ Subtests and Outcome Measures: Sample with Outcome Measures ... 51
9. Mean Values on Discriminant Functions for Outcome Measures ... 54
10. Classification Accuracy for Outcome Measures ... 54
11. Example Contingency Table ... 56
12. Local Norms Approach vs. Outcome Scores at the 30th Percentile Benchmark ... 57
13. Local Norms Approach vs. Outcome Scores at the 24th percentile Benchmark ... 59
14. Local Norms Approach vs. Outcome Scores at the 40th Percentile Benchmark ... 61
15. Local Norms Approach vs. Outcome Scores at the 15th Percentile Benchmark ... 62
16. Local Norms Approach vs. Cut Scores Approach ... 66
xi
18. Univariate Analysis of Variance Results: p-values for C-PALLS+
Vocab and PPVT-4 ... 69 19. Univariate Analysis of Variance Results: p-values for C-PALLS+
Vocab and EVT-2 ... 70 20. Univariate Analysis of Variance Results: p-values for C-PALLS+
PA and TOPEL PA ... 70 21. Univariate Analysis of Variance Results for C-PALLS+ subtests
and Outcome Measures as a Function of Child Characteristics:
Target Children ... 72 22. Univariate Analysis of Variance Results for C-PALLS+ subtests
and Outcome Measures as a Function of Child Characteristics:
xii
LIST OF FIGURES
xiii
LIST OF ABBREVIATIONS AERA American Educational Research Association APA American Psychological Association
CBA Curriculum-Based Assessment
CBM Curriculum-Based Measurement
C-PALLS+ CIRCLE-Phonological Awareness, Language, and Literacy System+ DIBELS Dynamic Indicators of Early Literacy Skills
DLL Dual Language Learner
EVT-2 Expressive Vocabulary Test, Second Edition
GOM General Outcome Measurement
IDEA Individuals with Disabilities Education Improvement Act IES Institution of Education Sciences
myIGDIs Individual Growth and Development Indicators
NAECS/SDE National Association of Early Childhood Specialists in State Departments of Education
NAEYC National Association for the Education of Young Children NASP National Association of School Psychologists
NCLD National Center for Learning Disabilities NCME National Council on Measurement in Education NHSA National Head Start Association
PPVT-4 Peabody Picture Vocabulary Test, Fourth Edition R&R Recognition & Response
RTI Response to Intervention
xiv
TPA Test of Preschool Early Literacy Phonological Awareness subtest TPK Test of Preschool Early Literacy Print Knowledge subtest
1
CHAPTER 1: INTRODUCTION
Response to Intervention (RTI) is a tiered approach to classroom instruction that involves systematic and data-based decision-making processes (Brown-Chidsey & Steege, 2005). It is designed to provide appropriate instruction for all students in an efficient and effective manner, thereby helping to prevent future learning difficulties and diagnosed learning disabilities. RTI is prevalent in elementary and secondary school settings, but has become more widespread in early childhood settings in recent years. Recognition & Response (R&R; Buysse & Peisner-Feinberg, 2009, 2010; Buysse et al., 2013; Coleman, Buysse, & Neitzel, 2006; Peisner-Feinberg & Buysse, 2013; Peisner-Feinberg, Buysse, Benshoff, & Soukakou, 2011) is a model of RTI specifically developed for early childhood education.
Assessment is a vital component of RTI and R&R, as children’s assessment results are directly linked to the type and intensity (tier) of instruction they receive. In both RTI and R&R, assessments are administered a few times throughout the school year to identify which children need additional instructional supports to learn and to monitor the progress of children who are receiving these additional instructional supports. Various approaches for interpreting assessment results, such as cut points based on percentiles or standard deviations from the mean, have been used in school-age RTI to determine whether a child demonstrates a need for targeted instruction (e.g., Fuchs, 2003; Torgesen, 2000).
Although a few assessment tools are currently available for use in RTI/R&R frameworks in early childhood, little empirical support exists regarding the validity of their use in this
2
purposes of instructional decision-making. The current study sought to address the gaps in the research regarding formative assessment instruments in early childhood. The present study examined the validity of a local norms approach used in two previous studies to interpret
preschool children’s scores on a formative assessment of language and literacy skills. The local norms approach used in the previous studies involved rank ordering children’s scores on the formative assessment within each classroom, thereby using classroom-based (or local) norms rather than population-based (e.g., district level, state, national) ones. This approach was utilized to identify children who demonstrated a need for targeted language and literacy intervention.
Chapter two begins with a brief discussion of the trends in early childhood education that have led to the current context for implementation of RTI approaches. The conceptual
frameworks for RTI and R&R, as well as the evidence base for their implementation, are then described. Next, assessment in early childhood is discussed with regard to the different types of assessments and their corresponding purposes. Because the focus of the current study is in the area of language and literacy assessment, a brief overview of literacy development is included. Assessment within RTI/R&R is then presented, with descriptions of characteristics of
appropriate tools and currently available tools. Validity is then discussed, with examples of how different types of validity apply to an assessment. The chapter concludes with a summary of the existing literature on RTI, R&R, and formative assessment instruments, followed by the study aims and corresponding research questions. Subsequent chapters present the research
3
CHAPTER 2: LITERATURE REVIEW Trends in Early Childhood Education
Over the past few decades, an increased focus on academic learning in early childhood education has occurred. Many states have developed or are in the process of developing standards for children’s knowledge and skills prior to entry into kindergarten (Scott-Little, Kagan, & Frelow, 2003), and a corresponding increase in expectations for preschool teachers to introduce academic content to young children has occurred (NAEYC & National Association of Early Childhood Specialists in State Departments of Education [NAECS/SDE], 2003).
In addition to a greater focus on academic learning, there has been an increase in the number of available full-day and full-year early childhood programs and a corresponding
increase in the enrollment of young children in these programs (NAEYC & NAECS/SDE, 2003). Approximately 27% of children three to five years of age were enrolled in public or private preprimary programs in 1965, while approximately 64% were enrolled in one of these types of programs in 2010 (U.S. Department of Education, National Center for Education Statistics [US ED/NCES], 2012a)1.
The increasingly higher attendance of early childcare programs and greater emphasis on young children’s development and knowledge of academic concepts have highlighted the need to improve the quality of early childhood education practices (Peisner-Feinberg et al., 2011; Wesley & Buysse, 2010). Research has demonstrated that “well-planned, evidence-based curriculum, implemented by qualified teachers who promote learning in appropriate ways, can contribute
4
significantly to positive outcomes for all children” (NAEYC & NAECS/SDE, 2003, p. 4). Selected school-age practices, such as response to intervention (RTI), are influencing early childhood professionals in their efforts to determine how to best support children’s learning in early childhood settings.
Response to Intervention (RTI)
Nationwide increases in elementary and secondary school enrollment and the number of high poverty schools have been reported, and statistical projections suggest educational
expenditures will steadily increase over the next decade (Aud et al., 2013; Hussar & Bailey, 2011). The provision of special education services contributes to these educational costs. Fuchs and Fuchs (2006) reported that on average, it costs school districts two to three times more to teach children with disabilities. According to the National Center for Education Statistics (US ED/NCES, 2012b), 13.1% (approximately 6.5 million children) of all children enrolled in public schools in the United States received federally supported special education services during the 2009-2010 academic year, in contrast to approximately eight percent of students during the 1976-1977 academic year (when the practice of evaluation for determining special education eligibility began). The rise in children receiving special education can largely be attributed to the upsurge in students identified as having a specific learning disability—from 1.8% of the total public school enrollment during the 1976-1977 school year to 4.9% during the 2009-2010 school year (US ED/NCES, 2012b). A specific learning disability is defined as
…a disorder in one or more of the basic psychological processes involved in
understanding or in using spoken or written language, which may manifest itself in an imperfect ability to listen, think, speak, read, write, spell, or do mathematical
5
Students with specific learning disabilities have historically represented the largest group of the 14 possible disabling conditions for eligibility for special education services (US
ED/NCES, 2012b). It is important to note, however, that while the number of students receiving special education remains the largest for the category of specific learning disability, there was an 18% decline in the number of students identified with a specific learning disability from 2002 to 2011 (Cortiella & Horowitz, 2014). In contrast, the total number of students receiving special education services only decreased by 3% during that time period (Cortiella & Horowitz, 2014).
Importantly, federal and state legislation currently allow for the identification of a
6
there is potential for some students to be falsely diagnosed with a learning disability when the true cause of their academic difficulties is poor instruction (Fuchs & Fuchs, 2006). Thus, the economic costs of special education, the host of problems associated with the discrepancy model, and the potential for the reduction in the number of children who require special education call for a preventive approach in education to most efficiently and effectively meet the overarching goal of educators to help all children learn.
Response to Intervention (RTI) is a framework geared towards the prevention of academic difficulties. The term RTI, most commonly known as Response to Intervention, also has other varied referents, such as Response to Instruction and Responsiveness to Intervention (Christ, Burns, & Ysseldyke, 2005). This idea is also commonly known by other acronyms, such as MTSS (Multi-Tier System of Supports; NCLD, n.d.). Components of RTI are found in other fields of work. For example, in the field of medicine, physicians employ key features of RTI in their treatment of physical diseases, such as using results from screening and progress
monitoring of a patient’s symptoms to determine the type and intensity level of intervention to prescribe (Gresham, 2007).
7
& Fuchs, 2003). Because students do not have to “wait to fail” before receiving the support they need, teachers are able to intervene early to help ensure that all children can have academic success (Coleman, et al., 2006; Peisner-Feinberg, et al., 2011; Vaughn & Fuchs, 2003). This early intervening is designed to help prevent academic problems for those who are experiencing difficulties, while also differentiating students whose difficulties are due to factors such as inadequate instruction from those who are truly learning disabled (Coleman, et al., 2006). Research has demonstrated significant positive effects of early identification and intervention for children with or at risk for disabilities (e.g., Shonkoff & Meisels, as cited in NAEYC &
NAECS/SDE, 2003; National Early Literacy Panel [NELP], 2008).
There are a variety of RTI models with school-age children that are currently being used by educators and being evaluated by researchers. These models generally agree on the following key components for RTI: (a) implementation of a research-based core curriculum and effective instruction for all students, (b) data-based decision-making for instructional planning based on teacher-gathered data, and (c) planned interventions for students who need additional help in the classroom (Peisner-Feinberg, et al., 2011). Importantly, the curricula and interventions used in RTI implementation are to be empirically-supported (Glover, 2010), and decision-making processes are to involve collaboration between teachers and specialists (Coleman, et al., 2006).
As previously stated, RTI is a tiered approach to instruction. Tiered models are
8
students (at least 80%) should demonstrate successful learning. A universal screening is conducted in which all students are screened for academic difficulties. Tier two is for those students who did not successfully respond to tier one instruction, as demonstrated by their screening results. These students require more intensive instructional supports, which are often provided via small-group instruction. At tier two, students are regularly assessed to determine how well they are responding to the additional instruction they are receiving. Students who do not adequately progress with the aid of tier two interventions receive tier three instruction. At tier three, they receive more intensive and individualized supports, and are again regularly assessed to evaluate their response to the intervention. Notably, Glover (2010) did not refer to the inclusion or exclusion of special education at the final tier of the model. Some researchers (e.g., Kovaleski & Black, 2010) include special education services in their description of tier three, while others (e.g., Brown-Chidsey & Steege, 2005) make a point of having such services take place outside of the model.
Evidence for RTI. RTI has support for its practical application, as seen through its inclusion in public law, as well as a strong foundation of empirical support. In a recent publication by the National Center for Learning Disabilities (NCLD), RTI was included as a possible reason for the previously mentioned 18% decline in the number of students identified as learning disabled from the year 2002 through 2011 (Cortiella & Horowitz, 2014).
field-9
based RTI models. According to their analyses, students who attended schools implementing RTI demonstrated greater growth in academic skills, more time on task, and greater task completion during academic interventions than their peers attending non-RTI schools. Schools that implemented RTI also had fewer referrals to special education, fewer students placed in special education, less student time spent in special education, lower numbers of grade retention, and fewer students identified as having a specific learning disability.
Two Institute of Education Sciences (IES) practice guides have been produced that provide evidence for the key components of RTI and recommendations for using the model to help school-age students struggling in reading (Gersten et al., 2008) and math (Gersten et al., 2009). In the key area of assessment, Gersten and colleagues found that universal screening is predictive of students’ later performance in reading and math. The authors noted that conducting universal screenings of students’ reading and math skills at the beginning of the school year is an essential first step in identifying those who may need additional academic assistance. Gersten and colleagues also found research evidence in reading and math that progress monitoring can help teachers be more aware of their students’ skills and can result in a positive effect on the instructional decisions they make. Therefore, progress monitoring of students who receive tier two and tier three interventions was also recommended. Additionally, in the math guide, the authors recommended that practitioners conduct progress monitoring for students whose
screening results place them on the cusp of needing tier two intervention, in case they continue to make little progress and should need tier two intervention. Regarding the other fundamental components of RTI, an effective core curriculum and planned interventions, Gersten and
10
effective in helping children at risk for academic difficulties. The authors noted that reading and math interventions should be explicit, systematic, and address foundational skills in the
respective academic areas. RTI in Pre-K
Coleman, Buysse, and Neitzel (2006) conducted a research synthesis of 14 studies involving children between the ages of four and eight and implementation of at least one of the three major components of RTI (i.e., multiple tiers of intervention, a problem-solving or standard treatment protocol approach, an integrated data collection/assessment system for data-based decision-making). These studies varied in the functions of RTI within the study, the intervention agents (i.e., who implemented the intervention), the intervention period, the type of intervention approach (i.e., standard treatment protocol or problem-solving method), and the outcome
measures used. None of the studies implemented all three tiers of the model hierarchically, and many of the studies focused on intervention outcomes independent of the model. The majority of the studies were with children in first through third grade, with a focus on language and literacy. The synthesis found emerging evidence for the use of RTI with young children. For instance, it was found that kindergartners at risk for learning difficulties may be able to catch up with their peers by the first grade, if given the appropriate instructional supports during
kindergarten. Findings also showed that implementation of RTI in kindergarten may reduce the number of children placed in special education later in elementary school. Overall, the synthesis provided evidence that implementing RTI as early as kindergarten, if not earlier, may have positive effects on children’s academic success (Coleman, et al., 2006).
11
components of RTI emphasize the principles of good early childhood instruction. Kaiser and colleagues (2011) recommended that a three-tiered prevention-to-intervention approach should be used for the provision of early intervention to young children with or at risk for language impairments. Henry and Pianta (2011) pointed out the need for evidence-based core curricula and interventions, two hallmarks of RTI, with their finding that few pre-k teachers use such strategies to promote the development of language and literacy skills.
Available models. Given that the field of early childhood is in the early stages of implementing RTI frameworks, much of the literature concerning the use of RTI in pre-k is conceptual rather than empirical (e.g., Barnett, VanDerHeyden, & Witt, 2007; Snyder, Wixson, Talapatra, & Roach, 2008). However, a few different models of RTI do exist in the field, such as Building Blocks (Sandall & Schwartz, 2008, 2013), the Pyramid Model (Hemmeter & Fox, 2009; Hemmeter, Fox, & Snyder, 2013), and Recognition & Response (R&R; Buysse & Peisner-Feinberg, 2009, 2010; Buysse et al., 2013; Coleman et al., 2006; Peisner-Feinberg & Buysse, 2013; Peisner-Feinberg, et al., 2011). Building Blocks is designed to help preschool teachers include children with disabilities in their classrooms, while the Pyramid Model is designed to foster children’s social-emotional development. R&R can be used for a variety of academic skills (e.g., language and literacy, math, science).
Recognition & response (R&R). A closer look at R&R shows that it closely
12
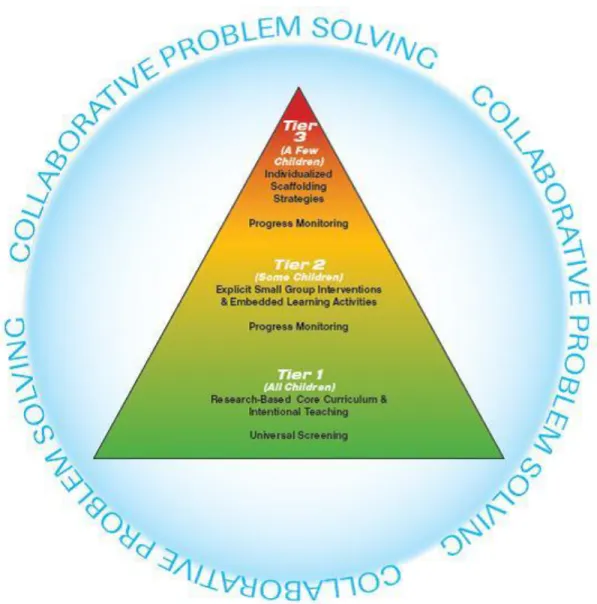
Recognition involves gathering information about children’s skills through universal screening of all children and progress monitoring of some children. Response includes providing an effective core curriculum for all children, in addition to targeted interventions for some children who need additional instructional supports to learn. Collaborative problem-solving is a process by which teachers, parents, specialists, and other professionals work together to plan and
evaluate the instruction children receive. Thus, R&R can be distinguished from other pre-k RTI models as it incorporates all key components of RTI, including an effective core curriculum and intentional teaching for all children, assessment of children’s skills for data-based decision-making, increasingly intensive, empirically-supported interventions, and a collaborative problem-solving process (Buysse & Peisner-Feinberg, 2010; Peisner-Feinberg, et al., 2011).
Overview of R&R framework. Figure 1 presents the conceptual framework for the R&R
model. At tier one of R&R, teachers implement a research-based, developmentally appropriate core curriculum for all children that addresses all domains of learning. They also conduct formative assessments of all children in their classroom. Universal screening is typically conducted three times during the year (i.e., fall, winter, spring) and involves brief measures of the skills of interest (e.g., language and literacy, math). It is recommended that each universal screening is completed within a period of approximately two weeks in order to keep all
13
intervention targeted at key skills in the particular learning domain being addressed by the model. The intervention is provided for a group of three to six children in daily sessions lasting approximately 15 minutes each for a period of approximately 8 to 10 weeks. Embedded learning activities are also provided at tier two. These activities provide opportunities for children to practice, generalize, and maintain skills learned in the small-group intervention outside of group sessions.
14
Tier three of the model is designed for those children who continue to demonstrate inadequate response to instruction. As with the first universal screening, children’s scores on the mid-year (winter) assessment are reviewed through a collaborative problem-solving process to identify: (a) the children who may need tier three individualized, intensive supports (i.e., children who received the tier two intervention but do not show adequate progress with this level of instruction), (b) children who continue to need support at tier two, (c) children who received support at tier two and no longer demonstrate a need for this level of support, and (d) children who did not make adequate progress in response to tier one instruction and therefore need tier two instructional supports.
Tier three instruction consists of a variety of intensive scaffolding strategies such as modeling, response prompting, peer supports, and corrective feedback. These strategies are primarily provided during the tier two intervention and embedded learning activities. As in tier two, teachers regularly conduct progress monitoring assessments during tier three to evaluate children’s response to the interventions, so that they can make any necessary adjustments.
Evidence for recognition & response. There is emerging evidence for the efficacy of the
R&R system. Two small-scale, quasi-experimental studies have been conducted to examine the feasibility, implementation fidelity, and efficacy of the R&R model (Buysse & Peisner-Feinberg, 2009; Buysse, Peisner-Feinberg, & Burchinal, 2012; Buysse et al., 2013; Buysse et al.,
manuscript submitted for publication).
15
in their classrooms. Results from these studies indicate that components of R&R can be implemented with high fidelity and are considered to be feasible and useful by classroom teachers. On formative and norm-referenced assessments of language and literacy skills, children who received tiered interventions (target children) demonstrated significantly greater gains in these skills in comparison with peers who did not receive the interventions.
Specifically, in Study 1, target children made greater gains in vocabulary, phonological awareness, and print knowledge, and in Study 2, greater gains were found in vocabulary, phonological awareness, and receptive and expressive language.
Assessment in Early Childhood
Numerous types of assessments serving a variety of purposes are currently available in the field of early childhood. First, because the focus of the current study is on the use of an early childhood measure of language and literacy skills, a brief overview of development in this domain is provided, as it is important to identify which skills a measure should assess to help determine a child’s instructional needs. A discussion of the types of assessments used in early childhood is then provided, followed by a brief review of best practices in the assessment of young children. Next, key factors in choosing an appropriate assessment for use in an RTI or R&R framework are presented and available measures for this purpose are discussed.
16
(Dickinson, McCabe, Anastasopoulos, Peisner-Feinberg, & Poe, 2003), information processing theories (e.g., LaBerge & Samuels, 1974), and stage theories (e.g., Ehri & Roberts, 2006).
Based on their review of 299 studies, the National Early Literacy Panel (NELP, 2008), a group of experts in literacy and early childhood, identified two key groups of skills: conventional and emergent literacy skills. The following were delineated as conventional literacy skills: decoding (i.e., forming recognizable spoken words by blending letter sounds; Ehri & Roberts, 2006), oral reading fluency, reading comprehension, spelling, and writing. The NELP (2008) found that conventional reading and writing skills developed from birth through age five have strong relationships with later conventional literacy skills. However, the NELP determined that most young children develop few conventional literacy skills prior to entering school. Rather, literacy development during the preschool period focuses more on emergent literacy skills. Consistent with previous definitions of emergent literacy (e.g., Whitehurst & Lonigan, 1998), the NELP defined emergent or early literacy skills as precursors to conventional literacy skills, and further defined them as skills that are predictive of or related to a conventional literacy skill and are present before the conventional literacy skill—generally, in preschool and kindergarten. The authors identified the following skills as emergent literacy skills, as they have medium to large predictive relationships with later conventional literacy skills: alphabet knowledge (i.e.,
17
An alternative approach to examining the skills identified by the NELP is provided by Wasik and Newman (2009). The authors acknowledge the validity of the two sets of skills presented by the NELP in that emergent literacy skills are typically learned earlier, while
conventional skills are learned later. However, the authors point out that there is overlap of some skills among the two sets and that treating the skills as distinct sets can be problematic,
particularly with regard to literacy instruction. For example, viewing literacy skills as separate, ordered sets can imply that children have mastered the first set by a particular time (e.g., entry into kindergarten), while in reality there is a wide range of skill mastery among children. Therefore, the authors present literacy skills developed from three to eight years of age on a continuum. This continuum has skills ordered based on research across the age span and shows when skills begin to develop, when some skills are typically fully developed, and which skills continue developing after age eight. According to this continuum, the following skills begin developing prior to school entry (i.e., age 5): oral language (receptive and expressive),
vocabulary, concepts of print, comprehension (read aloud), alphabet knowledge, phonological awareness (including phonemic awareness and phonics), writing, and content knowledge.
Types of assessment. Peisner-Feinberg and Buysse (2013) define child assessment as “a systematic process for gathering and documenting information about a child’s knowledge, skills, or abilities based on a sample of behavior” (p. 124). There are a variety of methods of
assessment appropriate for use with young children, including observations, documentation of children’s work, parent/teacher checklists and rating scales, portfolios, developmental
screenings, universal screenings/progress monitoring, and formal testing (NAEYC &
18
as physical, cognitive, social-emotional, receptive and expressive language, adaptive behavior skills, as well as knowledge of literacy and mathematical concepts.
Peisner-Feinberg and Buysse (2013) provide a comprehensive, yet succinct review of types of early childhood measures, which is summarized below. Authentic assessment involves caregiver recording of observations about a child’s behaviors and demonstrated skills in the child’s natural setting during normally occurring activities. Performance assessment consists of procedures such as collecting observations, completing checklists, gathering portfolios, and creating summary reports. Developmental screening refers to measures (e.g., rating scales, checklists, informal observations, brief assessments) designed to identify potential
19
informing instruction with regard to specific goals within a curriculum, and is therefore unsuitable for use in RTI.
Best practices. Regardless of the type of assessment, NAEYC & NAECS/SDE (2003) maintain that the ultimate goal of assessment is to make the early childhood program as effective as possible in order to ensure that every child benefits. These organizations delineate the
following “indicators of effectiveness” of assessments in their joint position statement: (a) assessments are used for their intended purposes, (b) assessments are appropriate for the ages and other characteristics of the children being assessed, (c) the skills that are assessed are
developmentally and educationally significant, (d) assessment evidence is used to understand and improve learning, (e) screening is always linked to follow-up (e.g., referral, intervention), and (f) use of individually administered, norm-referenced measures is limited (p. 11). Further, the organizations recommend that early childhood programs discuss early learning standards, program goals and standards, the curriculum currently in place, efficacy of administration time, ease of interpretation of results, and technical adequacy of the measure(s) being considered when choosing assessment tool(s) to use.
Assessment in RTI/R&R.
Characteristics of appropriate tools. In addition to the indicators of effectiveness
20
criterion-referenced (e.g., whether a child met a predetermined set of criteria). Second, the tool should measure skills that are tied to later achievement within the specific domain it is assessing (e.g., literacy). For instance, in the domain of language and literacy, an appropriate tool would measure the emergent literacy skills determined by the NELP (2008) to be predictive of later conventional literacy skills. Third, the tool should be sensitive to small increments of change in the skills it assesses, such that it can be used repeatedly to measure a child’s progress over time. Fourth, scores provided by the tool must demonstrate a child’s level of a skill, as well as his rate of growth. In other words, a child’s scores should be able to be meaningfully graphed to
demonstrate where he is based on norms or predetermined criteria, how much progress he is making over time, and how his rate of progress compares with expectations based on norms or criteria. Fifth, the tool should be easy to administer and administration time should be brief. If possible, the tool should be available via a technology-based platform (e.g., smartphone, tablet) and have online data storage. Sixth, with regard to technical adequacy mentioned by NAEYC & NAECS/SDE, the tool should demonstrate good reliability and validity. Seventh, the tool should demonstrate good sensitivity (i.e., accurately identify children who need additional instructional supports) and specificity (i.e., accurately identify children who do not need additional
instructional supports).
21
demonstrated that use of teacher’s ratings of children’s print knowledge alone was an inadequate method for evaluating these skills.
Available measures. For the school-age population, numerous CBMs are accessible
through commercially available (e.g., Dynamic Indicators of Basic early Literacy Skills [DIBELS], see http://www.dibels.uoregon.edu; easyCBM, see http://www.easyCBM.com/; AIMSweb, see http://www.aimsweb.com) and free products (e.g., Intervention Central, see http://www.interventioncentral.org). For the early childhood population, however, there are few appropriate measures currently available that meet the criteria for appropriate use in RTI or R&R, given that use of an RTI framework in the field is a relatively new approach. Two widely known measures at this time include the Individual Growth and Development Indicators
(myIGDIs; McConnell, Bradfield, Wackerle-Hollman, & Rodriguez, 2012; McConnell & Greenwood, 2013; McConnell & McEvoy, 1998; McConnell & Missall, 2008; McConnell, Priest, Davis, & McEvoy, 2002; Missall & McConnell, 2004) and the CIRCLE-Phonological Awareness, Language, and Literacy System+ (C-PALLS+; Landry, Assel, Gunnewig, & Swank, 2004a, 2004b, 2009; Landry, Assel, Anthony, & Swank, 2013).
Forms of myIGDIs are available for infants and toddlers, as well as for preschool children, and are available on the following website: http://www.myigdis.com/. The preschool form of myIGDIs currently has two versions of language and literacy assessments. The initial form (myIGDIs 1.0; McConnell & McEvoy, 1998) addresses oral language and phonological awareness skills and is appropriate for children three to five years of age. Adequate
22
was recently developed. It was designed as a screening tool and can be used in an RTI
framework. It includes subtests related to oral language, vocabulary, phonological awareness, alphabet knowledge, and comprehension and is appropriate for children four to five years of age. Technical adequacy of the second version has been established (McConnell et al., 2013).
MyIGDIs 2.0 is currently administered via a paper-and-pencil format; scores may be entered and managed on the assessment website. Seasonal benchmarks (i.e., fall, winter, spring) indicating “strong,” “moderate,” and “at-risk” progress have recently become available for both myIGDIs 1.0 and 2.0. National norms are available for myIGDIs 1.0; professionals may also enter their own data to create local norms. Children’s scores are plotted on a “trend line” to demonstrate their rate of progress; trend lines can be compared with “aim lines” based on either national or local norms.
23
tablets; http://www.mclasshome.com/). The measure was initially known as the C-PALLS when it consisted of only the three language and literacy subtests, but was renamed the C-PALLS+ when the math subtest was added. The C-PALLS+ is also sometimes referred to as the mCLASS:CIRCLE, a technology-based version of the measure available from Amplify (http://www.amplify.com/assessment/mclass-circle/).
Cut scores have recently been developed for each C-PALLS+ subtest based on standard scores on norm-referenced measures of similar constructs. The authors of the C-PALLS+ describe the cut scores as designed to help teachers identify which children are most at risk for difficulty with early academic tasks (Landry et al., 2013). For each age group (based on age at the beginning of the year), there is a cut score for each subtest at three separate administration time points—beginning, middle, and end of the year. Children’s scores are automatically coded to indicate “at risk” or “not at risk” on administration devices and online platforms used to store and manage data. Notably, information about the determination and calculation of the cut scores is currently only available in a recent book chapter by the authors of the measure (see Landry et al., 2013). Further, the information about the development of the cut scores in this chapter is minimal and somewhat unclear. For example, the authors state that “criteria for determining which children were at risk were broadened to take into account children who scored less than one standard deviation below the mean on the published outcome measures used in our validity studies” (Landry et al., 2013, p. 163). No further information is provided to explain to what extent the criteria were broadened or whether criteria differed across subtests.
Interpretation of scores. For the school-age population, various established benchmarks
24
measures such as the DIBELS, and, for decisions made following an intervention period, a “dual discrepancy” approach in which children’s level and rate of growth are compared with their peers (e.g., Burns & Senesac, 2005). The development and use of local norms (e.g., district, school level), in addition to or independent of the use of national norms or benchmarks has been recommended by numerous researchers (e.g., Brown-Chidsey & Steege, 2005; Speece & Hines, 2008; Stewart & Silberglitt, 2008; Wright, 2010). In contrast to national norms, which may not adequately represent a school’s population, local norms represent the actual population of and educational setting to which a student belongs, as the norms can be developed at the district, school, grade, and even classroom.
Given the limited number of assessment tools deemed appropriate for use in RTI or R&R in early childhood programs and the corresponding limited amount of research regarding the use of these tools in such frameworks, it is unsurprising that there are currently no widely agreed upon rules regarding how best to evaluate a child’s performance on these instruments. Regarding myIGDIs 1.0 and 2.0, professionals can choose to use the recently developed benchmarks to assess a child’s risk status; there is currently limited support for use of these benchmarks in the context of RTI in preschool settings. For myIGDIs 1.0, professionals may also choose to use either local or national norms; there are no set guidelines for the amount of growth needed to demonstrate adequate progress.
With regard to the C-PALLS+, use of the cut scores as they are intended by the
25
areas. Suggested core instructional activities are provided for each skill area for each
performance level (not at risk/at risk). In contrast, in the R&R model, the same core instruction is provided to all children in the classroom at tier one. Differentiation in instruction occurs at tier two, in which some children receive small-group instruction in language and literacy skills based on assessment results across the three skill areas. Therefore, if the cut scores were used to plan instruction in an RTI/R&R framework, they would be utilized to determine which children were demonstrating adequate performance in the skills assessed and which children need additional instructional supports to learn. Regarding evidence for use of the C-PALLS+ in an RTI/R&R framework, there is currently very little empirical support; there is no research examining the use of the cut scores in an RTI/R&R framework. In their recent book chapter (see Landry et al., 2013), the authors of the measure cite only two studies that have used the C-PALLS+ in an RTI or R&R context. One of these studies was R&R Study 1 (Buysse & Peisner-Feinberg, 2009), which was described earlier in this chapter; this study did not use the cut scores for instructional decision-making, as they were not available at the time of the study. Rather, it used a local norms approach in which children’s scores were rank ordered and the four lowest ranked children were selected to receive an intervention. The other study only used the Rapid
Vocabulary Naming subtest as a universal screening/progress monitoring tool and used an older set of cut points for the measure (Zucker, Solari, Landry, & Swank, 2012).
Validity
26
developing and evaluating tests” (p. 9). The process of validation refers to the interpretation of test scores for their intended uses, rather than the broad labeling of the test itself as valid.
According to Crocker and Algina (1986), there are three major types of validity: content, construct, and criterion. Content validity refers to how well test items represent a particular performance domain or construct; it is more of a qualitative measure of validity. With regard to examining the content validity of a tool such as the C-PALLS+, items should match the skills they are purported to measure. Construct validity refers to how well test items measure the intended construct. It can be further broken down into convergent validity (i.e., the relationship between two assessments intended to measure the same construct) and discriminant validity (i.e., the relationship between two assessments intended to measure different constructs). Considering the example of the C-PALLS+, children’s scores on the Rapid Vocabulary Naming subtest should align well with another measure of expressive language, but not as well with a measure of phonological awareness, and even less well with a measure of counting. Finally, criterion
validity relates to the inferences that can be drawn from an individual’s test score to their
performance on a criterion measured at approximately the same time (concurrent validity) or at a later time in the future (predictive validity). Concurrent validity of the C-PALLS+ could be defined as how well a child’s scores on the measure aligned with her teacher’s ratings of her language and literacy skills or her performance on another screening measure of similar skills, while predictive validity could be defined as how well a child’s scores on the C-PALLS+ in preschool predict his reading and math skills in second grade.
Current Study
27
Determining valid methods of interpretation will provide much needed guidance for early childhood administrators, educators, and other related professionals who are faced with deciding which formative assessment tool to use, and subsequently, how to use the assessment results.
The present study is a validation study of a method used to interpret preschool children’s universal screening scores. Its overarching goal was to examine the validity of the use of a local norms approach with the C-PALLS+ for instructional decision-making in an R&R framework. The current study utilized data from two previous studies in which the R&R system was applied to language and literacy instruction in early childhood settings and the C-PALLS+ (language and literacy subtests only) served as the formative assessment tool. Because the cut scores for the C-PALLS+ were not available at the times these studies were conducted, a local norms approach was used for instructional decision-making in which the children with the four lowest scores in each classroom were selected to receive a small-group intervention targeted at key language and literacy skills. In addition to the formative assessments, standardized, norm-referenced measures of language and literacy skills similar to those assessed by the C-PALLS+ (e.g., print knowledge, vocabulary, phonological awareness) were administered as outcome measures.
Research questions. In order to examine the validity of the local norms approach, the current study evaluated how similarly the local norms approach and other approaches (i.e., benchmarks on norm-referenced measures, cut points on the C-PALLS+) identified children in need of further instruction. Research questions for the current study examined the agreement of the local norms approach with other approaches and measures. These comparisons evaluated the similarity between target/comparison grouping via the local norms approach and (a)
28
determined by benchmarks applied to children’s scores on the norm-referenced measures, and (c) at-risk/not at-risk grouping by the cut scores approach developed by the authors of the
C-PALLS+, which involved cut points for each subtest of the measure.
Given that (a) the C-PALLS+ and the norm-referenced measures are purported to assess similar constructs, (b) all measures were administered at approximately the same time, and (c) all approaches resulted in dichotomous, performance-based grouping of children, it follows that similar classification of children across approaches and measures would provide support for use of the local norms approach in the context of the R&R system. Conversely, idiosyncratic classification by the local norms approach in comparison with the other approaches would suggest decreased support for the validity of its use in the R&R system. For the purposes of the current study, adequate agreement between the local norms approach and other methods of grouping was considered to be above chance. Chance agreement was set at 50%, with the assumption that if the target/comparison group classification were not accurate, children would be equally as likely to be classified as at-risk/not at-risk by other grouping methods.
The current study also examined whether the patterns of association between demographic characteristics and children’s scores were similar for the C-PALLS+ subtests compared to the various corresponding measures within the target and comparison groups, respectively. As with the comparison of the local norms approach to other approaches, similar patterns in associations between demographic characteristics and children’s scores within the target and comparison groups would lend support for the validity of use of the local norms approach in R&R, while dissimilar patterns would suggest otherwise.
29
1. Based on children’s scores on the standardized, norm-referenced measures, what percentage of children can be correctly classified into the target and comparison groups?
2. Based on the standardized, norm-referenced measures, to what extent are children in the target and comparison groups, respectively, identified as at-risk and not at-risk by benchmarks?
3. Comparing the cut scores approach with the local norms approach, to what extent are children in the target and comparison groups, respectively, identified as at-risk and not at-risk?
4. Within the target and comparison groups, do similar patterns in association occur between demographic characteristics and children’s scores on the formative assessment subtests and the corresponding norm-referenced assessments?
The first and second questions involved comparing classification of children based on the local norms approach with classification based on children’s performance on standardized, norm-referenced measures that assess constructs similar to those assessed by the C-PALLS+ subtests. The first question used discriminant function analysis to examine how well target and
comparison groups derived from the local norms approach can be determined using children’s scores on the norm-referenced measures. The second question compared local norms-based classification with classification based on four possible benchmarks applied to the
norm-referenced outcome measures. First, comparisons were conducted using a benchmark based on the norm-referenced measures that indicates possible risk for learning difficulties (the 30th
30
the local norms approach (24th percentile). Third, two additional benchmark, the 15th and 40th percentiles, were explored.
The third question compared local norms-based classification with classification based on the cut scores approach developed by the authors of the C-PALLS+, an approach that was not available when the original studies were conducted. Although there is no evidence for the validity of the use of the cut scores approach in the context of RTI/R&R, this is true for all current methods of interpreting C-PALLS+ scores. In contrast to the previous questions, this question addressed comparison of both approaches applied to the same set of scores. Because the cut scores approach can only be interpreted at the subtest level, criteria for at-risk/not at-risk group classification ranged from one PALLS+ subtest score in the at-risk range to all three C-PALLS+ subtest scores in the at-risk range.
31
CHAPTER 3: METHODS Participants
Original studies. The data for the current study were derived from two studies
conducted by researchers at the Frank Porter Graham (FPG) Child Development Institute at the University of North Carolina at Chapel Hill (UNC-Chapel Hill) called the Recognition & Response (R&R) Study 1 and R&R Study 2 (Buysse, et al., manuscript submitted for publication). These studies were led by principal investigators Virginia Buysse and Ellen Peisner-Feinberg. The author of the current study was a member of the R&R research team for the duration of both Study 1 and Study 2. R&R Study 1 and Study 2 were designed to examine the feasibility and fidelity of the implementation, social validity, and initial efficacy of the R&R system. Study 2 was conducted as a replication of Study 1, at a subsequent time and with a different sample of children in different child care settings.
R&R study 1. Study 1 was conducted during the first half of the 2008 – 2009 school year
(fall semester only) in community-based early childhood centers located in urban areas of
Florida and Maryland; it involved one intervention period. Tiers one and two of the R&R model were therefore implemented during Study 1.
R&R study 2. Study 2 was conducted during the 2009 – 2010 school year (fall and
32
Participating children and teachers. In Study 1 and Study 2, there were two teaching staff per classroom (a lead teacher and an assistant); teacher participants were the lead teachers of their classrooms. All participating classrooms were full-day programs. For the current study, participants include all teacher participants and target and comparison children.
R&R study 1. Study 1 included 24 pre-k teachers and 320 4-year-old children.
Classroom demographics are presented in Table 1. Twenty of the 24 participating classrooms were located in child care centers and 4 were in Head Start programs. The average class size was 18 children, with a staff to child ratio of one to nine.
Table 1
Classroom Characteristics and Settings
Characteristic
Study 1 (n = 24)
Study 2 (n = 24)
n % n %
Program setting
Child care 20 83.3
Head Start 4 16.7
Public pre-k 24 100
M SD Range M SD Range
Class size 17.6 4.4 11-30 17.7 1.6 15-20
Staff-child ratio 1:9 -- -- 1:9 -- --
Teacher demographics are presented in Table 2. All teacher participants in Study 1 were female. Seventy-five percent of the teacher participants were White, 21% were African
American, and 4% were of other races. Forty-six percent of teachers were of Latino ethnicity; 54% were not of Latino ethnicity. Regarding education level, 75% of teachers had a bachelor’s degree or higher. The remaining 25% of teacher’s had an associate’s degree.
norm-33
referenced outcome measures were administered only to a subset of children in each classroom (target and some comparison). Demographic characteristics are therefore presented separately for the full sample (see Table 3) and the sample with outcome measures (see Table 4).
Regarding the full sample, 53% of child participants were male and 47% were female. Sixty-eight percent of children were White, 24% were African American, and 8% were of other races. Fifty-one percent of the child participants were of Latino ethnicity; 49% were not of Latino ethnicity. Based on eligibility for child care subsidies, 47% of children were from low-income families. The average child age at the first universal screening (C-PALLS+) was 54 months, with a range of 48 to 62 months and standard deviation of 3.6 months. For the sample with outcome measures, 55% of child participants were male and 45% were female. Sixty-two percent of children were White, 29% were African American, and 9% were of other races. Forty-seven percent of child participants were of Latino ethnicity. The average child age at the first administration of the C-PALLS+ was 54 months, with a range of 48 to 62 months and a standard deviation of 3.6 months.
R&R study 2. Study 2 included 24 pre-k teachers and 339 4-year-old children.
Classroom demographics are presented in Table 1. All participating classrooms were pre-k classrooms in a large urban public school district. The average class size was 18 children, with a staff to child ratio of one to nine.
Teacher demographics are presented in Table 2. All teacher participants in Study 2 were female. Thirty-three percent of the teacher participants were White, 58% were African
34 Table 2
Demographic Characteristics of Teachers
Characteristic
Total (N = 48)
Study 1 (n = 24)
Study 2 (n = 24)
n % n % n %
Race
White 26 54.2 18 75.0 8 33.3
African American 19 39.6 5 20.8 14 58.3
Other 3 6.2 1 4.2 2 8.3
Latino ethnicity
Latino 13 27.1 11 45.8 2 8.3
Not Latino 35 72.9 13 54.2 22 91.7
Highest level of education
Associate’s degree 6 12.5 6 25.0 0 0.0
Bachelor’s degree 32 66.7 15 62.5 17 70.8
Master’s degree 10 20.8 3 12.5 7 29.2
Note. Other race category is inclusive of the following categories: American Indian, Alaska Native, Asian, Native Hawaiian and Other Pacific Islander, and unspecified race categories.
Child demographics are presented in Tables 3 and 4. The formative assessment tool and outcome measures were administered to all children in participating classrooms; therefore, child demographics are the same for the full sample (see Table 3) and the sample with outcome measures (see Table 4). Fifty-seven percent of child participants were male and 42% were female; gender was not reported for 1% of child participants. Twenty-five percent of children were White, 40% were African-American, and 11% were of other races. Race was not reported for 24% of child participants. Thirty-four percent of children were of Latino ethnicity; 64% were not of Latino ethnicity. Ethnicity was not reported for 2% of child participants. Based on
35
Table 3
Demographic Characteristics of Child Participants: Full Sample
Study 1 Study 2
Total (N = 659)
Total (n = 320)
Target (n = 95)
Comparison (n = 225)
Total (n = 339)
Target (n = 96)
Comparison (n = 243)
Characteristic n % n % n % n % n % n % n %
Gender
Male 361 54.8 169 52.8 55 57.9 114 50.7 192 56.6 48 50.0 144 59.3
Female 294 44.6 151 47.2 40 42.1 111 49.3 143 42.2 47 49.0 96 39.5
Not reported 4 0.6 0 0.0 4 1.2
Race
White 301 45.7 216 67.5 52 54.7 164 72.9 85 25.1 26 27.1 59 24.3
African American 214 32.5 77 24.1 32 33.7 45 20.0 137 40.4 26 27.1 111 45.7
Other 64 9.7 27 8.4 11 11.6 16 7.1 37 10.9 10 10.4 27 11.1
Not reported 80 12.1 0 0.0 80 23.6
Latino ethnicity
Latino 278 42.2 164 51.2 46 48.4 118 52.4 114 33.6 49 51.0 65 26.7
Not Latino 373 56.6 156 48.8 49 51.6 107 47.6 217 64.0 45 46.9 172 70.8
Not reported 8 1.2 0 0.0 8 2.4
36
Table 4
Demographic Characteristics of Child Participants: Sample with Outcome Measures
Study 1 Study 2
Total (N = 528)
Total (n = 189)
Target (n = 95)
Comparison (n = 94)
Total (n = 339)
Target (n = 96)
Comparison (n = 243)
Characteristic n % n % n % n % n % n % n %
Gender
Male 296 56.1 104 55.0 55 57.9 49 52.1 192 56.6 48 50.0 144 59.3
Female 228 43.2 85 45.0 40 42.1 45 47.9 143 42.2 47 49.0 96 39.5
Not reported 4 0.8 4 1.2
Race
White 203 38.4 118 62.4 52 54.7 66 70.2 85 25.1 26 27.1 59 24.3
African American 191 36.2 54 28.6 32 33.7 22 23.4 137 40.4 26 27.1 111 45.7
Other 54 10.2 17 9.0 11 11.6 6 6.4 37 10.9 10 10.4 27 11.1
Not reported 80 15.2 80 23.6
Latino ethnicity
Latino 203 38.5 89 47.1 46 48.4 43 45.7 114 33.6 49 51.0 65 26.7
Not Latino 317 60.0 100 52.9 49 51.6 51 54.3 217 64.0 45 46.9 172 70.8
Not reported 8 1.5 8 2.4
37
Exclusionary criteria for child participants. For both Study 1 and Study 2, the
intervention was determined to be inappropriate for some children. Children with moderate to severe disabilities, no demonstrated English language proficiency, and moderate to severe behavior problems were therefore excluded from the original studies and are excluded from the current study.
As previously noted, in contrast to Study 1, which involved one intervention period, Study 2 involved two intervention periods. Therefore, children’s target and comparison
classification remained the same in Study 1, but was able to vary in Study 2. In Study 2, children were identified as target or comparison following the first (fall) universal screening.
Classification was reexamined at the subsequent winter universal screening. Therefore, some target children who showed adequate progress on the winter universal screening were re-classified as comparison children and some comparison children who showed inadequate progress were re-classified as target children. Twenty children who were initially classified as comparison children based on fall universal screening results were re-classified as target children based on winter universal screening results. Because (a) the current study focused on the validity of target and comparison determination based on fall universal screening results and (b) these 20 children could not clearly be categorized in either the target or comparison group, they were excluded from the current study.
Protection of human subjects.
R&R study 1. The Study 1 protocol and procedures were approved by the University of
38
conducted in Florida and Maryland, at which time consent forms were distributed to teachers, and questions regarding the consent form and the overall study were addressed. Completed consent forms were returned by the close of the workshop. Potential child participants were identified by the R&R team after the first universal screening; selection of child participants is described in a subsequent section of this chapter. Teachers provided parents of potential child participants with recruitment flyers and consent forms in both English and Spanish, and collected completed consent forms. Copies of the completed forms were made to keep locally; the original forms were mailed to the research team. Although parent consent was not required for the
administration of the formative assessment, one child care center requested that parents provide consent for the collection of these data; the research team provided consent forms to parents of children attending classrooms at this center, and these teachers collected data only for children with parent consent.
Incentives for teacher participants in Study 1 included 200 dollars, a Palm Pilot loaded with the C-PALLS+ assessment software (a technology-based version of the
CIRCLE-Phonological Awareness, Language, and Literacy System+; C-PALLS+; Landry et al., 2013; Landry et al., 2004a, 2004b, 2009), curriculum materials, and professional development workshops. Parents of participating children received a 25 dollar gift card upon completion of the study. Child participants received a book and stickers after each individual child assessment conducted by FPG data collectors.
R&R study 2. Study 2 protocol and procedures were approved by the UNC-CH IRB on
39
participants distributed recruitment flyers and consent forms to parents of all children in their classrooms at the beginning of the school year, and collected completed consent forms.
Incentives for teacher participants in Study 2 included 200 dollars, professional development workshops, and continuing education credits. The school district received the curriculum materials and Palm Pilots loaded with the C-PALLS+ assessment software for each participating classroom. Child participants received a book and stickers after each individual child assessment conducted by FPG data collectors.
Current study. The current study protocol and procedures were approved by the
UNC-CH IRB on December 13, 2013 as study 13-3711. Procedures
For the purposes of the current study, key components of R&R Study 1 and Study 2 are first discussed in detail. Given that the focus of the current study was to examine the validity of the use of the C-PALLS+ in an R&R framework, these components include the formative assessments, use of these assessment results to select target and comparison children, and language and literacy outcomes, as measured by standardized, norm-referenced assessments. Other components of Study 1 and Study 2, including professional development, tier one and tier two instruction, and collaborative problem-solving, are then described in order to provide further context for the data being used in the current study.
Key components.
Formative assessment. The recognition component for both studies involved teacher
administration of a formative assessment tool called the C-PALLS+ (Landry et al., 2013; Landry et al., 2004a, 2004b, 2009). The C-PALLS+ is a standardized measure of children’s early
40
language and literacy subtests and one math subtest. Because Study 1 and Study 2 focused solely on language and literacy development, the math subtest was not administered.
The C-PALLS+ meets the criteria for formative assessment tool in that it (a) involves direct measurement of children’s language and literacy skills, (b) is criterion-referenced, (c) measures language and literacy skills linked to later developed skills, (d) is designed to be administered multiple times per year, (e) produces scores that indicate children’s level of each measured skill, (f) indicates a child’s progress in each skill through comparison of their score at one administration point to another, (g) is easy to administer, (h) has a short administration time, (i) is administered via a technology-based platform, and (j) demonstrates adequate reliability and validity. Teachers administered the assessment to all children in their classrooms twice in Study 1 (fall and winter) and three times in Study 2 (fall, winter, and spring). Children’s scores were stored and retrieved through a web-based system. Minor modifications were made to this system to prevent interference with implementation of R&R (e.g., removal of suggested instructional activities).
Selection of target and comparison children. For both studies, children’s scores on the
first universal screening (fall administration of the C-PALLS+) were used to determine which children needed additional instructional supports (i.e., small-group intervention). Children in the target group received the small-group intervention; children in the comparison group did not. Because cut scores were not available for the C-PALLS+ at the times Study 1 and Study 2 were conducted, a local norms approach was used in which children’s scores on each of the