5683
Review of ECG Signal Classification using Deep
Learning and Traditional Methods
Deepak H A,Dr.T.Vijayakumar
Abstract: Cardiovascular diseases correspond to the leading cause of death in the world and carry a high cost. In addition, the workforce of cardiologists is constantly decreasing. Therefore, automatic algorithms for the classification of heartbeats from electrocardiogram (ECG) registers have been developed. The classification of heartbeats from ECG records is a complex problem, with many edges and that, although several works have been developed that address the issue, it is not as clear which of them achieves better results, as there are discrepancies in the comparison and only those who adopt the same paradigm (intra-patient, inter-patient or patient-specific) are justly comparable. The ECG waveform has several deflections (waves). The analysis and automatic interpretation of this signal is often computer assisted using signal processing and pattern recognition techniques. This paper presents a theoretical review of deep learning and traditional methods based ECG classification.
Keywords: AAMI, ANN, CNN, DBN, DCT, DWT, ECG, FFT, GA, LDA, MIT-BIH, MLP, PCA, PNN, PSO, QRS complex, RBF, RBM, SVM, WHO, etc.
—————————— ——————————
1. INTRODUCTION
Biomedical signals are signals that decry the electrical activity produced by the different cells of the human body, they can be of cervical, muscular, cardiac origin, etc. Some of them are spontaneous and systematic actions of the human body such as electroencephalogram (EEG) or electrocardiogram (ECG), and others like the signal of visual evoked potential (VEP), are responses to stimulation exterior. However, the biomedical signal analysis procedures are sometimes common, so it is necessary to understand the behavior and the fundamental details of the generation of these signals, considering the end goal to extract the desired information. But sometimes, the method of analysis is specific and depends upon the signal to be studied and the data to be extracted. World Health Organization (WHO) states that the cardio-vascular disorder is the most widely recognized reason for death in the world.In this way, the determination of these unsafe diseases appears essential errand. In cardiology units at the hospital, the electrocardiogram (ECG) analysis stays one of the dominating and generally utilized tools for the cardiac investigation. From the ECG signal, some important parameters can be extracted. As a rule, the durations and shapes of different waves are considered indicative of some cardiac abnormalities. However, manual detection of characteristic ECG waveforms and classification of heartbeats are difficult and boring tasks especially for the analysis of long-term recordings such as Holter’s examination and ambulatory cases for continuous monitoring in halls resuscitation and intensive care.
Deepak H A, Research Scholar, Department of Electronics and Communication Engineering, SJBIT, Bangalore, Affiliated to VTU, India,+919739865862.Email:[email protected].
Dr.T.Vijayakumar,Professor, Department of Electronics and
Communication Engineering, SJBIT,Bangalore, Affiliated to VTU ,India. +919880371936.E- mail: [email protected]
5684 well placed on skin’s surface. The recorded information in
the ECG is presented as a series of electric waves, with particular shapes and durations that are repeated at each cardiac cycle. In reality these waves reflect the various mechanical phenomena relating to the potential of the cardiac stimulation and whose stages are successive as shown in Figure 1.
Figure 1: Successive depolarization / repolarization steps of the heart that are electrocardiographically translated by distinct P, QRS,
and T waves [8]
The following section describes the different waves and intervals for a normal ECG signal.
1.1 The Waves Recorded on a Normal ECG
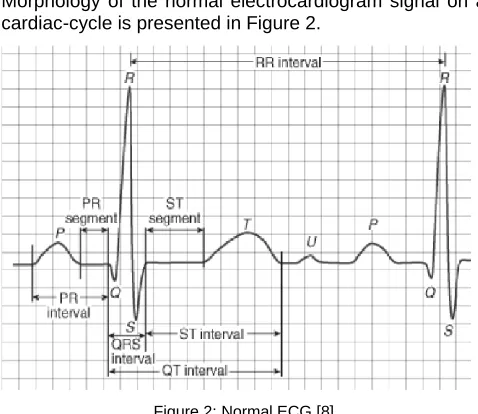
Morphology of the normal electrocardiogram signal on a cardiac-cycle is presented in Figure 2.
Figure 2: Normal ECG [8]
It is observed in an electrocardiographic signal that the process of contraction/relaxation of the myocardium is presented sequence of positive and negative deflections Superimposed on a line of zero potential (baseline) which
corresponds to the absence of cardiac phenomena as presented in Figure 2.
The P wave: This is the first detectable wave. It is reflected when the electric wave is propagated from the sinus-node to depolarize the atria (see Figure 1). Its relatively low muscle mass causes a low potential variation (less than 0.25 mv). The progression of the depolarization wave in the atria is much slower than in the ventricles. As a result, the region of the auricles around the sinus node is depolarized far in advance of the more distant regions. Then, the repolarization fronttakes the same meaning as the depolarization one and the instantaneous resultant vector is oriented towards the sinus node. This produces a repolarization wave in contrast to the P depolarization wave. Normally, the atrial repolarization wave appears when the QRS complex is produced. Since this signal is much more intense than the previous, the repolarizing wave is hidden. The QRS complex: It is a set of positive/negative deflections that correspond to the contraction of the ventricles. For a normal case, it has an interval less than 0.12 seconds and its variable amplitude is between 5 and 20 mV. Its shape is variable according to the derivations used (location of the electrodes) or a given arrhythmia. T wave: It associates to ventricular repolarization. It is normally of low amplitude and does not show any mechanical event. This wave succeeds the QRS complex after return to the isoelectric line. U wave: On some occasions, a wave, called the U wave, can be observed after the T wave. It is a wave of small amplitude and is visible in certain derivations, especially in athletes. The U wave is often associated with late ventricular repolarization processes, but the mechanism of its genesis is still debated In general, a plot of a normal electrocardiogram is as shown in Figure 2. The characterization of an ECG concerns the durations, amplitudes and morphology of the P, QRS and T waves as well as other temporal parameters which are the PR and ST segments, and the PR, QT and ST intervals.
1.2 Segments and Intervals that Characterize a Normal ECG
In addition to the different waves which are the basic parameters for a good characterization of an ECG signal, there are a number of intervals and segments that carry very useful information on the conduction velocity of the electrical pulse in different parts of the heart.
The most important intervals and segments are:
RR interval: The RR interval corresponds to the delay between two depolarization of the ventricles. It is this interval that calculates the heart rate.
PR segment (AV node pause): The segment PR correlated to the delay between the end of the depolarization of the auricles and the start of that of the ventricles. This is the time during which the depolarization wave is blocked at the AV node.
PR interval (Atrioventricular Conduction Time): The PR interval depends upon the propagation time of the depolarization wave of the sinus node to the ventricular myocardial cells.
5685 ST segment (Full Stimulation time of the Ventricles):
The ST segment corresponds to the phase during which the ventricular cells are all depolarized, the segment is then isoelectric.
1.3 Background
Cardio-vascular diseases are the leading cause of death in the world, it dies every year more people because of cardiovascular diseases than any other cause. Sudden death accounts for about half of heart-related deaths, the average age is between 50 and 60, but can occur at any age. The mechanisms of this sudden death are essentially ventricular rhythm disorders with 75% where the existence of ventricular extrasystole is noted as a possible predictor. An ECG electrocardiogram is a test that studies how the heart works by measuring its electrical activity. At each heartbeat, an electrical pulse or wave passes through the heart. This wave causes the heart muscle to contract so that it expels the blood from the heart. The ECG measures and records the electrical activity that goes through the heart. A doctor can determine if the electrical activity thus observed is normal or irregular. The automatic analysis of the ECG allows a detailed study that helps in the diagnosis of heart dysfunctions. Intelligent systems have emerged with the aim of making the best use of ECG data in large quantities and for which manual analysis is difficult. These systems make it possible to improve the quality of the signal (noise filtering), and the extraction of non-visible information whose data structure is hidden by a visual analysis. The operation of detecting predictive markers causing cardiac abnormalities (cardiac arrhythmias), is generally performed in four steps: preprocessing the signal, detecting the waves, extracting the relevant parameters, and classifying / discriminating abnormalities. The step of preprocessing (or filtering) the signal essentially consists in eliminating the different types of noise that affect the ECG signal during acquisition. The purpose of detecting predictive markers of cardiac arrhythmias is to locate the different waves of the ECG and measure their duration in an exact and reliable manner. The applied techniques cover a wide field of signal processing. Many algorithms and detection techniques exist in the literature, citing the method of Pan and Tompkins [9] and [10], as the QRS wave is the most coveted wave of the ECG by automatic analysis algorithms, and which is directly related to the ventricular functioning of the heart, so the detection of the R wave is the most sought after in the literature. After having detected the ECG signal, then comes the extraction / selection step which can be indicated under the name of the characteristic parameter vectors. Several techniques for selecting the relevant parameters can be used to reduce the dimension of the vector of parameters, whose purpose and increase the divergence between classes, by keeping the information sufficient to allow discrimination, which was the concern of several researchers such as [11, 12] who used the wavelet transform, and [13-14] who worked on RR intervals.
2. Literature Review
2.1 Traditional Methods of Heartbeat Classification A fully automatic ECG heartbeat classification system can be
divided into four sequential stages: preprocessing, heartbeat segmentation, feature extraction, and classification. This same form is adopted to present the review of the literature in this section.
2.1.1 Signal Preprocessing
The ECG signal is contaminated with noise of various kinds, which can be classified as [15]:
1. Power grid interference at 50 ± 2 Hz (or 60 Hz).
2. Noise from loss of contact between skin and electrodes. 3. Disturbances due to patient movement and electrodes. 4. Electromyography noise due to the electrical activity of
the muscles.
5. Baseline diversion, usually caused by breathing. 6. Noise of the device that performed the ECG recording. 7. Noise generated by other electrical equipment. 8. Quantization and sampling noise.
9. Disturbances due to signal processing.
The clinical staff has the ability to deal with signals that present noise, but automatic classification systems are negatively affected, so it is necessary to attenuate or eliminate them by filtering or removing signals [16]. Thus, different methods have been used, such as low-pass andhigh-pass linear phase filters to handle noise, while medium-sized filters, high-pass linear phase filters, filters have been used for baseline adjustmentof average median, etc. [17].In the literature review of Luz et al. [18] it was found that recursive digital filters of the finite impulse response (FIR) type work well to attenuate known frequencies, such as the frequency of the mains, but applying several filters without knowing the frequencies to attenuate can make the signal useless for the diagnosis of heart disease. For the latter case, adaptive filters of neural networks have been implemented, obtaining good results [18].Wavelet transform based methods deliver good results and are easy to implement. A variation of these is the multi-adaptive bionic wavelet transform that has delivered even better results [18].Other useful methods: non-linear Bayesian filters and extended Kalman filters (they are the ones that have the best effectiveness so far). The results are commonly expressed in signal-to-noise ratio [18].Luz et al. [18] explain that there is a lack of work with evaluation of the impact of the preprocessing of the ECG signal on the result of the subsequently used classifiers, so they propose this topic as a research area.
2.1.2 Segmentation of the Beats
5686 in what way, since the evaluation of the impact of different
segmentation methods on the classification of arrhythmias is a little research field explored [18].
2.1.3 Feature Extraction
One characteristic corresponds to any information extracted from a heartbeat used to determine the type of heartbeat. This stage can be subdivided into the very extraction of characteristics and the selection of the most representative.
A. Feature Extraction
The characteristics can be extracted from the morphology of the signal in the time and / or frequency domain, or from the heart rate [18]. According to Faust et al., Feature extraction methods can be classified into linear and nonlinear [18]:
Linear Methods: RR interval, frequency spectrum, Lorenz graph, first and second order statistics, discrete Wavelet transform (DWT), independent component analysis (ICA), principal component analysis (PCA), discriminant analysis linear (LDA) and discrete cosine transform (DCT).
Non-Linear Methods: Fractal characteristics, grouping by expectation-maximization and high-order statistics.
Jambukia et al. The following methods are added to the previous ones: Continuous Wavelet Transform (CWT), S
transform, discrete Fourier transform (DFT), wavelet daubechies and the Pan Tomkins algorithm [17].The most commonly used feature is the RR interval. Variations of this are used to reduce noise, such as the average RR over a period of time, which has been shown to deliver better results in the classification stage. Another feature that has been used is the duration of the QRS complex. One of the methods that delivers better accuracy is the extraction of time domain and frequency characteristics in conjunction with those extracted from the RR interval [18].To reduce the dimension of the feature vector (considered as the set of samples of a beat) different techniques have been used in the vicinity of the peak R, such as principal component analysis (PCA) and independent component analysis (ICA). PCA is better for reducing noise and ICA is better for extracting features, and its combined use presents better results than its individual use. Core component analysis with kernel (KPCA) is superior to PCA because of its non-linear structure. Other techniques used for feature reduction are clustering, generalized discriminant analysis (GDA), interpolation, random projections, linear predictive coding, high order accumulations, dimension correlation and greater Lyapunov exponent, Hermite transform and fractal dimension local [18].Most of the above-mentioned methods use the Wavelet transform, since it is considered the best option to extract information from the time and frequency domains. The relevant parameters of this transform are the mother wavelet function, the order of the filter and the level of decomposition; and can be optimized using particle swarm optimization (PSO). For the classification of heartbeats the best result in accuracy has been achieved using the wavelet function mother Daubechies of order 2 [18].Zhang et al. they extracted characteristics in the time domain and classified them into: inter-beat intervals, intra-beat intervals, morphological amplitudes, morphological areas and morphological distances; all based on the identification of ECG
fiducial points [19].
B. Feature Selection
The importance of this stage is that the most effective classification algorithms can only deal with a limited number of parameters and multiple works in the field of machine learning suggest maintaining the minimum possible amount of these [18].Few authors have investigated methods to select characteristics in the classification of arrhythmias. The selection of characteristics may have benefits in the classification of arrhythmias, such as increasing the power of generalization of the classification algorithms and reducing the computational cost [18].One of the methods used for this purpose is the floating sequential search that shows better results than those of the literature and using only 8 characteristics. Other methods that have been shown to deliver good results are genetic algorithms (GA) and particle swarm optimization (PSO). In one of the works included in the literature review of Luz et al. [18] identified as more important features the RR intervals, the amplitude and duration of the T wave, and second order statistics. In addition, the authors declare that it would be of great importance to better understand the correlation between heart disease and features extracted from ECG.
2.1.4 Classification
The purpose of automatic classification algorithms is to learn the patterns of each class (type of heartbeat) based on a feature vector and then use this knowledge when a new element (new heartbeat) is presented that does not have an assigned class. The process of using data with known tags in training models is called supervised learning; and otherwise, unsupervised learning [18]. Some of the methods used in the classification of beats by machine learning are:
A. Support Vector Machines (SVM)
Convert the patterns of the input vector to a space of features with larger dimensions, through non-linear mapping, and obtain a hyperplane of optimal separation between classes. For non-linear mapping, kernel transformations such as quadratic, polynomial and radial-based (RBF) functions [18], [21] are used.According to Luz et al. [18], this supervised learning algorithm is one of the most used in the classification of heartbeats. In their literature review, different variations of SVM are considered: combined with fuzzy logic, combined with a set of classifiers, genetic algorithms with diffuse diffuse SVMs and SVM with least squares. Since SVM has a bad behavior against class imbalances, some ways of handling it have been implemented, such as using SVM with hierarchical structure or SVM weighted by each class, but Luz et al. They warn that it is a little studied problem and they propose it as a topic of future research.
B.Artificial Neural Networks (ANN)
5687 they are robust to noise and are easily scalable. While its
disadvantages are that training algorithms do not ensure that the global optimum is reached and that it cannot necessarily find an optimum in very large problems [17].The most used ANN architectures in heartbeat classification are multilayer perceptrons (MLP) and probabilistic neural networks (PNN), the second being the most robust and computationally efficient; however, numerous ANN configurations have been proposed in the literature [18].
C. Linear Discriminators
They are statistical methods based on discriminant functions, which are estimated from a training set that is about separating linearly by adjusting a weight vector and a bias. The advantages of linear discriminators are that they can handle class imbalances and require less computational time for training (as it is not an iterative method). However, MLP has demonstrated markedly superior performance to this method [18].
D. Reservoir Computing
They correspond to dynamic models that seek to process a series of time, representing the signal through a non-adaptable dynamic reserve and applying a dynamic reading to that reserve. This technique is robust to class imbalance, has a low computational cost and obtains the best results in the works reviewed by Luz et al.[18].
E. Other
The use of the k nearest neighbor algorithm (kNN) leads to a high computational cost in the test stage, so its usefulness is limited in real-life scenarios. For their part, grouping techniques have been used in combination with ANN in order to improve the capacity for generalization and learning time of the latter. It has also been used: hidden Markov models, hypercube classifiers, optimal path forests and random conditional fields. Decision trees have not been widely used since they can only handle a small number of features and rule-based methods are the ones that have the worst performance [18].Faust et al. they expose other classifiers with supervised learning, such as: ADABoost (robust system of decisions from several weak learning systems), fuzzy classifiers, Gaussian mixture models, regression and classification trees, random forests and binary classification by thresholds [18].
2.2. Classification of ECG Signal with Deep Learning Following papers are focused on the classification of heartbeats from ECG signals using deep learning techniques. Yan et al. [22] implemented a deep belief network (DBN) based on restricted Boltzmann machines (RBM) to perform heartbeat classification from an ECG. The MIT-BIH database (DB) of arrhythmias was used considering the 2 derivations of each register and made the classification for 12 kinds of beats, only preprocessing the baseline deviation. The MBRs were used to generate the representations of the input signals and were trained with the method of the descending stochastic gradient. To form the 5-layer DBN, several RBMs were stacked and finally a softmax classifier was added; for the fine adjustment, the quasi-Newton optimization algorithm called L-BFGS was used. The results obtained are Acc = 98.83%, Se = 99.83 and Sp = 96.05%; although it should be noted that it is not specified about the signals that were used to train and evaluate the model.
Huanhuan et al. [23] performed the classification of heartbeats using DBN, neural networks (NN) and vector support machines (SVM), dividing its implementation into 2 stages: feature extraction and classification. After pre-processing the data with Wavelet's Daubechie 8, a feature vector was formed in 2 ways: extracting morphological characteristics of the signal (associated with the RR interval) and representations through 4-layer DBN based on RBM. For the classification stage, non-linear NN and SVM were used separately to compare results. The NN has 53 nodes in the input layer, 200 neurons in the hidden layer and 6 neurons in the output layer (corresponding to 6 kinds of beats), and was trained with the backward propagation (BP) method. Nonlinear SVM was tested with 3 different kernels: Gaussian, polynomial and quadratic. The DB of the MIT-BIH was used considering only the modified derivative II of the limbs and randomly selecting the training and test beats. The best results are obtained with the non-linear SVM classifier with Gaussian kernel that showed an Acc = 98.49%
.Kiranyaz et al. [24] present a heartbeat classification system based on the patient-specific paradigm and using convolutional neural networks (CNN). As for the preprocessing, each beat was subsampled to 64 and 128 samples and another representation of them was generated using the Fast Fourier transform (FFT). For feature extraction and classification, a 1D CNN with 3 layers attached to a multilayer perceptron (MLP) was used, which were trained using the BP method. The database of the MIT-BIH was used and divided into 20 patients for training and 24 for testing. A group of beats was randomly selected (from the training set) to form a common training set for all patients and thebeats of the first 5 minutes of each test set record (specific for each patient) were labeled.The results obtained for the VEB and SVEB classes are respectively Acc=98.6%, Se=95%, P+=89.5%, Acc=96.4%, Se=64.6% and P+=62.1%.
Rahhal et al. [25] present a heartbeat classification system based on the patient-specific paradigm using a deep learning hybrid architecture. The ECG signal was preprocessed by correcting the baseline and removing noise from the mains and high frequencies, to later subsample and segment it into 50 samples per beat. For the extraction of characteristics, stacked auto encoders with noise elimination (SDAE) and with dispersion restrictions were arranged, to obtain a representation of characteristics in an unsupervised manner; In addition, morphological characteristics based on the RR interval were included. Then, for the classification a softmax layer was used, forming a deep neural network (DNN).
The proposed model adjusts to the patterns of each patient through the intervention of an expert human who labels the most relevant and uncertain beats, selected according to 2 criteria: entropy and playoffs. The database of the MIT-BIH was used according to the recommendations of the AAMI and in addition 2 others were used: DB INCART and DB of supraventricular arrhythmia of the MIT. The best results obtained for SVEB and VEB respectively are Acc = 99.8%, Se = 96.7%, P+= 99.3%, Acc=99.9%, Se=98.8% and P+=99.7 %.
5688 Regarding the classification, an RNN was implemented which
was trained with the Levenberg-Marquardt algorithm and a multilayer perceptron (MLP). The results showed that the RNN is superior to the MLP because of sensitivity and specificity, while in accuracy the results were respectively Acc=98.06% and Acc=90.83%.
2.3 Heartbeat Classification Considerations
The Association for the Advancement of Medical Instrumentation (AAMI) developed standardization for the evaluation of heartbeat classification methods, called ANSI / AAMI EC57: 1998 / (R) 2008, where protocols are defined for experiments to be reproducible and comparable with others [27].
Most of the databases considered by the AAMI have labels related to the type of heartbeat or cardiac events, as well as some fiducial points of the ECG. The standard also refers to the way (or format) in which such labeling should be performed [18]. The AAMI standard recommends the use of the following databases (DB) [18]:
Arrhythmia DB of the Massachusetts Institute of Technology - Beth Israel Hospital (MIT-BIH) [28], [29]: It is the most widely used database in the literature. It contains 48 ECG records at 360Hz for approximately 30 min of 47 different adult patients and beat tags are available according to the AAMI standard. Each has 2 ECG leads, lead-A (modification of lead II of the extremities) and lead B (lead that can change between V1, V2, V5 or V4).
ST-T DB of the European Society of Cardiology (ESC)
[28], [30]: It contains 90 ECG records at 250Hz and 12-bit resolution, corresponding to 79 patients suffering from a specific heart disease (as the DB for the analysis of the ST segment and the T wave). Each record has a duration of about 2 hours and is presented in 2 leads. In addition, it has the beat tags according to the criteria of the AAMI.
DB for the evaluation of ventricular arrhythmia detectors of the American Heart Association (AHA) [31], [32]: Contains 154 ECG records at 250Hz and 12-bit resolution, showing 2 leads. Each record has a duration of 3 hours, but only the last 30 minutes have the beat type annotations and do not comply with the AAMI standard, since no distinction is made between normal sinus rhythm and SVEB.
DB of ventricular tachyarrhythmia of the University of Creighton [28], [33]: Contains 35 ECG registers at 250Hz and 12 bits, with a duration of 8 minutes each. It has annotations, but does not use all kinds of the standard.
DB stress test against noise [28], [34]: It has 3 and 12 half-hour records with and without noise, respectively. This DB was constructed from 2 signals from the DB of
the MIT-BIH, adding common interference in outpatient care. The mentioned DBs have a clear class imbalance, so several performance measures are required to evaluate the performance of the beat classification methods. Those recommended by the AAMI are: recall or sensitivity (Se), positive prediction or accuracy (P), false positive rate (FPR) and overall accuracy (Acc) [18], [27].
The AAMI standard does not include recommendations on
which beats or patients should be considered to train the classification model and which should be used in the test phase. It has been shown that using the beats of the same patient in both phases generates bias in the evaluation of the model, since the models learn particularities of the patient in training and then, in the test phase, display very optimistic results [18], [35]. There are 3 approaches to the development of classification models [18]:
Intra-patient: Beats from the same patient are used in the training and testing phases, and are chosen randomly.
Inter-patient: Beats are carefully divided into training and test sets, to prevent a patient's heartbeat from occurring in both groups.
Patient-specific: Corresponds to a semi-automatic classification approach, in which an expert human is involved, such as generating groups (clustering) with unsupervised learning techniques and then being labeled by experts.
Researchers warn that most papers do not worry about using the inter-patient paradigm, making comparisons between methods very difficult. Along these lines, they propose a work scheme to complement the AAMI standard and make the methods easily comparable [18]:
1. Selection of database: Use that of MIT-BIH under the inter-patient scheme and to test the ability to generalize use DB INCART.
2. Pre-processing: In addition to the methods to be used, it is also necessary to test the model with the unfiltered signal and also test it with the pre-processing performed by De Chazal et al. [35].
3. Segmentation: Add small distortions to the R wave recognition, to test how the model behaves.
4. Feature extraction: Use feature selection to assess which ones contribute the most and use differentiated feature selection for each class.
5. Classification: Use cross-validation for the training of the model and investigate the impact of class imbalance in the chosen classifier, showing the results with and without imbalance compensation techniques.
6. Evaluation: Present the results as suggested by the AAMI standard.
Luz et al. they conclude that semi-automatic approaches can improve results by 40% even with few beats used, however, these methods require the intervention of experts. In addition, they add that an important limitation in the progress of heartbeat classification is due to the small amount of DBs useful for this purpose [18].To conclude this section, in Table 1, a summary is presented with some of the works carried out under the inter-patient paradigm that have demonstrated the best results in the literature regarding accuracy (Acc) and that corresponds to an extract of the bibliographic review of Luz et al. [18].
5689
3. Conclusion
This paper presents a theoretical and fundamental aspects of ECG specification. Different noise removal techniques conduction by filter and adaptive filtering demonstrates the efficient outcomes. The literature also concludes the optimal threshold selection for noise removal is best possible solution. The literature also focus on feature extraction process specially QRS detection carried out by different authors and there methods. Detailed study of ECG Signal with Deep Learning and Heartbeat Classification implementation with extracted feature of ECG has been reviewed. Different works on beat classification and diseases classification are reviewed. Methods such as DWT, ICA, PCA and QRS complex etc. are used for feature extraction. Most of the approaches use PCA, LDA and DCT methods for dimensionality reduction of extracted features. KNN and mathematical morphology are used for QRS complex detection. The recent research works show various approaches for classification of ECG signal utilizing SVM, Random Forest and various forms of neural network techniques.
4. REFERENCES
[1] Friesen, Gary M., Thomas C. Jannett, ManalAfifyJadallah, Stanford L. Yates, Stephen R. Quint, and H. Troy Nagle. "A comparison of the noise sensitivity of nine QRS detection algorithms." IEEE Transactions on biomedical engineering 37, no. 1 (1990): 85-98.
[2] Xue, Qiuzhen, Yu Hen Hu, and Willis J. Tompkins. "Neural-network-based adaptive matched filtering for QRS detection." IEEE Transactions on Biomedical Engineering 39, no. 4 (1992): 317-329.
[3] Li, Cuiwei, ChongxunZheng, and Changfeng Tai. "Detection of ECG characteristic points using wavelet transforms." IEEE Transactions on biomedical Engineering 42, no. 1 (1995): 21-28. [4] Hilton, Michael L. "Wavelet and wavelet packet
compression of electrocardiograms." IEEE Transactions on Biomedical Engineering 44, no. 5 (1997): 394-402.
[5] Zeid, M., and M. Edward Womble. "Application of partitioned Karhunen–Loeve expansion scheme of ECG/VCG data compression." In Proceedings of the VIII N England Bio-Eng Conference, pp. 102-105. 1979.
[6] Reddy, BR Shankara, and I. S. N. Murthy. "ECG data compression using Fourier descriptors." IEEE
Transactions on Biomedical Engineering 4 (1986): 428-434.
[7] Lawson, W. T., G. S. Wagner, R. S. Startt-Selvester, and G. A. Ybarra. "New method for digitization and computerized analysis of paper recordings of standard 12-lead electrocardiograms." In Computers in Cardiology 1995, pp. 41-44. IEEE, 1995.
[8] de Luna, Antonio Bayés. Textbook of clinical electrocardiography. Springer Science & Business Media, 2012.
[9] Pan, Jiapu, and Willis J. Tompkins. "A real-time QRS detection algorithm." IEEE Trans. Biomed. Eng 32, no. 3 (1985): 230-236.
[10] Shadmand, Shirin, and BehboodMashoufi. "A new
personalized ECG signal classification algorithm using block-based neural network and particle swarm optimization." Biomedical Signal Processing and Control 25 (2016): 12-23.
[11] Mahapatra, Sakuntala, DebasisMohanta,
PrasantMohanty, SantanukumarNayak, and PranabkumarBehari. "A Neuro-fuzzy based model for analysis of an ECG signal using Wavelet Packet Tree." Procedia Computer Science 92 (2016): 175-180.
[12] Acharya, U. Rajendra, ShuLih Oh, Yuki Hagiwara, Jen Hong Tan, Muhammad Adam, ArkadiuszGertych, and Ru San Tan. "A deep convolutional neural network model to classify heartbeats." Computers in biology and medicine 89 (2017): 389-396.
[13] Chen, Shanshan, Wei Hua, Zhi Li, Jian Li, and
XingjiaoGao. "Heartbeat classification using projected and dynamic features of ECG signal." Biomedical Signal Processing and Control 31 (2017): 165-173. [14] Kim, Jaeyoung, and PinakiMazumder. "Energy-efficient
hardware architecture of self-organizing map for ECG clustering in 65-nm CMOS." IEEE Transactions on Circuits and Systems II: Express Briefs 64, no. 9 (2017): 1097-1101.
[15] Clifford, Gari D., Francisco Azuaje, and Patrick
Mcsharry. "ECG statistics, noise, artifacts, and missing data." Advanced methods and tools for ECG data analysis 6 (2006): 18.
[16] Faust, Oliver, and Eddie YK Ng. "Computer aided diagnosis for cardiovascular diseases based on ECG signals: A Survey." Journal of Mechanics in Medicine and Biology 16, no. 01 (2016): 1640001.
[17] Jambukia, Shweta H., Vipul K. Dabhi, and
Harshadkumar B. Prajapati. "Classification of ECG signals using machine learning techniques: A survey." In 2015 International Conference on Advances in Computer Engineering and Applications, pp. 714-721. IEEE, 2015.
[18] Luz, Eduardo José da S., William Robson Schwartz,
Guillermo Cámara-Chávez, and David Menotti. "ECG-based heartbeat classification for arrhythmia detection: A survey." Computer methods and programs in biomedicine 127 (2016): 144-164.
[19] Zhang, Zhancheng, Jun Dong, XiaoqingLuo, Kup-Sze
5690 disease-specific feature selection." Computers in
biology and medicine 46 (2014): 79-89.
[20] Velic, Marko, Ivan Padavic, and Sinisa Car.
"Computer aided ECG analysis—State of the art and upcoming challenges." In Eurocon 2013, pp. 1778-1784. IEEE, 2013.
[21] Elhaj, Fatin A., NaomieSalim, Arief R. Harris, Tan TianSwee, and Taqwa Ahmed. "Arrhythmia recognition and classification using combined linear and nonlinear features of ECG signals." Computer methods and programs in biomedicine 127 (2016): 52-63.
[22] Yan, Yan, Xinbing Qin, Yige Wu, Nannan Zhang,
Jianping Fan, and Lei Wang. "A restricted
Boltzmann machine based two-lead
electrocardiography classification." In BSN, pp. 1-9. 2015.
[23] Huanhuan, Meng, and Zhang Yue. "Classification of electrocardiogram signals with deep belief networks." In 2014 IEEE 17th International Conference on Computational Science and Engineering, pp. 7-12. IEEE, 2014.
[24] Kiranyaz, Serkan, TurkerInce, and MoncefGabbouj.
"Real-time patient-specific ECG classification by 1-D convolutional neural networks." IEEE Transactions on Biomedical Engineering 63, no. 3 (2015): 664-675.
[25] Al Rahhal, Mohamad Mahmoud, YakoubBazi,
HaikelAlHichri, NaifAlajlan, FaridMelgani, and Ronald R. Yager. "Deep learning approach for active classification of electrocardiogram signals." Information Sciences 345 (2016): 340-354.
[26] Übeyli, ElifDerya. "Combining recurrent neural
networks with eigenvector methods for classification of ECG beats." Digital Signal Processing 19, no. 2 (2009): 320-329.
[27] Chan, Richard. "Association for the Advancement of Medical Instrumentation/International Organization for Standards: key to perfusion quality management and safety one patient at a time." The journal of extra-corporeal technology 43, no. 4 (2011): 187.
[28] Goldberger, Ary L., Luis AN Amaral, Leon Glass,
Jeffrey M. Hausdorff, PlamenChIvanov, Roger G. Mark, Joseph E. Mietus, George B. Moody, Chung-Kang Peng, and H. Eugene Stanley. "PhysioBank, PhysioToolkit, and PhysioNet: components of a new research resource for complex physiologic signals." Circulation 101, no. 23 (2000): e215-e220.
[29] Moody, George B., and Roger G. Mark. "The impact of the MIT-BIH arrhythmia database." IEEE Engineering in Medicine and Biology Magazine 20, no. 3 (2001): 45-50.
[30] Taddei, A., G. Distante, M. Emdin, P. Pisani, G. B. Moody, C. Zeelenberg, and C. Marchesi. "The European ST-T database: standard for evaluating systems for the analysis of ST-T changes in ambulatory electrocardiography." European heart journal 13, no. 9 (1992): 1164-1172.
[31] “American Heart Association ECG Database DVD”,
ECRI Institute. Online available at:
https://www.ecri.org/american-heart-association-ecg-database-usb. [Accessed: 10-November-2019]. [32] Hermes, Russell E., David B. Geselowitz, and George
Oliver. "Development, distribution, and use of the American Heart Association database for ventricular arrhythmia detector evaluation." Computers in cardiology (1980): 263-266.
[33] Nolle, F. M., F. K. Badura, J. M. Catlett, R. W. Bowser,
and M. H. Sketch. "CREI-GARD, a new concept in computerized arrhythmia monitoring systems." Computers in Cardiology 13 (1986): 515-518.
[34] Moody, George B., W. Muldrow, and Roger G. Mark. "A
noise stress test for arrhythmia detectors." Computers in cardiology 11, no. 3 (1984): 381-384.
[35] De Chazal, Philip, Maria O'Dwyer, and Richard B.
Reilly. "Automatic classification of heartbeats using ECG morphology and heartbeat interval features." IEEE transactions on biomedical engineering 51, no. 7 (2004): 1196-1206.
[36] Escalona-Morán, Miguel Angel, Miguel C. Soriano, Ingo
Fischer, and Claudio R. Mirasso. "Electrocardiogram classification using reservoir computing with logistic regression." IEEE Journal of Biomedical and health Informatics 19, no. 3 (2014): 892-898.
[37] Lin, Chun-Cheng, and Chun-Min Yang. "Heartbeat
classification using normalized RR intervals and morphological features." Mathematical Problems in Engineering 2014 (2014).
[38] Llamedo, Mariano, and Juan Pablo Martínez.
"Heartbeat classification using feature selection driven by database generalization criteria." IEEE Transactions on Biomedical Engineering 58, no. 3 (2010): 616-625.
[39] Bazi, Yakoub, NaifAlajlan, HaikelAlHichri, and