189 | P a g e
AN APPLICATION TRACING ONLINE SHORTEST
PATH COMPUTATION
G Trimurthulu
1, M. Ashok Kumar
2, B. Suresh
31
PursuingM.Tech (CSE), 2Assistant Professor,3Head of the Department. Department of CSE Vikas Group of Institutions, Nunna, Vijayawada, AP, Affiliated to JNTUK, (India)
ABSTRACT
For finding shortest path between source and destination is based on live traffic circumstances. This is the most
significant way in modern car navigation systems it is helps for drivers to take correct directions and shortest
direction at the time of travelling. There is no effective solution /system that can suggest affordableprices at
both customer and server sides for finding online shortest path. Unfortunately, the predictable client-server
model is lack off scales with the number of clients.A promising methodology is to let the server gather live
movement data and after that show them over radio or remote system. This methodology has incredible
adaptability with the quantity of customers. Along these lines, we build up another system called live activity file
(LTI) which empowers drivers to rapidly and successfully gather the live movement data on the TV channel. An
amazing result is that the driver can figure/upgrade their most limited way come about by accepting just a little
division of the list. Our trial study demonstrates that LTI is vigorous to different parameters and it offers
moderately short tune-in expense (at customer side), quick inquiry reaction time (at customer side), little show
size (at server side), and light upkeep time (at server side) for online most brief way issue.
I. INTRODUCTION
Shortest path calculation is an important purpose in current car celestial navigation systems and has been widely
studied. This capacity helps a driver to make sense of the best course from his flow position to destination.
Commonly, the most brief way is registered by offline from the net information pre-secured in the course
structures and the weight (travel time) of the road edges is evaluated by the road detachment or recorded data.
Unfortunately, road action circumstances change after some time. Without live development circumstances, the
course returned by the course structure is no more guaranteed a precise result. We show this by a case in Fig. 1.
Accept that we are driving from Lord and Taylor (name A) to Mt Vernon Hotel Museum (name B) in
Manhattan, NY. Those old course structures would .Propose a course in light of the pre-secured partition
information as showed up in Fig. 1(a). Note this course experiences four road upkeep operations (exhibited by
bolster images) and one development congested road (appeared by a red line). Frankly, if we consider
movement circumstances,Present days, a few online administrations give live movement information (by
examining gathered information from street sensors, activity cameras, and crowdsourcing procedures, for
example, GoogleMap, Navteq, INRIX Traffic Information Provider and TomTom and so forth. These
frameworks can figure the preview most brief way questions in view of momentum live movement information;
190 | P a g e
most brief ways on the live movement information can be seen as a persistent observing issue in spatial
databases, which is termed online briefest ways calculation (OSP) in this work. To the best of our insight, this
issue has not got much consideration and the expenses of noting such nonstop questions change gigantically in
diverse framework architectures.
Regular customer server structural engineering can be utilized to answer most brief way inquiries on live
activity information. For this situation, the route framework ordinarily sends the most limited way question to
the administration supplier and holds up the outcome once again from the supplier (called result transmission
model). Then again, given the quick development of cell phones and administrations, this model is confronting
versatility confinements as far as system data transfer capacity and server stacking. As per the Cisco Visual
Networking Index estimate [13], worldwide portable movement in 2010 was 237 petabytes for every month and
it developed by 2.6-fold in 2010, almost tripling for the third year in succession. In view of a telecom master
[14], the world's cell systems need to give 100 times the limit in 2015 when contrasted with the systems in 2011.
Besides, live movement are redesigned every now and again as these information may be gathered by utilizing
crowd sourcing systems (e.g., unknown activity information from Google map clients on certain cell phones).
All things considered, gigantic correspondence expense will be spent on sending result ways on the model.
Clearly, the customer server structural planning will soon get to be unrealistic in managing Massive live
movement in not so distant future. Ku et al. [15] bring the same worry up in their work which forms spatial
questions in remote show situations in view of Euclidean separation metric. Malviya et al. [16] added to a
customer server framework for constant checking of enlisted most limited way inquiries. For each enlisted
question (s; t), the server first precompiles K diverse applicant ways from s to t. At that point, the server
intermittently redesigns the travel times on these K ways in view of the most recent activity, and reports the
present best way to the comparing client. Since this framework embraces the customer server construction
modeling, it can't scale well with countless, as talked about above. What's more, the reported ways are inexact
results and the framework does not give any precision ensure.
The principle challenge on noting live most brief ways is adaptability, as far as the quantity of customers and the
measure of live activity overhauls. Another and promising answer for the most limited way calculation is to
show an air file over the remote system (called file transmission model) [17][18]. The principle preferences of
this model are that the system overhead is autonomous of the quantity of customers and each customer just
downloads a part of the whole guide as per the file data. Case in point, the proposed record in [17] constitutes an
arrangement of pairwise least and most extreme voyaging expenses between each two sub-segments of the
guide. Be that as it may, these routines just settle the versatility issue for the quantity of customers however not
for the measure of live movement upgrades. As reported in [17], the re-calculation time of the file takes 2 hours
for the San Francisco (CA) guide. It is restrictively costly to upgrade the record for OSP, so as to stay aware of
live activity circumstances. Inspired by the absence of off-the-rack answer for OSP, in this paper we display
another arrangement introducing so as to take into account the file transmission model live Traffic index (LTI)
as the middle technique. LTI is depended upon to give by and large short tune-in cost (at client side), speedy
inquiry response time (at client side), little show size (at server side), and light upkeep time (at server side) for
191 | P a g e
The file structure of LTI is enhanced by two novel strategies, chart parceling and stochastic-based
development, in the wake of directing an exhaustive examination the various leveled file procedures
[19][20][21]. To the best of our insight, this is the first work to give an exhaustive expense examination on
the progressive file systems and apply stochastic procedure to streamline the record various leveled
structure.
LTI specifically gets information in remote show situations, which essentially decrease the tune-in expense.
LTI proficiently keeps up the record for live activity circumstances by fusing Dynamic Shortest Path Tree
(DSPT) [22] into various leveled list systems. What's more, a limited adaptation of DSPT is proposed to
further lessen the show overhead.
By joining the above components, LTI diminishes the tune-in expense up to a request of size when
contrasted with the cutting edge contenders; while despite everything it gives focused question reaction
time, telecast size, and upkeep time. To the best of our insight, we are the first work that endeavors to
minimize all these execution elements
The rest of the paper is organized as follows. We first introduce main performance factors for evaluating OSP
and overview the state-of-the-art shortest path computation methods.
II. LTI OVERVIEW AND OBJECTIVES
2.1 LTI Overview
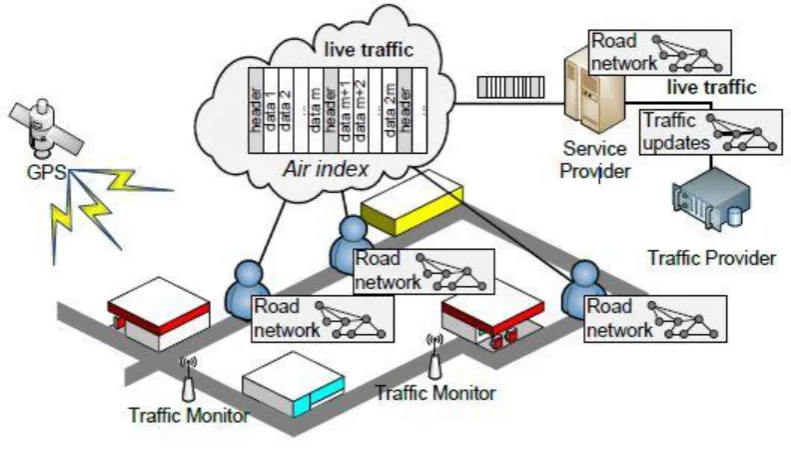
A road network monitoring system typically consists of aservice provider, an expansive number of versatile
customers (e.g., vehicles), and an activity supplier (e.g., GoogleMap, NAVTEQ, INRIX, and so on.). Fig.1
demonstrates a structural diagram of this framework in the connection of our live activity file (LTI) system. The
activity supplier gathers the live movement circumstances from the movement screens by means of procedures
like street sensors and movement video examination. The administration supplier occasionally gets live
movement upgrades from the activity supplier and telecasts the live activity list on radio or remote system (e.g.,
3G, LTE, Mobile WiMAX, and so forth.). At the point when a versatile customer wishes to figure and screen a
most limited way, it listens to the live activity file and peruses the important part of the record for determining
the briefest way.
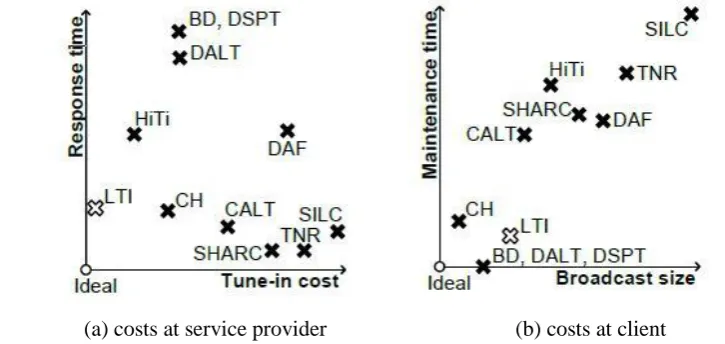
(a) costs at service provider
(b) costs at client
192 | P a g e
In this work, we concentrate on taking care of movement redesigns yet not chart structure overhauls. For
genuine street systems, it is occasional to have chart structure upgrades (i.e., development of another street)
when contrasted with edge weight redesigns (i.e., live activity circumstances). In this way, we accept that the
diagram structures are disseminated to each customer ahead of time (e.g., by month to month redesigns or at
framework boot-up) by means of ordinary transmission convention (i.e., HTTP and FTP).
Fig. 2. LTI System Overview
In Fig.2, we illustrate the components and system flow in our LTI framework. The components shaded bygray
color are the core of LTI. In order to provide live traffic information, the server maintains (component a) and
broadcasts (component b) the index according to the up-to-date traffic circumstances. In order to compute the
online shortest path,a client listens to the live traffic index, reads the relevant Portions of the index (component
c), and computes theshortest path (component d).
2.2 LTI Objectives
To upgrade the execution of the LTI segments, our answer ought to bolster the accompanying components.
(1) Efficient upkeep system. Without proficient support technique, long upkeep time is required at server side so
that the activity data is no more live. This can lessen the upkeep time spent at part a.
Client Service ProviderTraffic Provider
communication communica
Fig. 3. Components in LTI
Query q(s.d)
(c) Tune – in & listen relevant packects
(d) compute result for q(s,d)
(b) Broadcast index
(a)Maintain index
Receive traffic updates
193 | P a g e
(2) Light index overhead. The record size must be controlled in a sensible proportion to the whole guide
information. This diminishes the length of a telecast cycle, as well as makes customers listen less parcels in the
show station. This can spare the correspondence cost at parts b and c
(3) Efficient computation on a segment of whole record. This property empowers customers to register most
brief way on a bit of the whole list. The calculation at part d gets enhanced since it is executed on a littler chart.
This property likewise lessens the measure of information got and vitality devoured at part c. Roused by these
properties, LTI has moderately short tune-in expense (at customer side), quick question reaction time (at
customer side), little telecast size (at server side), and light file upkeep time (at server side) for OSP. As talked
about in Section 2.2, the progressive list structures empower customers to figure the most limited way on a
segment of whole file. Be that as it may, without matching up with the first and second components, the
correspondence and calculation expenses are still infeasible for OSP. To accomplish these two elements, in
Section 4 and Section 6, we will talk about how to enhance the various leveled structure and productively keep
up the record as indicated by live activity circumstances.
III. LTI TRANSMISSION
In this section, we present how to transmit LTI on the airindex. We first introduce a popular broadcasting
schemecalled the (1;m) interleaving scheme in Section 5.1. Basedon this broadcasting scheme, we study how to
broadcast LTIin Section 5.2 and how a client receives edge updates onair .
3.1 Broadcasting Scheme
The broadcasting model uses radio or wireless network(e.g., 3G, LTE, Mobile WiMAX) as the transmission
medium. When the server broadcasts a dataset (i.e., a “programme”),all clients can listen to the dataset
concurrently. Thus, this transmission model scales well independent of the number of clients. A broadcasting
scheme is a protocol to be followed by the server and the clients.
Header i:0, n:6
Data 01, 02
Header i:2, n:6
Data 03, 04
Header i:4, n:6
Data 05, 06
The (1,m) interleaving plan [23] is one of the best TV plans. Table 1 demonstrates an illustration television
cycle with m = 3 bundles and the whole dataset contains 6 information things. To start with, the server parcels
the dataset into m equi-sized information sections. Every bundle contains a header and an information fragment,
where a header portrays the TV calendar of all parcels. In this sample, the variables i and n in every header
speak to the last telecasted thing and the aggregate number of things. The server intermittently shows a
succession of parcels (called as a telecast cycle).
We utilize a solid sample to show how a customer gets her information from the telecast station. Assume that a
customer wishes to question for the information object o5. To start with, the customer tunes in the telecast
194 | P a g e
the first parcel, and figures out that the third bundle contains o5. So as to safeguard vitality, the customer rests
until the TV time of that parcel. At that point, it wake-ups and peruses the asked for information thing from the
parcel.
The inquiry execution can be measured by the tuning time and the holding up time at the customer side. The
tuning time is the ideal opportunity for perusing the bundles. The holding up time is the time from the begin
time to the end time of the inquiry. In this television conspire, the parameter m chooses the exchange off
between tune-in size and the overhead. An extensive m supports little tune-in size though a little m causes little
holding up time. [23] recommends to set m to the square base of the proportion of the information size to the list
size.
IV. LTI ON AIR
To broadcast a hierarchical index using the (1,m) interleaving scheme, we first partition the index into two
components: the index structure and the weight of edges. The former stores the index structure (e.g., graph
vertices, graph edges, and shortcut edges) and the latter stores the weight of edges. In order to keep the freshness
of LTI, our system is required to broadcast the latest weight of edges.
The arrangement of a header/information parcel in our model. id is the balance of the parcel in the present show
cycle and checksum is utilized for mistake checking of the header and information. Note that the parcel does not
store any counterbalance data to the following telecast cycle or show fragment. The balance can be coordinated
up by the relating id since the structure of LTI is pre-put away at every customer. In our model, the header
bundle stores a timestamp set T for checking new redesigns and information misfortune recuperation.
V. LTI MAINTENANCE
With a specific end goal to keep the freshness of the telecasted list, the expense of list support is fundamentally
minimized. In this segment, we contemplate an incremental upgrade approach that can effectively keep up the
live movement file as indicated by the redesigns. As a comment, the whole redesign procedure is done at the
administration supplier and there is no additional information structure being telecasted to the customers. There
is a base up redesign system to keep up the progressive file structure in [21]. Their thought is to recomputed the
influenced subgraphs beginning from most minimal level (i.e., leaf subgraphs) to root. Tragically, as appeared in
Section 2.2, a little partition of edge overhauls trigger redesigns in the lion's share of parcels (i.e., subgraphs).
Along these lines, the above upgrade system acquires high computational expense on redesigning the influenced
subgraphs. It is in this way important to build up a more proficient upgrade system. For any weight overhaul out
and about edges, we watch that just alternate route edges _SGi are essentially recomputed as the heaviness of
different edges (i.e., ESGi[ SGi ) are specifically gotten from the upgrades. To help the easy route edge upkeep,
we joins dynamic most limited way tree strategy (DSPT) [22] into the progressive record structures and lessen
195 | P a g e
3
3
3
1
4
3 10
4
3
1
4
3
2
2
0
(a) SPT(K) (b) w
jmincreases (c)w
mldecreases
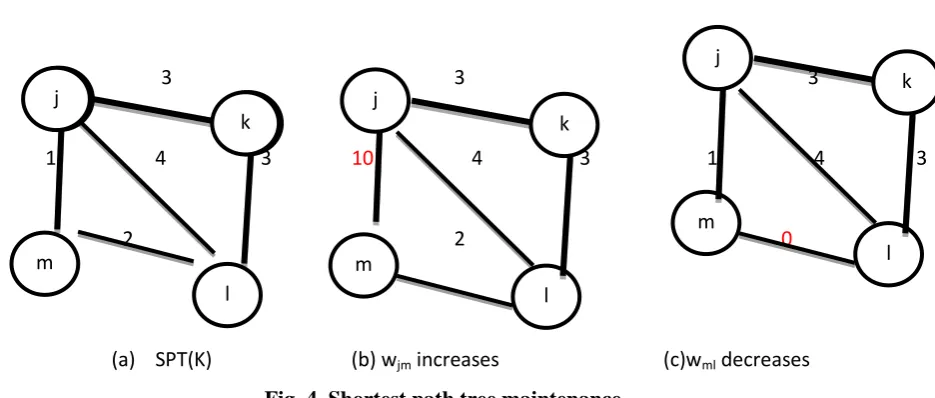
Fig. 4. Shortest path tree maintenance
Given a graph G = (V,E), a shortest path tree (SPT)rooted at a vertex r ∈ V , denoted as SPT(r), is a tree
withroot r, and ∀𝑣 ∈ 𝑉 − {𝑟}, SPT(r) contains a shortest pathfrom r to v. In Fig.10(a), the shortest path tree of
vertex kis highlighted by bold lines. Given a shortest path tree, adynamic Dijkstra approach [22] is proposed for
handlingboth weight increasing (Fig.4(b)) and decreasing cases(Fig.4(c)). The intuition of the algorithms is to
find theaffected local vertices and revise the shortest path tree using
aDijkstra like algorithm starting from the updated vertices.For instance, the weight of e(m, l) is decreased from
2 to0. Starting from the vertex m, a new path m l k,that is a better path from m to k, is found by the
Dijkstrasearching. Thereby, the update process revises the shortestpath tree accordingly as shown in Fig.4(c).
VI. CONCLUSION
In this paper we concentrated on online most brief way calculation, the most limited way result is
processed/upgraded taking into account the live movement circumstances. We deliberately examine the current
work and talk about their inapplicability to the issue (because of their restrictive upkeep time and huge
transmission overhead). To address the issue, we recommend a promising building design that shows the list
reporting in real time. We first recognize an essential element of the various leveled record structure which
empowers us to figure most limited way on a little divide of list. This imperative element is completely utilized
as a part of our answer, LTI. Our examinations affirm that LTI is a Pareto ideal arrangement as far as four
execution components for online most brief way calculation. Later on, we will broaden our answer on time ward
systems. This is an extremely intriguing theme subsequent to the choice of a most brief way depends on current
activity information as well as in view of the anticipated movement circumstances.
REFERENCES
[1] H. Bast, S. Funke, D. Matijevic, P. Sanders, and D. Schultes, “Intransit to constant time shortest-path
queries in road networks,” inALENEX, 2007.
[2] P. Sanders and D. Schultes, “Engineering highway hierarchies,” inESA, 2006, pp. 804–816.
[3] G. Dantzig, Linear programming and extensions, ser. Rand CorporationResearch Study. Princeton, NJ:
Princeton Univ. Press, 1963.
j
m
l
k
j
k
m
l
j
k
m
l
j
196 | P a g e
[4] R. J. Gutman, “Reach-based routing: A new approach to shortestpath algorithms optimized for road
networks,” in ALENEX/ANALC,2004, pp. 100–111.
[5] B. Jiang, “I/o-efficiency of shortest path algorithms: An analysis,”in ICDE, 1992, pp. 12–19.
[6] P. Sanders and D. Schultes, “Highway hierarchies hasten exactshortest path queries,” in ESA, 2005, pp.
568–579.
[7] D. Schultes and P. Sanders, “Dynamic highway-node routing,” inWEA, 2007, pp. 66–79.
[8] F. Zhan and C. Noon, “Shortest path algorithms: an evaluation usingreal road networks,” Transportation
Science, vol. 32, no. 1, pp. 65–73, 1998.
[9] “Google Maps,” http://maps.google.com.
[10] “NAVTEQ Maps and Traffic,” http://www.navteq.com.
[11] “INRIX inc. Traffic Information Provider,” http://www.inrix.com.
[12] “TomTom NV,” http://www.tomtom.com.
[13] “Cisco visual networking index: Global mobile data traffic forecast update, 2010-2015,” 2011.
[14] D. Stewart, “Economics of wireless means data prices bound to rise,” The Global and Mail, 2011.
[15] W.-S. Ku, R. Zimmermann, and H. Wang, “Location-based spatial query processing in wireless broadcast
environments,” IEEE Trans. Mob.Comput., vol. 7, no. 6, pp. 778–791, 2008.
[16] N. Malviya, S. Madden, and A. Bhattacharya, “A continuous query system for dynamic route planning,” in
ICDE, 2011, pp. 792–803.
[17] G. Kellaris and K. Mouratidis, “Shortest path computation on air indexes,” PVLDB, vol. 3, no. 1, pp. 747–
757, 2010.
[18] Y. Jing, C. Chen, W. Sun, B. Zheng, L. Liu, and C. Tu, “Energyefficient shortest path query processing on
air,” in GIS, 2011, pp. 393–396.
[19] R. Goldman, N. Shivakumar, S. Venkatasubramanian, and H. Garcia- Molina, “Proximity search in
databases,” in VLDB, 1998, pp. 26–37.
[20] N. Jing, Y.-W. Huang, and E. A. Rundensteiner, “Hierarchical encoded path views for path query
processing: An optimal model and its performance evaluation,” IEEE TKDE, vol. 10, no. 3, pp. 409–432,
1998.
[21] S. Jung and S. Pramanik, “An efficient path computation model for hierarchically structured topographical
road maps,” IEEE TKDE, vol. 14, no. 5, pp. 1029–1046, 2002.
Author Details
G. TrimurthulupursuingM.Tech (CSE) from Vikas Group of Institutions, Nunna,
197 | P a g e
M.Ashok Kumar working as Assistant Professor, Department of (CSE) from Vikas Group
of Institutions, Nunna, Vijayawada, Krishna (D)-521212, Andhra Pradesh, Affiliated to
JNTUK, India.
BETAM SURESH B.Tech(CSE), M.Tech(CSE), M.Tech(IT) (Ph.D), M.A(Socialogy),
Working as Head of the Department of (CSE) from Vikas Group of Institutions, Nunna,