Licensed under Creative Common Page 252 http://ijecm.co.uk/
CRAFTING AND IMPLEMENTING AN INTEGRATED PORT
THROUGHPUT FORECASTING MODEL
Hassan OUBAHA Jorf-Lasfar Port Operations Director; PhD student, University Ibn Tofail, Morocco
Abdellah HOUSSAINI
Professor, University Ibn Tofail, Morocco [email protected]
Mohammed Amine BALAMBO
Professor, University Ibn Tofail, Morocco [email protected]
Abstract
Port managers are working under the pressure of competition and uncertainty. They aim to
ensure a sustained balance between the increasing throughput and the capacities of their ports
to handle ships efficiently. Thus, they need to improve their forecasting performance to provide
an efficient capacity planning. Given the absence of an integrated port throughput forecasting
model in academia and practice, this paper develops an inclusive and easy to use model that
combines statistical, judgmental and cooperative forecasting methods. The proposed model
was initially crafted based on review of literature before developing its implementation
methodology. The implementation of the developed model in Jorf-Lafar port, by using an
organizational procedure, permitted to establish the throughput forecasts for the next three
years through an integrated combination of statistical, judgmental and collaborative methods.
The implementation led to three key successful factors and five main learning’s. Finally, the
probability throughput predictions had been used to determine the probability waiting time of
Licensed under Creative Common Page 253
simulation and make the appropriate capacity planning decisions. This paper does not develop
criterions to select the most accurate statistical method. This limitation is an opportunity for
further researches.
Keywords: Port, throughput forecasts, waiting time, capacity planning, uncertainty
INTRODUCTION
Over the last five decades, seaborne trade has seen a consistent growth with a volume that has quadrupled to exceed 10 million of tones in 2017 (UNCTAD, 2018). This remarkable increase has led not only to significant development of ports capacities, but also to a change of the role of the ports requiring high levels of agility to move quickly in the new economy (Casaca and Marlow, 2003). Due to the current uncertain economic context, improved forecasting performance is becoming a key success factor in all ports. Forecasting data informs port decisions towards efficient adjustment of their capacities to handle future throughput. Three different methods can be used to obtain throughput predictions: statistical, judgmental and cooperative forecasts. This paper aims to develop a model of forecasting ports throughput by combining the three methods to benefit simultaneously from their advantages. Forecasts are produced as intervals and as most likely point to take uncertainty into consideration. The proposed model has been implemented in Jorf-Lasfar port and permitted to produce throughput forecasts for three years. Preceding its implementation, the model has been operationalized using an organisational procedure to ensure the forecasting process is compatible with the organisational structure of the port operator. Forecast values have been fed into budgeting and capacity planning processes.
Port capacity planning issue
Licensed under Creative Common Page 254 throughput forecasts as its starting point (Taneja and al., 2010). Port managers thus need to improve their forecasting performance towards efficient capacity planning and business agility. Port throughput forecasting is a strategic process since its predictions are crucial for accurate evaluation of capacity investments (Meersman, 2005). Throughput forecasting is also one of the most complex questions in maritime economics because of demand volatility and market share fluctuations (Taneja and al., 2010). In addition, forecasting port throughput lacks transparency and clear structure due to the absence of an adequate simulation tool for all the consequences of market changes and strategies (Meersman, 2005). Despite the availability of three methods for throughput forecasts: statistical, judgmental and cooperative methods, port managers do not have an integrated model. Integration of the three methods would capitalise on their advantages and therefore enhances the forecasting process.
This paper aims to provide port managers with an integrated probability forecasting model based on combining statistical, judgemental and cooperative forecasting methods. The proposed model is then tested and implemented in Jorf-Lasfar Port.
The adopted methodology of research
Licensed under Creative Common Page 255
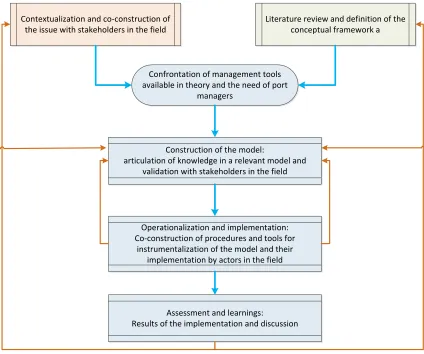
Contextualization and co-construction of the issue with stakeholders in the field
Literature review and definition of the conceptual framework a
Confrontation of management tools available in theory and the need of port
managers
Construction of the model:
articulation of knowledge in a relevant model and validation with stakeholders in the field
Operationalization and implementation: Co-construction of procedures and tools for
instrumentalization of the model and their implementation by actors in the field
Assessment and learnings:
Results of the implementation and discussion
Figure 1: The methodology of research
LITERATURE REVIEW
Two main methods have been developed in previous studies to forecast ports throughput. Statistical models are based on historical data while judgmental predictions are based on experts’ knowledge of the port environment. In addition to these two methods, cooperative forecast is used by supply chains managers based on predictions communicated through the value stream.
Statistical forecasts
Licensed under Creative Common Page 256 prediction results based on mean absolute error, mean absolute percent error and root mean squared error, the authors found that, in general, the classical decomposition model appears to be the best model for forecasting container throughput with seasonal variations. Schulze and Prinz (2009) used the Seasonal Auto-Regressive Integrated Moving Average (SARIMA) model and the Holt–Winters exponential smoothing approach to set the container transhipment throughput at German ports taking account of the seasonal behaviour of the quarterly data used. With regards to forecasting error measures, SARIMA-approach yields slightly better values of modelling the container throughput than the exponential smoothing approach. Shih-huang and Jun-nan (2010) used genetic programming (GP), decomposition approach (X-11) and SARIMA to forecast the throughput of Taiwan’s major ports. The Mean Absolute percent Error revealed that the GP predictions were about 32–36% better than those of X-11 and
SARIMA. Xie and al. (2013) compared three suggested hybrid approaches based on least squares support vector regression (LSSVR) model for container throughput forecasting at ports. They also compared these three models with other benchmark methods such as SARIMA. Their application of the models to Shanghai and Shenzhen ports show that the proposed hybrid approaches can achieve better forecasting performance than individual approaches. Geng and al. (2015) used the robust v-support vector-regression model (RSVR) to establish the throughput forecast of Shanghai port. The experimental results indicate that the proposed port throughput forecasting scheme obtains better forecasting result than the six competing models: ARIMA, MBPNN, RSVR-CSAPSCO, MSVR-CSAPSCO, MRSVR-PSO and MRSVR-SAPSO. However, Farhan and Ping Ong (2016) underlined that SARIMA models can produce reliable throughput forecasts at major international ports. On another hand, Pang and Gebka (2016) reported that the total container throughput forecasts based on modelling the total throughput time series are consistently better than those obtained by combining those forecasts generated by terminal-specific models. Finally, while Rashed and al. (2016) confirm that the volatility and uncertainty in global economic activity introduce complexity in modelling and forecasting container throughput at the port, Gao and al. (2016) underlined that selecting different forecasting models is only meaningful in a specific application context. They confirmed that there is neither theoretical conclusion to the preference order of different methods, nor any prior empirical evidence as to the dominance of one method over the others.
Judgemental forecasts
Licensed under Creative Common Page 257 accurate than those produced by simple averaging. Their experiments has shown that if judges were informed of outcomes after producing combined forecast, they would weight appropriately the separate forecasts and then enhance their judgments but not significantly better than the simple averaging. However, other experiments have proved that if information about individual errors is provided to judges, their forecasts outperform the simple averaging. Goodwin (2002) confirms that the advantage of judgmental integration of statistical forecasts and judgmental forecasts consist of its acceptability by forecasters and decision makers compared to mechanical integration. However, he pointed out that separating forecasters and users of forecasts is necessary to get more accurate predictions. Sanders and Manrodt (2003) conducted a survey of 240 firms and found that companies with lower access to quantifiable data, with less integrated IT system and which evolve in an uncertain environment use judgmental method to establish their forecasts. The survey has also shown that firms using statistical methods get more accurate forecasts. Moreover, the survey shows that only 11% of firms use statistical forecasting, of which 60% adjust their predictions by using experts' judgment. Harvey and Harries (2004) confirm through experiments that people who are in charge of combining forecasts put more weight on their own forecasts or on forecasts which are labelled as their own; this implies that people who are in charge of combining forecast should avoid making their own forecasts. Lawrence and al. (2006) point out that there is now an acceptance of the role of judgement to establish accurate forecast without which serious problems can occur. They argue that Lawrence and al. (1985, 1986) have concluded that judgmental forecasting is at least as accurate as statistical methods while Ang and O’Connor
Licensed under Creative Common Page 258 Huang and al. (2016) point out that mechanical combination and judgment-based combination are the two ways to combine forecasts. They also confirm that expert knowledge contributes to higher forecasting performance while some forecasters tend to make unnecessary judgmental adjustments to statistical projection even if they do not have access to additional information and sometimes. They surprisingly insist on making adjustments even if it is proved that their adjustments are harmful.
Collaborative forecasts
Helms and al. (2000) point out that providing information through the supply chains increases the efficiency of its members and reduce their reliance on historical forecasts. They underline that companies using collaborative forecasts are more satisfied with their results. They also confirm that there is no unique process to implement collaborative forecasting. However, they conform that the feasibility of establishing collaborative forecasts depends on the level of supply chain management and integration achieved, on the business environment and on the use of technologies, and the internal and external relationships of supply chain members. Other researchers have confirmed the benefits of collaborative forecasting in supply chains. Aviv (2001) has shown that collaborative forecasting based on updating the data at the start of each period and subsequently adjusting the forecast by each member of the supply chain brings substantial benefits. Simatupang and Sridharan (2002) remind us that in general, information exchange is an essential component of cooperative supply chains. Also, McCarthy and Golicic (2002) confirm that collaborative forecasting can improve the performance of companies and supply chains such as improving reactivity, product availability, optimizing stocks and associated costs and l income and margins. Furthermore, Holweg et al. (2005) confirm that the slow progress in collaboration in supply chains may be due to the lack of common understanding of its concepts and the difficulty of integrating external collaboration with internal production.
Probability forecasts
Licensed under Creative Common Page 259 interval prediction. Also, Lawrence and al. (2006) confirm that point forecasting should not be considered as the only method to establish predictions. They argue that probability forecasts and intervals provide two effective formats to integrate uncertainties. They confirm that interval forecasts, used in fields such as economy and financial forecasting, consist of setting upper and lower forecast limits. They also advocated that using intervals instead of single point enhances decision performance. Finally, Stephenson (2008) points out that probability forecasts allow decision-makers to make their own decisions whereas the use of point forecasts lead to make decisions prematurely by forecasters instead of the decision makers.
PORT THROUGHPUT FORECASTING MODEL
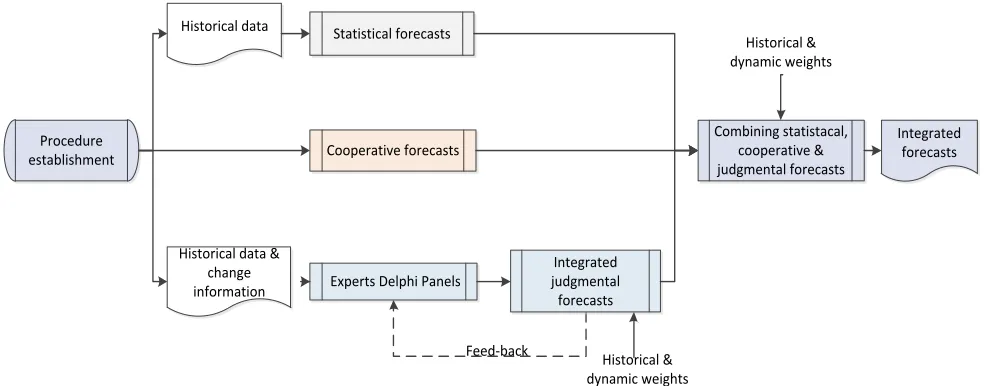
The previous models and the methods suggested by researchers to forecast port throughput does not integrate the cooperative forecasts collected from port users. Furthermore, they do not suggest dynamic weights to integrate judgmental forecasts set by experts and then combine them with statistical and cooperative forecasts. The model suggested in this paper (Figure 2) has the advantage of combining judgmental, statistical and cooperative forecasting methods. The model also suggests two sets of dynamic and knowledge-based weighting factors; one set of weights to combine judgmental forecasts and the second to aggregate judgmental, statistical and cooperative forecasts.
Cooperative forecasts Procedure
establishment
Experts Delphi Panels
Combining statistacal, cooperative & judgmental forecasts Integrated forecasts Feed-back Historical & dynamic weights Integrated judgmental forecasts Statistical forecasts Historical & dynamic weights Historical data
Historical data & change information
Figure 2: the suggested forecasts port throughput model
Statistical forecasts
Licensed under Creative Common Page 260 models. There is no agreement in literature on the most suitable method and the selection of the adopted method depends on port’s specific context (Pang and Gebka, 2016).
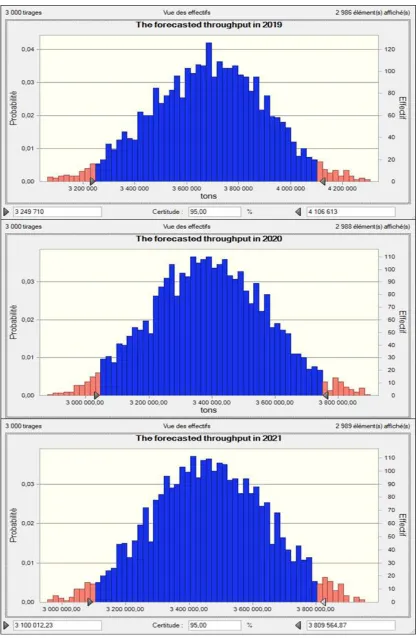
Taking into account throughput uncertainty, statistical forecasts are established as intervals with upper and lower forecasted values. The interval represents a known probability which is in general equal to 95%. In addition to the interval, the most likely point is forecasted.
Cooperative forecasts
Cooperative forecast consists of collecting and harmonizing predictions communicated by port users especially carriers, shippers and consignees. Predictions are communicated by port users as part of their partnership with the port as a member of their supply chains. This cooperation is an evidence of commitment from both supply chain parties to work towards mutual benefits.
Port users are selected to communicate their predictions based on the quantity of their port throughput, the uncertainty represented by the variability of their throughput, and the level of their predisposition to cooperate. Selected users are consulted to communicate their forecasts in formats of intervals and a most likely point to take in account their throughput uncertainty.
Judgmental forecasts
Judgmental forecasts are established by a group of experts using historical data and their knowledge of the internal and external port environment. Forecasts are organized in iterative panels following Delphi procedure.
The panellists are selected based on their port environment knowledge and their ability to mobilize a large number of sources of port information. Forecasters’ qualification is evaluated
based on their individual previous forecasts compared to the actual throughput achieved. It is worth noting that experts who are in charge of establishing statistical forecasts and those who are in charge of cooperative forecasts should not take part in judgmental forecast panels. This is essential to avoid any premature interference or influence between judgmental and statistical forecasts on one hand, and cooperative forecasts on the other hand. Experts establish throughput forecasts in a format of intervals in addition to the most likely point to take in account the uncertainty inherent to port throughput.
Licensed under Creative Common Page 261 weights are updated systematically by using the last previous judgmental forecasts already achieved and assess gaps between prediction and actual throughput achieved. The person in charge of combining judgmental forecasts should not participate to panels to avoid any subjective or biased integration.
Forecasts combination
Statistical, cooperative and judgmental forecasts are combined by using weights determined according to the level of knowledge determined from the previous combined forecasts. For each throughput, the best weights are those which permit to equal the predictions of the three previous years previously established and the actual throughput achieved during these years. The weights considered are updated for each forecasting period according to recent historical data and the predictions considered earlier.
The person who is in charge of combining the three forecasts should not be a forecaster who participated in establishing statistical, cooperative or judgmental predictions to avoid biased and subjective combinations.
OPERATIONAL METHODOLOGY FOR IMPLEMENTING THE PROPOSED MODEL
The implementation methodology of the suggested model is described in this part of the paper. Statistical, cooperative and judgmental forecasts are established independently first and then combined to get the final predictions.
Statistical forecasting Methodology
Licensed under Creative Common Page 262
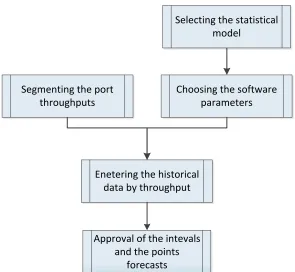
Selecting the statistical model
Choosing the software parameters Segmenting the port
throughputs
Enetering the historical data by throughput
Approval of the intevals and the points
forecasts
Figure 3: The proposed statistical forecasting process
Judgmental forecasting methodology
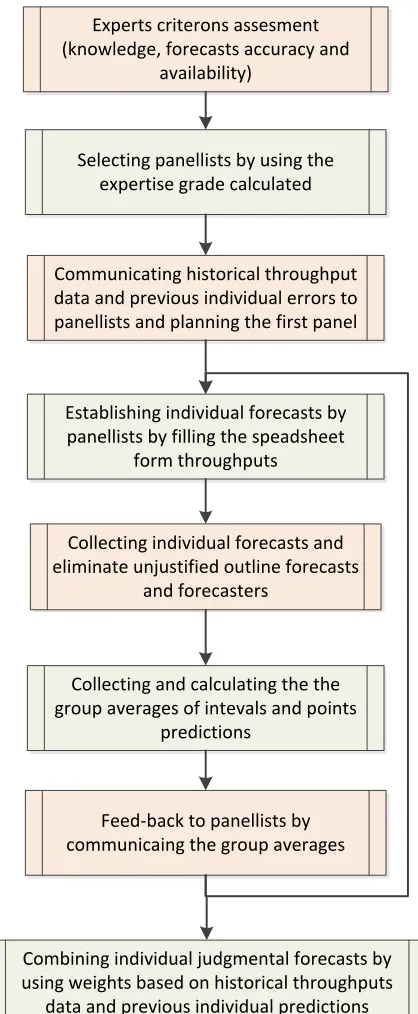
Judgmental forecasts are established by experts through iterative panels following Delphi procedure. Firstly, experts are selected according to three criterions: theirs knowledge of the external and internal port environment (criterion: K), the accuracy of their individual previous forecasts (criterion: F) and theirs availability to participate to all the successive panels (criterion: A). Experts are evaluated for each criterion using a five points measurement scale. A score from 1 to 5 is given to each expert by criterion. Then, a final score Ee is calculated for each expert “e”
as a product of the three individual criterions grades Ke, Fe and Ae (Eq1).
Ee = Ke x Fe x Ae (Eq1)
Licensed under Creative Common Page 263 technique, panellists establish individually their judgmental forecasts for the second panel. The procedure is further repeated to reduce gaps between panellists’ forecasts. Final individual
judgmental forecasts are obtained when the change of forecasts between two successive panels becomes insignificant.
The final individual forecasts are combined by using weights calculated by using historical forecasts established previously by the panellists. If N is the number of panellists, the same significant throughputs are selected to determine the weights. The weights (a, b, c, …, n) attributed to panellists (A, B, C, …, N) are calculated using the series of n equations (Eq2) and
the suggested judgmental forecasting methodology is described in figure 4.
………. (Eq2)
Where:
n: number of throughputs selected to calculate weights which is equal to N the number of
panellists.
a, b, c, …., n : weights attributed to panellists A, B, C…, N ;
T1, T2, …, Tn : previous significant throughputs selected to calculate weights;
PAT1, PAT2, …, PATn : previous individual forecasts of the throughputs T1, T2, …, Tn established
by the panellist A ;
PNT1, PNT2, …, PNTn : previous individual forecasts of the throughputs T1, T2, …, Tn established
by the panellist N;
RT1, RT2, …, RTn : actual throughput quantities T1, T2, …, Tn achieved during the same period
Licensed under Creative Common Page 264
Experts criterons assesment (knowledge, forecasts accuracy and
availability)
Selecting panellists by using the expertise grade calculated
Communicating historical throughput data and previous individual errors to panellists and planning the first panel
Establishing individual forecasts by panellists by filling the speadsheet
form throughputs
Collecting and calculating the the group averages of intevals and points
predictions
Feed-back to panellists by communicaing the group averages Collecting individual forecasts and eliminate unjustified outline forecasts
and forecasters
Combining individual judgmental forecasts by using weights based on historical throughputs
data and previous individual predictions
Figure 4: The proposed judgmental forecasting process
Cooperative forecasting methodology
Licensed under Creative Common Page 265 A score from 1 to 5 is given to port user for each criterion. Then, the final collaborative score (C) is calculated for each port user as a product of the scores for each criterion (Eq3).
Cu = Vu x Su x Pu (3)
Port users who obtained a final higher than the set threshold are selected to share their throughput forecasts.
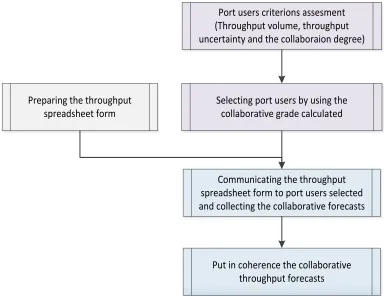
A spreadsheet form with interval and points throughput forecasts is prepared with the same throughput segmentation used to establish statistical and judgmental forecasts. The spreadsheet is communicated to the selected port users in a collaborative manner to be filled. The port users’ predictions are collected and put in coherence with the throughput segmentation. The process followed for judgmental forecasting is presented in figure 5.
Port users criterions assesment (Throughput volume, throughput uncertainty and the collaboraion degree)
Selecting port users by using the collaborative grade calculated Preparing the throughput
spreadsheet form
Communicating the throughput spreadsheet form to port users selected and collecting the collaborative forecasts
Put in coherence the collaborative throughput forecasts
Figure 5: The suggested cooperative forecasting process
Methodology of combining statistical, judgmental and cooperative forecasts
Statistical, judgmental and cooperative forecasts are combined by using weights calculated based on previous throughput forecasts and historical data. Statistical weight si, judgmental
weight ji and collaborative weight ci of the throughput i are calculated based on historical data of
Licensed under Creative Common Page 266 (4)
Where:
: Statistical forecasts weight of the throughput i
: Judgmental forecasts weight of the throughput i
: Collaborative forecasts weight of the throughput i
: Statistical previous forecasts of the throughput i established for
the past three years N-1; N-2 and N-3.
: Judgmental previous forecasts of the throughput i established
for the past three years N-1; N-2 and N-3.
: Collaborative previous forecasts of the throughput i established
for the past three years N-1; N-2 and N-3.
; : Quantities of the throughput i achieved in the last three years N-1;
N-2 and N-3.
Finally, the combined and definite forecast of the throughput i in the year N is given by the following formula (5):
(5)
Where:
: The statistical forecast of the throughput i in the year N
The judgmental forecast of the throughput i in the year N
: The collaborative forecast of the throughput i in the year N.
IMPLEMENTATION OF THE INTEGRATED MODEL IN PORT OF JORF-LASFAR
Port forecasting management in Morocco
Licensed under Creative Common Page 267 throughput forecasts annually to prepare the subsequent year’s budget while long term forecasts are established occasionally to evaluate new investment projects. In practice, port managers of container and oils terminals determine the throughput forecasts by using historical data trends. Then they make judgmental adjustments based on information collected from port customers, economic indicators and analysis of the port environment. Managers of bulk and general cargo terminals establish their throughput forecasts based on the predictions communicated by the port customers. Then, they make judgmental adjustments based on historical throughputs trends and their analysis of the external port environment. In general, port authorities and multi-user operators set up their throughput forecasts at port level while maritime companies and industrials who manage their own terminals establish their throughput forecasts at corporate level. They all establish deterministic predictions for their budget and they use forecasts scenarios to take in account uncertainties when they evaluate their investment projects. All port managers interviewed confirmed that they do not assess their forecasting practice for efficiency and accuracy. However, they reported facing challenges throughput the forecasting process. The main challenges reported are lack of coordination between ports and entities, absence of a shared and updated historical database, limited cooperation by some port users who even dissimulate information impacting throughput forecasts, lack of relevant economic KPIs, dependence on uncertain factors such rainfall and international seaborne trade and finally, the absence of a standard management tool for the implementation of throughput forecasting process.
Implementation of the proposed model in Jorf Lasfar port
The proposed model has been implemented by « Société d’Exploitation des Ports » (SODEP)
concessionaire of three terminals in Jorf-Lasfar port. This entity was selected because of e facility of access and the typical character of the three terminals. SODEP handles about 5 millions of tons annually of diversified bulk, oils and general cargos throughput. It is considered one of the most important port infrastructures in Morocco.
Based on the proposed model, an organizational procedure has been formulated and approved by the management team of SODEP in Jorf-Lasfar port. This procedure aims to ensure a compatibility of the model with SODEP’s organisational structure and permits to assign
responsibilities of each task and links all the steps in the throughput forecasts.
Licensed under Creative Common Page 268 forecasts not only to prepare the budget but also to conduct capacity planning. Port capacity planning requires assessing the capacity of terminals to handle the forecasted throughput which requires having a clear visibility during the next three years to prevent any under capacity. This early planning permits to have enough time to schedule the necessary capacity investment sufficiently before saturation.
The budget preparation process is usually launched on September, 1st each year when the effective throughput of the first eight months is known. The budget should be presented to the headquarter commission during the first week of October. This time constraint requires establishing throughput forecasts during a maximum period of two weeks. Thus, implementing the model process in two weeks is a significant success factor.
As it has been recommended by the suggested model, throughput forecasts have been established using three methods. Statistical forecasts by the Information Technology (IT) department using SARIMA model. The judgmental forecasts have been established through two successive Delphi panels of six port mangers that have a wide knowledge of external and internal environment of Jorf-Lasfar. Finally, cooperative predictions have been collected by the sales manager. The predictions under the three methods are expressed in form of intervals and the most likely point for each throughput segment, and they have been combined by the port director using the formulas suggested by the model methodology.
Results of the model implementation
Licensed under Creative Common Page 270 In addition to establishing the throughput forecasts, this study has identified three key success factors for the proposed model. First, to ensure its success and acceptance by the port entity, the developed model should be implemented through an organizational procedure set by port managers involved in the forecasting process. Second, the throughput forecasting process should be consistent with the existent procedures especially the budget preparation process in terms of deadlines and tasks assignment. Finally, the implementation of the model by SODEP has shown that the involvement of a person who is in charge of collecting cooperative forecasts in judgmental forecasts caused interferences of the two independent forecasts. Consequently, the third success factor is to ensure that experts who contribute to establishing cooperative or statistical forecasts should not be part of judgmental panels.
Moreover, the implementation of the developed model resulted into the following five main lessons learned. Establishing statistical forecasts requires a judgmental preliminary step to eliminate hidden throughputs not to be handled in the future because of known economic reasons. Also, establishing judgmental forecasts by an adequate number of experts may require involving external experts if the number of internal forecasters is below the required number of eight to ten panellists as suggested by Vernette (1994). Moreover, some port users abstain from sharing information for collaborative forecasting and prefer to keep their predictions confidential. This is mainly because they believe that sharing information would be divulgated to their competitors who are users of the same port. In the case of a throughput which is generated by different port users, establishing complete collaborative forecasts requires collecting accurate predictions from all these port users. Finally, financial managers often try to adjust the final version of the combined throughput to improve the projected revenue.
The use of the combined forecasts in port capacity planning
The established throughput forecasts have been used by SODEP to prepare its budget of the next year 2019 and to set the port capacity planning. This section presents the main results of the exploitation of the probability throughput forecasts in port capacity planning.
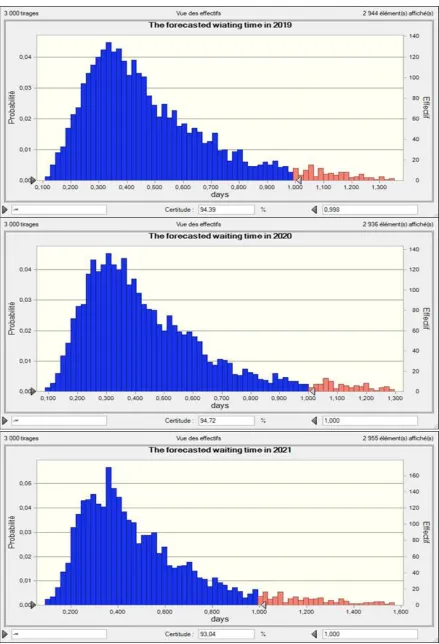
According to interviews with port users, the acceptable waiting time is one day for each vessel. Moreover, the acceptable waiting time by Jorf-Lasfar port authority can be calculated by the following formula:
Wt = Ts / 3
Where:
Wt: the acceptable waiting time by the port authority
Licensed under Creative Common Page 271 The average time service of ships in Jorf-Lasfar port is around three days and the acceptable waiting time by the port authority is about one day which is equal to the demand of port users. Therefore, the acceptable waiting time by port users and the port authority is one day.
Licensed under Creative Common Page 275 According to these simulations, 94.39 %, 94.72 % and 93.04 % of ships will wait less than the acceptable waiting time threshold respectively in 2019, 2020 and 2021. Jorf-Lasfar port managers considered that this performance is acceptable and have decided consequently to introduce a program to streamline the operational processes of fertilizers, cattle food and iron scrub which aims to increase the productivity of these port processes at least by 15%.
LIMITATIONS OF THE PROPOSED MODEL
This paper did not develop a selection method for the most accurate statistical model. SARIMA was used to establish the statistical throughput forecasts of Jorf-Lasfar port only because of its availability and ease of use. Moreover, judgmental forecasts of Jorf-Lasfar throughput have been established by six panellists who might be insufficient to set accurate judgmental predictions. Another limitation of this study is that the weights attributed to panellists to combine individual judgmental predictions were assumed to be equal due to lack of historical forecasts established previously by the panellists. In addition, weights used to combine statistical, judgmental and collaborative throughput forecasts of Jorf- Lasfar port are supposed to be equal due to lack of historical data of the previous three years forecasts established by using the three methods. This limitation is mainly because the model is used for the first time.
This research represents opportunities for further research to develop an adequate method of selecting the accurate statistical model depending on the context and the characteristics of the port throughput.
CONCLUSION
This paper developed an integrated and easy to use port throughput forecasting model based on combining statistical, judgemental and cooperative forecasts. In the aim of taking in account uncertainties, the developed model suggests to establish port throughput predictions as intervals and as the most likely point for each segment. The implementation of the developed model by SODEP in Jorf-Lasfar port through an organizational procedure permitted to establish the throughput forecasts for three years which are used to establish the budget and execute the port capacity planning process as well.
Licensed under Creative Common Page 276 In addition to producing an integrated port throughput forecasting tool, this paper identifies three key successful factors. Thus, in order to ensure its success and acceptance by the port entity, the developed model should be implemented through an organizational procedure set by the port managers. Also, throughput forecasting process should be consistent with the existent procedures especially the budget preparation process in terms of deadlines and tasks assignment. Finally, forecasts should be drawn up by different people to avoid any form of interference.
In terms of limits of this paper, the theoretical exploration of statistical forecasts has shown that there is neither preference nor dominance of one model compared to the others and that the degree of reliability of one model compared to the other depends on the context of the case studied. So, if the SARIMA model was chosen in this paper as part of the implementation of the strategic planning model constructed, this choice was not preceded by an evaluation of all the possible statistical models enabling the most precise model to be chosen in the case of the port of Jorf-Lafar. However, this choice was advocated by the ease of obtaining the software integrating the SARIMA model and by the fact that this model is more responsive. Thus, future researches may be interested in the criteria for choosing the statistical model in the case of port throughput forecasts.
REFERENCES
Abramson, B., & Clemen, R., (1995). Probability forecasting. International Journal of Forecasting, Vol. 11, pp. 1-4.
Aviv, Y., (2001). The effect of collaborative forecasting on supply chain performance. Management Science, Vol. 47 No. 10, pp. 1326 – 1343.
Bunn, D. W., & Salo, A., (1993). Forecasting with scenarios. European Journal of Operational Research, Vol. 68, pp. 291 – 303.
Chen, S. H., & Chen, J. N., (2010). Forecasting container throughputs at ports using genetic programming. Expert Systems with Applications, Vol. 37, pp. 2054-2058.
Dekker, S., (2005). Port Investment towards an Integrated Planning of Port Capacity. Trail thesis series, T2005/5.
Duru, O., & Yoshida, S., (2009). Judgmental forecasting in the dry bulk shipping business: statistical vs. Judgmental approach. The Asian Journal of Shipping and Logistics, Vol. 25, pp. 189 - 217.
Farhan, J., & Ong, G. P., (2016). Forecasting seasonal container throughput at international ports using SARIMA models. Maritime Economics & Logistics, pp. 1-18.
Fischer, I., & Harvey, N., (1999). Combining forecasts: what information do judges need to outperform the simple average? International Journal of Forecasting, Vol. 15, pp. 227 – 246.
Gao, Y., Luo, M., & Zou, G., (2016). Forecasting with model selection or model averaging : a case study for monthly container port throughput. Transport metrica A : Transport science, Vol. 12 No. 4, pp. 366-384.
Geng, J., Li, M. W., Dong, Z. H., & Liao, Y. S., (2015). Port throughput forecasting by MARS-RSVR with chaotic simulated annealing particle swarm optimisation algorithm. Neurocomputing, Vol. 147, pp. 239-250.
Goodwin, P., (2002). Integrating management judgment and statistical methods to improve short-term forecasts. The International Journal of Management science, Vol. 30, pp. 127 – 135.
Licensed under Creative Common Page 277 Helms, M. M., Ettkin, L. P., & Chapman, S., (2000). Supply chain forecasting – Collaborative forecasting supports – supply chain management. Business Process Management Journal, Vol. 5 No. 6, pp. 392 – 407.
Holweg, M., Disney, S., Holmström, J., & Smaros, J., (2005). Supply Chain Collaboration: Making Sense of the Strategy Continum. European Management Journal, Vol. 23 No. 2, pp. 170 – 181.
Huang, A., Qiao, H., Wang, S., & Liu, J., (2016). Improving forecasting performance by exploiting expert knowledge: evidence from Guangzhou port. International journal of information technology & decision making, Vol. 15 No. 2, pp. 387-401.
Huang, A., Qiao, I. K., Wang, S., & Zhang, Z., (2015). An interval knowledge based forecasting paradigm for container throughput prediction. Procedia computer science, Vol. 55, pp. 1381 – 1389.
Jorgensen, M., Teigen, K. H., & Molokken, K., (2004). Better Sure than safe? Over-confidence in judgement based software development effort prediction intervals. The Journal of Systems and Software, Vol. 70, pp. 79 – 93.
Lawrence, L., Goodwin, P., O’Connor, M., & Ohkai, O., (2006). Judgmental forecasting: A review of progress over the last 25 years. International journal of forecasting, Vol. 22, pp. 493 – 518.
McCarthy, T. M., & Golicic, S. L., (2002). Implementing collaborative forecasting to improve supply chain performance. International Journal of Physical Distribution & Logistics Management, Vol. 32 No. 6, pp. 431 – 454.
Meersman, H., (2005). Port investments in an uncertain Environment. Research in Transportation Economics, Vol. 13, pp. 279-298.
Paixao, A. C., & Marlow, P. B., (2003). Fourth generation ports – a question of agility? International Journal of Physical Distribution & Logistics Management, Vol. 33 No. 4, pp. 355-376.
Pang, G., & Gebka, B., (2016). Forecasting container throughput using aggregate or terminal-specific data? The case of Tanjung Priok Port, Indonesia. International Journal of Production Research. 20-42.
Peng, W. Y., & Chu, C. W., (2009). A comparison of univariate methods for forecasting container throughput volumes. Mathematical and Computer Modelling, Vol. 50, pp. 1045-1057.
Rashed, Y., Meersman, H., Voorde, E. V., & Vanelslander, T., (2016). Short-term forecast of container throughput: An ARIMA-intervention model for the port of Antwerp. Maritime Economics & Logistics, pp. 1-16.
Sanders, N. R., & Manrodt, K. B., (2003). The efficacy of using judgmental versus quantitative forecasting methods in practice. The International Journal of Management Science, Vol. 31, pp. 511 – 522.
Schulze, P. M., & Prinz, A., (2009). Forecasting container transhipment in Germany. Applied Economics, Vol. 41, pp. 2809-2815.
Seabrooke, W., Hui, E., Lam, W., & Wong, G., (2003). Forecasting cargo growth and regional role of the port of Hong Kong. Cities, Vol. 20 No. 1, pp. 51-64.
Simatupang, T. M., & Sridharan, R., (2002). The collaborative Supply Chain. The International Journal of Logistics Management, Vol. 13 No. 1, pp. 15 – 30.
Stephenson, D. B., (2008). An introduction to probability forecasting. University of Exeter.
Taneja, P., Ligteringen, H., & Schuyenburg, M. V., (2010). Dealing with uncertainly in design of port infrastructure systems. J. Design Research, Vol. 8 No. 2, pp. 101-118.
UNCTAD (2018), 50 Years of Review of Maritime Transport 1968 – 2018.