Machine Translation Evaluation using Recurrent Neural Networks
Rohit Gupta1, Constantin Or˘asan1, Josef van Genabith2
1Research Group in Computational Linguistics, University of Wolverhampton, UK
2Saarland University and German Research Center for Artificial Intelligence (DFKI), Germany
{r.gupta, c.orasan}@wlv.ac.uk josef.van [email protected]
Abstract
This paper presents our metric (UoW-LSTM) submitted in the WMT-15 met-rics task. Many state-of-the-art Machine Translation (MT) evaluation metrics are complex, involve extensive external re-sources (e.g. for paraphrasing) and require tuning to achieve the best results. We use a metric based on dense vector spaces and Long Short Term Memory (LSTM) networks, which are types of Recurrent Neural Networks (RNNs). For WMT-15 our new metric is the best performing metric overall according to Spearman and Pearson (Pre-TrueSkill) and second best according to Pearson (TrueSkill) system level correlation.
1 Introduction
Deep learning approaches have turned out to be successful in many NLP applications such as para-phrasing (Mikolov et al., 2013b; Socher et al., 2011), sentiment analysis (Socher et al., 2013b), parsing (Socher et al., 2013a) and machine trans-lation (Mikolov et al., 2013a). While dense vec-tor space representations such as those obtained through Deep Neural Networks (DNNs) or Re-current Neural Networks (RNNs) are able to cap-ture semantic similarity for words (Mikolov et al., 2013b), segments (Socher et al., 2011) and documents (Le and Mikolov, 2014) naturally, tra-ditional measures can only achieve this using re-sources like WordNet and paraphrase databases.
This paper presents a novel, efficient and com-pact MT evaluation measure based on RNNs. Our metric (Gupta et al., 2015) is simple in the sense that it does not require much machinery and re-sources apart from the dense word vectors. This cannot be said of most of the state-of-the-art MT evaluation metrics, which tend to be complex and
require extensive feature engineering. Our met-ric is based on RNNs and particularly on Tree Long Short Term Memory (Tree-LSTM) networks (Tai et al., 2015). LSTM is a sequence learning technique which uses a memory cell to preserve a state over a long period of time. This enables distributed representations of sentences using dis-tributed representations of words. Tree-LSTM (Tai et al., 2015) is a recent approach, which is an extension of the simple LSTM framework (Hochreiter and Schmidhuber, 1997; Zaremba and Sutskever, 2014).
2 Related Work
Many metrics have been proposed for MT eval-uation. Earlier popular metrics are based on n-gram counts (e.g. BLEU (Papineni et al., 2002) and NIST (Doddington, 2002)) or word error rate. Other popular metrics like METEOR (Denkowski and Lavie, 2014) and TERp (Snover et al., 2008) also use external resources like WordNet and para-phrase databases. However, system-level cor-relation with human judgements for these met-rics remains below 0.90 Pearson correlation co-efficient (as per WMT-14 results, BLEU-0.888, NIST-0.867, METEOR-0.829, TER-0.826, WER-0.821).
Recent best performing metrics in the WMT-14 metric shared task (Mach´acek and Bojar, 20WMT-14) used a combination of different metrics. The top performing system DiskoTK-Party-Tuned (Joty et al., 2014) in the WMT-14 task uses five differ-ent discourse metrics and twelve differdiffer-ent metrics from the ASIYA MT evaluation toolkit (Gim´enez and M`arquez, 2010). The metric computes the number of common sub-trees between a reference and a translation using a convolution tree kernel (Collins and Duffy, 2001). The basic version of the metric does not perform well but in combi-nation with the other 12 metrics from the ASIYA toolkit obtained the best results for the WMT-14
metric shared task. Another top performing metric LAYERED (Gautam and Bhattacharyya, 2014), uses linear interpolation of different metrics. LAY-ERED uses BLEU and TER to capture lexical sim-ilarity, Hamming score and Kendall Tau Distance (Birch and Osborne, 2011) to identify syntactic similarity, and dependency parsing (De Marneffe et al., 2006) and the Universal Networking Lan-guage1for semantic similarity.
For our participation in the WMT-15 task, we used our metric ReVal (Gupta et al., 2015). ReVal metric is based on dense vec-tor spaces and Tree Long Short Term Mem-ory networks. This metric achieved state of the art results for the WMT-14 dataset. The metric including training data is available at https://github.com/rohitguptacs/ReVal.
3 LSTMs and Tree-LSTMs
Recurrent Neural Networks allow processing of arbitrary length sequences, but early RNNs had the problem of vanishing and exploding gradi-ents (Bengio et al., 1994). RNNs with LSTM (Hochreiter and Schmidhuber, 1997) tackle this problem by introducing a memory cell composed of a unit called constant error carousel (CEC) with multiplicative input and output gate units. Input gates protect against irrelevant inputs and output gates against current irrelevant memory contents. This architecture is capable of capturing important pieces of information seen in a bigger context. Tree-LSTM is an extension of simple LSTM. A typical LSTM processes the information sequen-tially whereas Tree-LSTM architectures enable sentence representation through a syntactic struc-ture. Equation (1) represents the composition of a hidden state vector for an LSTM architecture. For a simple LSTM,ctrepresents the memory cell and
otthe output gate at time steptin a sequence. For
Tree-LSTM,ctrepresents the memory cell andot
represents the output gate corresponding to node t in a tree. The structural processing of Tree-LSTM makes it more favourable for representing sentences. For example, dependency tree structure captures syntactic features and model parameters capture the importance of words (content vs. func-tion words).
ht=ot⊙tanhct (1)
[image:2.595.318.511.100.220.2]1http://www.undl.org/unlsys/unl/unl2005/UW.htm
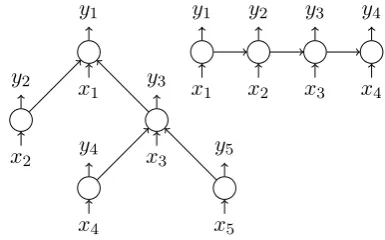
Figure 1 shows simple LSTM and Tree-LSTM architectures.
.. x2
.. y2
..
y1
. x1 ..
y3
.
x3
..
y4
.
x4
..
y5
.
x5
.. x1
.
y1
.. x2
.
y2
.. x3
.
y3
.. x4
.
y4
Figure 1: Tree-LSTM (left) and simple LSTM (right)
4 Evaluation Metric
We used the ReVal (Gupta et al., 2015) metric for this task. This metric represents both the reference (href) and the translation (htra) using a
depen-dency Tree-LSTM (Tai et al., 2015) and predicts the similarity score yˆbased on a neural network which considers both distance and angle between href andhtra:
h×=href⊙htra
h+=|href −htra|
hs=σ (
W(×)h×+W(+)h++b(h) )
ˆ
pθ =softmax (
W(p)hs+b(p) )
ˆ
y=rTpˆθ
(2)
where,σis a sigmoid function,pˆθis the estimated
probability distribution vector andrT = [1 2...K].
The cost functionJ(θ)is defined over probability distributionspandpˆθ using regularised
Kullback-Leibler (KL) divergence.
J(θ) = 1
n
n ∑
i=1
KL(p(i)||pˆ(i) θ
)
+λ
2||θ||22 (3)
In Equation 3,irepresents the index of each train-ing pair,nis the number of training pairs andpis the sparse target distribution such thaty =rTpis
defined as follows:
pj =
y− ⌊y⌋, j =⌊y⌋+ 1
⌊y⌋ −y+ 1, j =⌊y⌋
[image:2.595.322.528.419.516.2]for 1 ≤ j ≤ K. Where, y ∈ [1, K] is the similarity score of a training pair. For example, fory = 2.7,pT = [0 0.3 0.7 0 0]. In our case, the
similarity scoreyis a value between 1 and 5. To compute our training data we automatically convert the human rankings of the WMT-13 eval-uation data into similarity scores between the ref-erence and the translation. These translation-reference pairs labelled with similarity scores are used for training. We also augment the WMT-13 data with 4500 pairs from the SICK training set (Marelli et al., 2014), resulting in a training dataset of 14059 pairs in total.
The metric uses Gloveword vectors (Penning-ton et al., 2014) and the simple LSTM, the de-pendency Tree-LSTM and neural network imple-mentations by Tai et al. (2015). Training is per-formed using a mini batch size of 25 with learning rate 0.05 and regularization strength 0.0001. The memory dimension is 300, hidden dimension is 100 and compositional parameters are 541,800. Training is performed for 10 epochs. System level scores are computed by aggregating and normal-ising the segment level scores. Full details can be found in (Gupta et al., 2015).2
5 Results
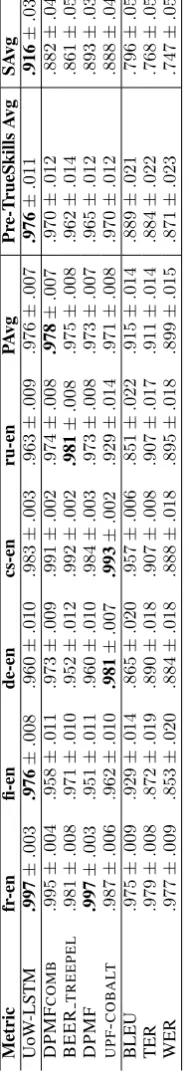
The results for WMT-15 are presented in Table 1 and Table 2.
Table 1 shows system-level Pearson correlation (TrueSkill) (see (Bojar et al., 2013) for differ-ence between TrueSkill and Pre-TrueSkill system-ranking approaches) obtained on different lan-guage pairs as well as average (PAvg) over all language pairs. The second last column shows average Pearson correlation (Pre-TrueSkill). The last column shows average Spearman correlation (SAvg). The 95% confidence level scores are obtained using bootstrap resampling as used in the WMT-2015 metric task evaluation. Table 2 shows results on segment-wise Kendall tau correlation.
The first section of Table 1 and Table 2 shows the results of our ReVal metric as UoW-LSTM, the second section shows the other four top perform-ing metrics and the third section shows baseline metrics (BLEU, TER and WER for system-level andSENTBLEU for segment level).
Table 1 shows that our metric obtains the best results overall for both Pearson (Pre-TrueSkill)
2Please refer to L+Sick(100, 300) in (Gupta et al., 2015)
for more details and results on the WMT-14 settings.
and Spearman system-level correlation and second best overall using Pearson (TrueSkill) correlation. Table 2 shows that while improving over SENT -BLEU our metric does not obtain high segment level scores.
6 Conclusion and Future Work
Our dense-vector-space-based ReVal metric is simple, elegant and fully competitive with the best of the current complex alternative approaches that involve system combination, extensive external re-sources, feature engineering and tuning. In future work we will investigate the difference between system and segment level evaluation scores.
Acknowledgement
The research leading to these results has received funding from the People Programme (Marie Curie Actions) of the European Unions Seventh Frame-work Programme FP7/2007-2013/ under REA grant agreement no. 317471 and the EC- funded project QT21 under Horizon 2020, ICT 17, grant agreement no. 645452.
References
Yoshua Bengio, Patrice Simard, and Paolo Frasconi. 1994. Learning long-term dependencies with
gra-dient descent is difficult. IEEE Transactions on
Neural Networks, 5(2):157–166.
Alexandra Birch and Miles Osborne. 2011.
Reorder-ing metrics for MT. InProceedings of the 49th
An-nual Meeting of the Association for Computational Linguistics: Human Language Technologies-Volume
1, pages 1027–1035. Association for Computational
Linguistics.
Ondˇrej Bojar, Rajen Chatterjee, Barry Haddow, Matthias Huck, Philipp Koehn, Matteo Negri, and Lucia Specia. 2013. Findings of the 2013 Workshop
on Statistical Machine Translation. In
Proceed-ings of the Eighth Workshop on Statistical Machine Translation, pages 1–44, Sofia, Bulgaria, August. Association for Computational Linguistics.
Michael Collins and Nigel Duffy. 2001. Convolution kernels for natural language. InAdvances in Neural Information Processing Systems, pages 625–632. Marie-Catherine De Marneffe, Bill MacCartney,
Christopher D Manning, et al. 2006. Generat-ing typed dependency parses from phrase structure
parses. InProceedings of LREC, volume 6, pages
449–454.
for any target language. InProceedings of the EACL 2014 Workshop on Statistical Machine Translation. George Doddington. 2002. Automatic evaluation
of machine translation quality using n-gram co-occurrence statistics. InProceedings of the second international conference on Human Language Tech-nology Research, pages 138–145. Morgan Kauf-mann Publishers Inc.
Shubham Gautam and Pushpak Bhattacharyya. 2014. Layered: Metric for machine translation evaluation. InProceedings of the Ninth Workshop on Statistical Machine Translation.
Jes´us Gim´enez and Llu´ıs M`arquez. 2010. Linguistic measures for automatic machine translation evalua-tion. Machine Translation, 24(3-4):209–240. Rohit Gupta, Constantin Or˘asan, and Josef van
Gen-abith. 2015. Reval: A simple and effective machine translation evaluation metric based on recurrent
neu-ral networks. In Proceedings of the 2015
Confer-ence on Empirical Methods in Natural Language Processing (EMNLP), Lisbon, Portugal.
Sepp Hochreiter and J¨urgen Schmidhuber. 1997.
Long short-term memory. Neural computation,
9(8):1735–1780.
Shafiq Joty, Francisco Guzm´an, Llu´ıs M`arquez, and Preslav Nakov. 2014. DiscoTK: Using Discourse Structure for Machine Translation Evaluation. In
Proceedings of the Ninth Workshop on Statistical Machine Translation.
Quoc Le and Tomas Mikolov. 2014. Distributed representations of sentences and documents. In Pro-ceedings of The 31st International Conference on Machine Learning, pages 1188–1196.
Matouˇs Mach´acek and Ondrej Bojar. 2014. Results of
the WMT-14 metrics shared task. InProceedings of
the Ninth Workshop on Statistical Machine Transla-tion.
Marco Marelli, Stefano Menini, Marco Baroni, Luisa Bentivogli, Raffaella Bernardi, and Roberto Zam-parelli. 2014. A sick cure for the evaluation of compositional distributional semantic models. In
Proceedings of LREC 2014.
Tomas Mikolov, Quoc V Le, and Ilya Sutskever. 2013a. Exploiting Similarities among Languages
for Machine Translation. CoRR, pages 1–10.
Tomas Mikolov, Ilya Sutskever, Kai Chen, Greg S Cor-rado, and Jeff Dean. 2013b. Distributed representa-tions of words and phrases and their
compositional-ity. InAdvances in Neural Information Processing
Systems, pages 3111–3119.
Kishore Papineni, Salim Roukos, Todd Ward, and Wei-Jing Zhu. 2002. BLEU: a method for automatic
evaluation of machine translation. In Proceedings
of the ACL, pages 311–318.
Jeffrey Pennington, Richard Socher, and Christopher D Manning. 2014. Glove: Global vectors for word
representation. In Proceedings of the Empiricial
Methods in Natural Language Processing (EMNLP 2014), pages 1532–1543.
Matthew Snover, Nitin Madnani, Bonnie Dorr, and Richard Schwartz. 2008. TERp system description. InMetricsMATR workshop at AMTA. Citeseer. Richard Socher, Eh Huang, and Jeffrey Pennington.
2011. Dynamic Pooling and Unfolding Recursive
Autoencoders for Paraphrase Detection. In
Ad-vances in Neural Information Processing Systems, pages 801–809.
Richard Socher, John Bauer, Christopher D. Manning, and Andrew Y. Ng. 2013a. Parsing With Composi-tional Vector Grammars. In Proceedings of the ACL, pages 455–465.
Richard Socher, Alex Perelygin, and Jy Wu. 2013b. Recursive deep models for semantic
composition-ality over a sentiment treebank. In Proceedings of
EMNLP, pages 1631–1642.
Kai Sheng Tai, Richard Socher, and Christopher D. Manning. 2015. Improved semantic representa-tions from tree-structured long short-term memory
networks. InProceedings of the 53rd Annual
Meet-ing of the Association for Computational LMeet-inguistics and the 7th International Joint Conference on Natu-ral Language Processing (Volume 1: Long Papers), pages 1556–1566, Beijing, China. Association for Computational Linguistics.