Does Management Walk The Talk?
Study Of Employee Perceptions
Zhanna Soldan, Curtin University of Technology, Perth, Western Australia
ABSTRACT
A survey-based study was conducted in one of the largest Australian Government Agencies with the aim to (1) empirically assess the extent to which employees’ perceived management receptivity to diversity management (PMRDM) varies by gender, ethnicity, age and organizational tenure and (2) examine the influence of various dimensions of organizational climate for diversity (OCFD) on PMRDM. Findings revealed that PMRDM varies by organizational tenure only, with employees with less than 1 year tenure perceiving that management is receptive to diversity management than those with 6 to 10 years and over 10 years tenure. Furthermore, of the 13 predictor variables, status, fairness, inclusion and treatment were found to be the predictors of PMRDM, explaining 63 per cent of the variance in PMRDM. The theoretical and practical implications of the results are discussed and the limitations of the study are noted along with suggested avenues for future research.
Keywords: Diversity management, gender, race, ethnicity, receptivity, tenure, age, diversity climate, inclusion, fairness, treatment, support, commitment.
INTRODUCTION
n recent years, diversity issues have gained increased attention as the Australian society and its workforce has become increasingly diverse in terms of race, ethnicity, nationality and gender (Dickie & Soldan 2008; Wilkinson & Cheng 1999). Almost 60 per cent of Australian CEOs report that their firms are diverse in terms of ethnicity, age and religion, 45 per cent in terms of gender, and 39 per cent in terms of language skills (Nicholas 2002), making talent management a top priority (Frank & Taylor 2004). While many Australian public services are investing substantial resources to develop and implement policies that promote understanding, tolerance and harmony (Junor & Coventry 2001; Strachan, Burgess & Sullivan 2004), research has consistently shown that senior management support for, and commitment to, diversity initiatives is crucial to diversity change efforts (Cox & Blake 1991; Konrad & Linnehan 1995a; b; Morrison 1992; Roberson 2006; Rynes & Rosen 1995; Thiederman 1994). Hence, a considerable amount of work has been focused on the attitudes of managers towards EEO and diversity management (Buttner, Lowe & Billings-Harris 2006; Hopkins, Hopkins & Mallette 2001; Naff 1998). However, less empirical work has focused on how the actions of management to effectively manage diversity are perceived by employees. Soldan (2009) attributes the limited nature of research of this kind to the lack of reliable and valid measure (Soldan 2009). Understanding employee perceptions of management actions is important because research on a number of areas of organizational behavior has demonstrated that behaviors are largely based on perceptions (Eisenberger, Fasolo & Davis-LaMastro 1990; Ilgen, Major & Tower 1994; Mor Barak 2005); hence, what people believe is of vital importance regardless of the accuracy of those perceptions.
(Cox 1993; Kossek & Zonia 1993; Soni 2000). Furthermore, OCFD has been presented in the literature as a construct with multiple (personal, group, organizational) dimensions that capture the essence of OCFD (Cox 1993); however, researchers have not been inclined towards using/testing the recently developed dimensions of OCFD (Soldan & Dickie 2008).
Hence, the current study will address the above-mentioned limitations in diversity management literature by (1) empirically assessing the extent to which PMRDM varies among Australian public sector employees and (2) examining the influence of perceptions of newly developed dimensions of OCFD on PMRDM.
LITERATURE REVIEW
Perceived Management Receptivity to Diversity Management (PMRDM) Soldan (2009) refers to PMRDM as employee perceptions of whether or not management is supportive of diversity programs. In Gaze‟s (2003) study of 328 hospital employees of an overseas US Navy Medical Treatment Facility (MTF), minorities such as Hispanic, Black, Asian workers reported that management does not practice what it preaches then did whites. Similarly, in Soni‟s (2000) study of 160 supervisory and 350 non-supervisory employees of the U.S. Environmental Protection Agency, women and minorities reported that not enough has been done by the agency to promote and address various diversity issues than did whites and men. Evidence also suggests that older workers are more likely to experience discrimination in access to training & development, to be denied promotions, to be refused employment, and to be selected for redundancy than are their younger counterparts (Drake Consulting Group 1999). These findings have led to the following hypotheses:
Perceived management receptivity to diversity management will vary between gender (H1), ethnic (H2), age (H3) and organizational tenure (H4) groups.
Organizational Climate for Diversity (OCFD) OCFD is referred to as the perceptions of personal, group and organizational dimensions that influence employee perceptions of management‟s receptivity to diversity programs (borrowed from Soni 2000). As organizational members share the same environment, unfortunately, they are assumed to experience or perceive the environment the same way. However, Bond & Pyle (1998, p. 593) contend that “there may be one organization but there are multiple realities”. Hence, researchers are urged to acknowledge that employees may experience or perceive the OCFD quite differently (Bond 1999; Bond & Pyle 1998; Kossek & Zonia 1993). OCFD is determined by a variety of social-psychological conditions and phenomena (Cox 1993).
For instance, one of the elements considered important in organizational settings is an explicit value for diversity among organizational members (Cox 1993; Mor Barak 2005). Studies have found that perceptions of OCFD differ in the extent to which organizational members value diversity (Cox 1993; Ely & Thomas 2001; Jackson 1992; Kossek & Zonia 1993; Mor Barak, Cherin & Berkman 1998). Specifically, women and ethnic minorities in the study of Mor Barak, Cherin & Berkman (1998) expressed a stronger belief in the value of diversity than did Caucasians and males.
Perceived fairness of human resource management policies and practices is another important element in organizational settings. In spite of the progress made in the workforce to eliminate discrimination, organizations continue to pay lip service to implementation of equal opportunity legislation. Sadly, evidence for discrimination has been found at all organizational levels: from entry into organizations to career development and promotion. For instance Kraiger and Ford‟s (1985) meta-analysis of over 70 studies revealed that black employees tend to receive lower ratings of job performance than white employees, especially when the raters are themselves white. This tendency appears to be equally strong for both black and white raters. Subsequent research also revealed that blacks continue to receive lower scores and evaluations on both objective and subjective measures than their white counterparts (Mount et al. 1997; Prewett-Livingston et al. 1996; Roth, Bobko & Huffcutt 2003). Recently, Stauffer and Buckley (2005) revisited the issue of racial bias in supervisory ratings of performance and confirmed the existence of racial bias in supervisory ratings.
Furthermore, evidence suggests that women and ethnic minorities continue to encounter a „glass ceiling‟ that keeps them from reaching the higher echelons of management (Morrison & von Glinow 1990) and, consequently, the advancement rates of women and ethnic minorities are much slower than for white men. For instance, Hurley and Sonnenfeld (1995) established that the promotion rates for whites are much greater than for minorities. Similarly, Thomas et al (1998) found that whites are more likely to be viewed as outstanding leaders and given higher recommendations for promotion than their African-American counterparts. Pekkarinen and Vartiainen (2006) examined gender differences in promotion and found that women are less likely to get promoted than men even though they started their careers in the same jobs. In academia, Todd and Bird‟s (2000) study revealed significant differences in the patterns of appointment of men and women to academic positions. While a greater proportion of women were appointed at lower levels or on casual and/or short-term contracts, a significant proportion of men were appointed at higher levels, indicating a less favourable nature of women‟s employment than that of men.
Nixon (1985), on the other hand, found that minorities in organizations receive fewer opportunities for training and development that prepare them for additional responsibilities. Tharenou, Latimer and Controy (1994) studied male and female Australian managers of both public and private sectors and found that training and development significantly varies by gender. Specifically, women receive less encouragement in their careers and less training regardless of their work experience, and the training they receive has a less powerful effect on their career progression.
Perceptions of management actions that affect inclusion/exclusion of disadvantaged groups is another important element in organizational settings. Unfortunately, evidence suggests that many historically disadvantaged groups continue to be excluded and marginalized in a variety of social contexts on the basis of their demographic attributes. For instance, studies of structural relationship patterns by Ibarra (1992; 1993; 1995) and more recently by Mollica, Gray and Trevino (2003) observed that individuals strive toward homophily (the degree to which pairs of individuals who interact are similar in identity or organizational group affiliations) in their social and career networks. Subsequently, in order to maintain dominance within organizations, men have tendency to exclude women from informal networks through the use and maintenance of the “old boys‟ network” (Burke, Rothstein & Bristor 1995). Thus, the perpetuation of “old boys‟ networks” remains an issue of concern (Arkin 1988) and a predominant barrier for women‟s progress into senior management. While some studies found that minorities perceive themselves as either partially or totally alienated from the formal and informal aspects of corporate life (Greenhaus, Parasuraman & Wormley 1990; Nixon 1985), others found that women are often ignored and excluded from informal networks and having access to relevant information or decision-making networks within the organization, making it difficult to learn how to manage or participate in organizational life (Cross & Linnehan 2006; Findler, Wind & Mor Barak 2007; Glazer-Raymo 1999). Similarly, men and Caucasian employees in Mor Barak, Cherin and Berkman‟s (1998) study perceived their organization as more inclusive of women and minorities than did women and minorities. However, the interviews with women and ethnic minorities revealed that dissimilar employees are often excluded from important “networks of information and opportunity” (p.50). Many minorities reported discomfort associated with personal networking which was viewed by them as “blowing one‟s horn”.
in expressions of opinions or viewpoints, the ideas of women and ethnic minorities are likely to be ignored or adopted only if the same idea was brought up by a white male later (Gordon, DiTomaso & Farris 1991) and, consequently, they may take the path of least effort and become reluctant to voice new ideas (Nemeth 1986) or express unwillingness to be involved in projects that require consideration of the ideas from different gender and ethnic viewpoints (Larkey 1996a, 1996b). Different values, beliefs, worldviews or linguistic cues of individuals are likely to lead to misunderstandings and breakdown in communications (Fine 1991; Banks, Ge & Baker 1991). Furthermore, women and ethnic minorities are likely to perceive that they are treated more negatively (e.g. excluded, not adjusted to or listened to) than white men and, consequently, their perceptions are likely to disrupt the cohesiveness of workgroups (Larkey 1996a; 1996b). Therefore, the possible interaction difficulties such as understanding (interpretation that either distorts or confirms the content or intent of communication), treatment (differential benevolence directed toward a person through communication, judgment or other means), ideation (articulation of a variety of ideas and perspectives in group process) and cohesiveness(the degree to which group members are attracted to each other) are also considered as important elements in organizational settings.
Therefore, the current study considers the above-mentioned elements as important dimensions of organizational climate for diversity (OCFD). To the author‟s knowledge, there is no research that formally recognizes that the relationship between those dimensions of OCFD and PMRDM exists. However, the findings of the above studies and the claims made in the literature that OCFD could be a key explanatory variable (Cox 1993; Kossek & Zonia 1993; Soni 2000) provided underpinning for the following hypothesis:
Perceptions of organizational climate for diversity (i.e. value, comfort, fairness, inclusion, understanding, treatment, ideation, cohesiveness) will predict perceived management receptivity to diversity management (H5)
RESEARCH METHODS
Procedure and Sample
The current study was conducted in one of the largest Australian Government organizations referred to as the „Agency‟ as its identity was requested to be kept anonymous. Permission for the research was granted from the participating agency and the primary source of contact was well established with nominated key representatives of the agency able to facilitate the data collection process. Prior to implementation, the questionnaire was pilot tested with 20 employees of the Agency. Feedback from the pilot study was collected and consolidated by the agency representatives; based upon the feedback, one item was deleted and language adjustments were made to a couple of items to suit the context of the current study. Following the changes made to the original questionnaire, an online survey was designed and activated for submission. Participants were given two weeks to complete and submit the survey.
Sample
A total of 1750 employees were invited by the representatives of the agency to participate in the study, with completion of the survey being completely voluntary and anonymous. Of the 1750 invited employees, a total of 391 employees responded to the survey, yielding a 22 per cent response rate. It is possible that the response rate was impacted by the shortage of time given to respondents to complete the survey.
groups other than Caucasian and label them as „minorities‟ and those with Caucasian backgrounds as „majorities‟ for the purposes of bivariate correlation and multiple regression analyses. The distribution of gender, ethnicity, status, age and organizational tenure in the sample was representative of the demographics of the agency where the study was conducted.
Measures
A total of 34 questions captured the variables of interest for the purposes of the study. A 7-point Likert scale was used, ranging from 1, anchoring on „strongly disagree’ to 7, anchoring on „strongly agree’. The details are provided below:
Demographics. Five questions captured the demographic information on gender, age, status, organizational tenure and ethnicity. The following categories were assigned to demographic data: gender (female and male); age (under 20, 20-29, 30-39, 40-49, 50-59, 60 and over); position level (managerial and non-managerial); organizational tenure (less than 1 years, 1-5 years, 6-10, over 10 years) and ethnicity (African, Hispanic, Indigenous/Torres Strait Islander, Asian/Pacific Islander, Middle Eastern, Caucasian, Other to be specified). Overall, with no missing data, the quality of the data collected was excellent in terms of completeness.
Personal Dimensions. Three items measuring value and another three measuring comfort were adapted from the Diversity Perceptions Scale (DPS) developed by Mor Barak, Cherin and Berkman (1998). Two items were reverse-scored. The reliability for the original subscales was .77 (value) and .71 (comfort). In this study, the reliability score was .52 (value) and .36 (comfort). An example item was: “I think that diverse viewpoints add value”.
Intergroup Dimensions. Four items measuring ideation, three items measuring understanding, four items measuring treatment and another three measuring cohesiveness were adapted from the Workforce Diversity Questionnaire (WDQ) developed by Larkey (1996a). As the items, with the exception of those measuring cohesiveness, describe the difficulties encountered in interactions, they were inverted, so the desirable rating was low rather than high. The reliability for the original subscales ranged from .64 to .75 (ideation .75, understanding .64, treatment .74, cohesiveness .73). In this study, the internal reliability of the subscales ranged from .64 to .85 (ideation .64, understanding .71, treatment .85, cohesiveness .85). An example item was: “When people from different backgrounds work together in groups, I feel offended because my ideas are not acknowledged”.
Organizational Dimensions. Six items measuring fairness and three items measuring inclusion were adapted from the Diversity Perceptions Scale (DPS) developed by Mor Barak, Cherin and Berkman (1998). Two items were reverse-scored. The example item was: “Managers apply human resource policies (e.g. provision of sick leave) fairly for all employees”. The internal consistency estimates (alpha coefficients) for the original subscales were .86 (fairness) and .80 (inclusion). In this study, the internal reliability of the subscales was .87 (fairness) and .42 (inclusion).
Perceived Management Receptivity to Diversity Management (PMRDM) was measured using the scale developed by Soni (2000). The original instrument consisted of 10 items measuring the understanding of the aims of diversity programs and the level of employee support for the programs. As the details of factor loadings or inter-correlations were not reported by previous studies, Soldan (2009) subjected the 10-item scale to exploratory factor analysis and identified three underlying dimensions, including (1) diversity management understanding, (2) employee receptivity to diversity management, and (3) perceived management receptivity to diversity management (PMRDM). The current study utilized PMRDM dimension, consisting of three items, namely: “The department does not do enough to address various diversity issues”; “The department „practices what it preaches‟ about diversity management” and “Most managers in the organization set a positive example of how to effectively manage diversity”. One item was reverse-coded. The Cronbach‟s alpha for the three items was .80.
RESULTS AND DISCUSSION
Descriptive Statistics: Antecedent and Outcome Variables
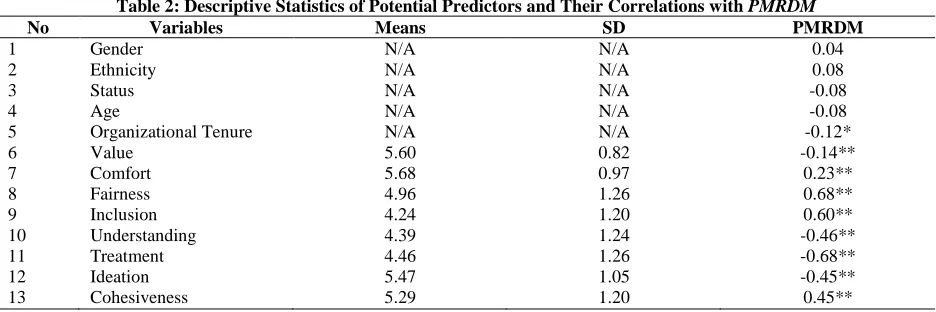
Descriptive statistics of the variables, presented in Table 2, reflected several interesting findings with reported levels of variables between moderate and relatively high. For instance, the means for fairness, inclusion, understanding, treatment and PMRDM were moderate, all falling between four (Neither agree nor disagree) and five (Slightly agree) on a seven-point scale; whereas the mean scores for value, comfort, cohesiveness and ideation were relatively high, all falling between five (Slightly agree) and six (Moderately agree). Overall, descriptive statistics of the PMRDM variable indicate that employees within the agency moderately perceive that management is receptive to diversity programs.
Differences in Perceived Management Receptivity to Diversity Management (PMRDM)
In order to determine whether or not statistically significant differences exist between employees with different gender, ethnic, age and organizational tenure groups in relation to PMRDM, Comparison of Means tests ( t-tests) and Analysis of Variance (ANOVA) tests were performed. Having obtained statistically significant results, the nature of the emerged differences was examined using Tukey‟s Honesty Significant Different (HSD) procedure.
The t-tests revealed that there is no statistically significant difference between males and females (t=-.74, p=.460) and minorities and majorities (t=-1.54, p=.123) in relation to PMRDM. Therefore Hypotheses 1 & 2 were not supported. These results were inconsistent with the findings of previous studies (Gaze 2003; Soni 2000), which postulate that PMRDM will vary between gender and ethnic groups. The lack of significant difference between ethnic groups (minorities vs majorities) may be attributable to the limited sample size of groups other than Caucasian. It is important to note, however, that had larger samples of ethnic groups other than Caucasian been available, it is possible that the difference might have attained significance and the relationship between ethnicity and PMRDM be regarded as worthy of further investigation.
The ANOVA tests revealed that the difference between age groups (under 20, 20-29, 30-39, 40-49; 50-59, 60 and over) with respect to PMRDM was not significant (F=1.240, p=.289). Hence, Hypothesis 3 was not supported. However, a statistically significant difference emerged between groups with different organizational tenure in relation to PMRDM (F=2.996, p<0.05). In order to determine which groups (means) were significantly different, a post-hoc test was performed using Tukey‟s HSD procedure. Table 1 presents the Post Hoc (Tukey) test results for groups with different organizational tenure.
Table 1: Post Hoc Test Results Organizational Tenure Comparisons: PMRDM
Variable Organizational Tenure Groups ANOVA
Less than 1 year (N=42)
1
1-5 years (N=219)
2
6-10 years (N=67)
3
Over 10 years (N=63)
4
F Tukey‟s HSD
PMRDM 4.91 4.40 4.24 4.23 2.996* 1>3*; 1>4*
Note: The mean difference is significant at the 0.05 level
Bivariate Correlations
Bivariate correlations showing the strength and direction of the linear relationships between PMRDM and the anticipated predictor variables, including gender, ethnicity, age, organizational tenure, status are reported in Table 2. An examination of bivariate relationships revealed that of the 13 predictor variables, with the exception of gender, ethnicity, age and status, all other predictor variables significantly correlate with PMRDM. In addition to the level of significance, some of these correlations were of moderate strength, suggesting that the relationships were of importance. Although PMRDM had a reasonable association with those predictor variables, very strong relationships (r > 0.80) were not established.
Table 2: Descriptive Statistics of Potential Predictors and Their Correlations with PMRDM
No Variables Means SD PMRDM
1 Gender N/A N/A 0.04
2 Ethnicity N/A N/A 0.08
3 Status N/A N/A -0.08
4 Age N/A N/A -0.08
5 Organizational Tenure N/A N/A -0.12*
6 Value 5.60 0.82 -0.14**
7 Comfort 5.68 0.97 0.23**
8 Fairness 4.96 1.26 0.68**
9 Inclusion 4.24 1.20 0.60**
10 Understanding 4.39 1.24 -0.46**
11 Treatment 4.46 1.26 -0.68**
12 Ideation 5.47 1.05 -0.45**
13 Cohesiveness 5.29 1.20 0.45**
Note: a) *p<0.05; **p<0.01.
Regression Analysis
To determine the best set of predictors for PMRDM, individual characteristics such as gender, ethnicity, status, age, organizational tenure and all eight dimensions of OCFD were regressed with PMRDM. Results, as in Table 3, showed that only status, treatment, fairness and inclusion variables were significantly associated with PMRDM (F=38.615, p<0.01), explaining 63 per cent of the variance in PMRDM. Hence, Hypothesis 5 was supported. These results, therefore, were consistent with the findings of previous studies (Cox 1993; Kossek & Zonia 1993; Soni 2000) which implied that the perception of OCFD is the key explanatory variables of PMRDM. Of the four predictors, inclusion (β=0.32) and fairness (β=0.31) were the most important predictors followed by treatment (β=-0.30), indicating that the fairer the perception of HR practices/policies and the greater the perception of actions undertaken by management that affect the inclusion of women and ethnic minorities, the more likely that employees will perceive that management is receptive to diversity management. A negative association between treatment and PMRDM is due to the fact that items measuring treatment were negatively phrased, indicating that the greater the adverse treatment individuals receive through communication, judgment or other means the lower the perception that management is receptive to diversity management. Interestingly, negative association of status (managerial vs non-managerial) with PMRDM suggests that there is a possibility that employees may perceive that management pays lip service to diversity management.
Table 3: Regression Analysis of the Predictors for PMRDM
Variables PMRDM
Beta t
Status -0.08* -2.436
Treatment -0.30** -5.599
Fairness 0.31** 6.525
Inclusion 0.32** 8.939
Adjusted R2 .63
F Value Sig. of F
51.493 .000
CONCLUSION AND IMPLICATIONS
The findings of the current study have both theoretical and practical implications. First, the study examined the extent to which employees‟ perceived management receptivity to diversity management (PMRDM) varied by gender, ethnicity, age and organizational tenure, using the recently tested by Soldan (2009) measure of PMRDM. The study was extended to the sample of Australian public sector employees as research of this kind lacked in Australia (Soldan 2009; Soldan & Dickie 2008). It was established that while there was no significant difference between gender, ethnic and age groups with respect to PMRDM, a significant difference emerged between groups with different organizational tenure in relation to PMRDM. Specifically, employees that have been with the agency for less than 1 year perceive that management is receptive to diversity programs than those with 6 or more years tenure. In addition, the current study substantiated the findings of previous studies mostly conducted in North America (Cox 1993; Kossek & Zonia 1993; Soni 2000) that the perception of organizational climate for diversity (OCFD) is a key explanatory factor of PMRDM. The current study used the newly developed (personal, group, organizational) dimensions of OCFD as researchers have not been inclined towards using/testing those dimensions, especially in Australian context (Soldan & Dickie 2008). Specifically, of the eight dimensions of OCFD, fairness, inclusion and treatment along with status emerged as predictors of PMRDM. Furthermore, by using/testing the new dimensions of OCFD, the study revealed that the internal consistency of some of the dimensions was below Nunally‟s (1978) recommended cutoff (.70) for acceptable reliability, suggesting that a greater care must be taken when the original dimensions of OCFD are used in a different context.
The findings of the study have implications for the management of the agency as well. For instance, managers need to acknowledge that their actions in effectively managing diversity are perceived differently by employees. The differences in PMRDM among employees suggest that, despite the existence of diversity policies developed and implemented by management, employees are more likely to believe that management pays lip service to diversity management. As managers are empowered to make decisions for the organization, whether they „walk the talk‟ appears to matter greatly to employees. Managers need to understand the critical role they play in defining diversity change within the agency. When a diversity plan is implemented they need to follow through with internal assessment and visible, active and ongoing support and commitment (Muir 1996). They must hold themselves responsible for managing diversity and demonstrate their commitment through their day-to-day actions (Hemphill & Haines 1997) or else the level of cynicism and mistrust will escalate. Statistically significant relationships between perceptions of fairness, treatment, inclusion and PMRDM suggest that management needs to ensure that (a) the existing HR policies, practices and procedures are fair and equitable for all employees; (b) employees are encouraged to participate in decision-making process and when opinions are expressed, they are taken into account; mentoring programs are introduced and everyone has access to those programs; the communication between employees and managers is open; social networks are encouraged; and (c) employees and managers treat each other with respect and are tolerant of each other‟s background, customs, traditions, culture.
LIMITATIONS AND DIRECTIONS FOR FUTURE RESEARCH
AUTHOR INFORMATION
Zhanna Soldan is currently completing her PhD studies on diversity management at Curtin University of Technology. In 2004, she received her Master of Commerce (Management) degree with distinction from Curtin University of Technology and a BE from Kazakh State University of World Languages. She joined Curtin Business School as a sessional academic in January 2003. Her research interests focus on diversity management, strategic management, group dynamics, and cross-cultural leadership.
REFERENCES
1. Arkin, A. (1998). A Suitable Old Boy? People Management, 4(9), 28-33.
2. Banks, S., Ge, A., & Baker, J. (1991). Intercultural Encounters and Miscommunication. In M. Coupland, H. Giles & J. Wiemann (Eds.), Miscommunication and Problematic Talk. Newbury Park: Sage Publications, 103-120.
3. Bond, M. A. (1999). Gender, Race, and Class in Organisational Contexts. American Journal of Community Psychology, 27(3), 327-355.
4. Bond, M.A. & Pyle, J.L. (1998). The Ecology of Diversity in Organisational Settings: Lessons from a Case Study‟, Human Relations, vol. 51, no. 5, pp. 589-624.
5. Burke, R.J., Rothstein, M.G. & Bristor, J.M. (1995). Interpersonal Networks of Managerial and Professional Women and Men: Descriptive Statistics. Women in ManagementReview, 10(1), 21-27. 6. Buttner, E.H., Lowe, K.V. & Billings-Harris, L. (2006). The Influence of Organizational Diversity
Orientation and Leader Attitude on Diversity Activities. Journal of Managerial Issues, XVIII(3), 356-371. 7. Byrne, D. (1971). The Attraction Paradigm. New York: Academic Press.
8. Consulting Partners of Australia (2001). Report Card: AHRI’s Workforce Diversity Management Survey 2001, Melbourne.
9. Cox, T. (1993). Cultural Diversity in Organisations: Theory, Research and Practice. San Francisco: Berrett-Koehler Publishers.
10. Cox, T. & Blake, S. (1991). Managing Cultural Diversity: Implications for Organisational Competitiveness. Academy of Management Executive, 5(3), 45-56.
11. Cross, C. & Linehan, M. (2006). Barriers to Advancing Female Careers in the High-Tech Sector: Empirical Evidence from Ireland. Women in Management Review, 21(1), 28-39.
12. Dickie, C. & Soldan, Z. (2008). Diversity Management. Prahran, VIC: Tilde University Press. 13. Dovidio, J. & Gaertner, S. (1986). Prejudice, Discrimination, and Racism: Historical Trends and
Contemporary Approaches. In J. Dovidio & S. Gaertner (Eds.), Prejudice, Discrimination, and Racism, California: Academic Press, 1-34.
14. Drake Consulting Group (1999). Age Discrimination is Alive and Well. Drake Consulting Group: Media release, 27 October.
15. Eisenberg, R., Fasolo, P. & Davis-LaMastro, V. (1990). Perceived Organizational Support and Employee Diligence, Commitment, and Innovation. Journal of Applied Psychology, 75(1), 51-59.
16. Ely, R. & Thomas, D. (2001). Cultural Diversity at Work: The Effects of Diversity Perspectives on Work Group Processes and Outcomes. Administrative Science Quarterly, 46(2), 229-73.
17. Findler, L., Wind, L.H. & Mor Barak, M.E. (2007). The Challenge of Workforce Management in a Global Society: Modeling the Relationship between Diversity, Inclusion, Organizational Culture, and Employee Well-Being, Job Satisfaction and Organizational Commitment. Administration in Social Work, 31(3), 63-94.
18. Fine, M. (1991). New Voices in the Workplace: Research Directions in Multicultural Communication. Journal of Business Communication, 28(3), 259-275.
19. Frank, F.D. & Taylor, C.R. (2004). Talent Management: Trends That Will Shape the Future. Human Resource Planning, 27(1), 33-42.
20. Gaze, J. (2003). Reception for Diversity in an Overseas United States Navy Medical Treatment Facility, PhD Thesis: Touro University International.
22. Gordon, G., DiTomaso, N. & Farris, G. (1991). Managing Diversity in R&D Groups. Research Technology Management, 34(1), 18-37.
23. Greenhaus, J.H., Parasuraman, S. & Wormley, W.M. (1990). Effects of Race on Organizational Experiences, Job Performance Evaluations, and Career Outcomes. Academy of Management Journal, 33(1), 64-86.
24. Guildford, J.P. (1965). Fundamental Statistics in Psychology and Education (4th ed.). New York, NY: McGraw-Hill.
25. Hemphil, H. & Haines, R. (1997). Discrimination, Harassment, and the Failure of Diversity Training: What to Do Now. Westport, Connecticut: Quorum Books.
26. Hopkins, W., Hopkins, S. & Mallette, P. (2001). Diversity and Managerial Value Commitment: A Test of Some Proposed Relationships. Journal of Managerial Issues, 13(3), 288-306.
27. Hurley, A.E. & Sonnenfeld, J.A. (1995). Organizational Growth and Employee Advancement: Tracking the Opportunities. In M. London (Eds.), Employees, Careers, and Job Creation: Developing Growth-Oriented Human Resource Strategies and Programs, San Francisco: Jossey-Bass, 31-48.
28. Ibarra, H. (1992). Homophily and Differential Returns: Sex Differences in Network Structure and Access in an Advertising Firm. Administrative Science Quarterly, 37(3), 422-448.
29. Ibarra, H. (1993). Personal Networks of Women and Minorities in Management: A Conceptual Framework. Academy of Management Review, 18(1), 56-87.
30. Ibarra, H. (1995). Race, Opportunity, and Diversity of Social Circles in Managerial Networks. Academy of Management Journal, 38(3), 673-703.
31. Ilgen, D.R., Major, D.A. & Tower, S.L. (1994). The Cognitive Revolution in Organizational Behavior. In J. Greenberg (Eds.), Organizational Behavior: The State of the Science, Hillsdale, NJ: Erlbaum.
32. Jackson, S.E. (1992). Team Composition in Organizations. In S. Worchel, W. Wood & J. Simpson (Eds.), Group Process and Productivity, London, UK: Sage Publications, 1-12.
33. Junor, A. & Coventry, H. (2001). Diversity Management. In C. Aulich, J. Halligan & S. Nutey (Eds.), Australian Handbook of Public Sector Management, Grows Nest: Allen & Unwin, 86-98.
34. Kanter, R.M. (1977). Men and Women of the Corporation. New York, NY: Basic Books.
35. Konrad, A.M. & Linnehan, F. (1995a). Formalized HRM Structure: Coordinating Equal Employment Opportunity or Concealing Organizational Practices? Academy of Management Journal, 38(3), 787-820. 36. Konrad, A.M. & Linnehan, F. (1995b). Race and Sex Differences in Line Managers‟ Reactions to Equal Employment Opportunity and Affirmative Action Interventions. Group and Organization Studies, 20(4), 409-439.
37. Kossek, E. & Zonia, S. (1993). Assessing Diversity Climate: A Field Study of Reactions to Employer Efforts to Promote Diversity. Journal of Organisational Behaviour, 14(1), 61-81.
38. Kraiger, K. & Ford, J.K. (1985). A Meta-Analysis of Ratee Race Effects in Performance Ratings. Journal of Applied Psychology, 70(1), 56-66.
39. Kulik, C. & Bainbridge, H. (2006). Psychological Perspectives on Workplace Diversity. In A. Konrad, P. Prasad & J. Pringle (Eds.), Handbook of Workplace Diversity, London, UK: Sage Publications, 25-52. 40. Larkey, L. (1996a). The Development and Validation of the Workforce Diversity Questionnaire: An
Instrument to Assess Interactions in Diverse Workgroups. Management Communication Quarterly, 9(3), 296-338.
41. Larkey, L. (1996b). Toward a Theory of Communicative Interactions in Culturally Diverse Workgroups. Academy of Management Review, 21(2), 463-91.
42. Mollica, K., Gray, B. & Trevino, L. (2003). Racial Homophily and Its Persistence in Newcomers‟ Social Networks. Organization Science, 14, 123-136.
43. Mor Barak, M.E. (2005). Managing Diversity: Toward a Globally Inclusive Workplace. Thousand Oaks: Sage Publications.
44. Mor Barak, M.E., Cherin, D.A. & Berkman, S. (1998). Organisational and Personal Dimensions in Diversity Climate: Ethnic and Gender Differences in Employee Perceptions. Journal of Applied Behavioural Science, 34(1), 82-104.
45. Morrison, A.M. (1992). The New Leaders: Guidelines on Leadership Diversity in America. San Francisco: Jossey-Bass.
47. Mount, M.K., Sytsma, M.R., Hazucha, J.F. & Holt, K.E. (1997). Rater-Ratee Race Effects in Developmental Performance Ratings of Managers. Personnel Psychology, 50(1), 51-69.
48. Muir, C. (1996). Workplace Readiness for Communicating Diversity. Journal of Business Communication, 33(4), 475-484.
49. Naff, K. (1998). Progress toward Achieving a Representative Federal Bureaucracy: The Impact of Supervisors and Their Beliefs. Public Personnel Management, 27(2), 135-50.
50. Nemeth, C. (1986). Differential Contributions of Majority and Minority Influence. Psychological Review, 93(1), 23-32.
51. Nicholas, S. (2002). Corporate Awareness of Diversity in the Australian Workplace: The Mind of the CEO. Canberra: Australian Centre for International Business.
52. Nixon, R. (1985). Black Managers in Corporate America: Alienation or Integration‟, Washington, DC: National Urban League.
53. Nunally, J.C. (1978). Psychometric Theory. New York: McGraw-Hill.
54. Pekkarinen, T. & Vartiainen, J. (2006). Gender Differences in Promotion on a Job Ladder: Evidence from Finnish Metalworkers. Industrial and Labor Relations Review, 59(2), 285-301.
55. Pelled, L.H., Ledford, G.E., & Mohrman, S.A. (1999). Demographic dissimilarity and workplace inclusion. Journal of Management Studies, 36(7), 1013-1031.
56. Pettigrew, T.F. & Tropps, L.R. (2000). Does intergroup contact reduce prejudice? Recent meta-analytic findings. In S. Oskamp (Eds.), Reducing prejudice and discrimination, Hillsdale, NJ: Lawrence Erlbaum Associates, 93-114.
57. Prewett-Livingston, A.J., Field, H.S., Veres, J.G. & Lewis, P.M. (1996). Effects of Race on Interview Ratings in a Situational Panel Interview. Journal of Applied Psychology, 81(2), 178-186.
58. Roberson, Q.M. (2006). Disentangling the Meanings of Diversity and Inclusion in Organizations. Group Organization Management, 31, 212-236.
59. Roth, P.L., Bobko, P. & Huffcutt, A.I. (2003). Ethnic Group Differences in Measures of Job Performance: A New Meta-Analysis. Journal of Applied Psychology, 88(4), 694-707.
60. Rynes, S. & Rosen, B. (1995). A Field Survey of Factors Affecting the Adoption and Perceived Success of Diversity Training. Personnel Psychology, 48(2), 247-270.
61. Soldan, Z. (2009). A Critical Evaluation of the Receptivity to Diversity Management (RDM) Scale in an Australian Public Sector Organization. International Journal of Business Research, 9(1), 140-146. 62. Soldan, Z. & Dickie, L. (2008). Employee Receptivity to Diversity Management: Perceptions in a Federal
Government Agency. International Journal of Diversity in Organizations, Communities & Nations, 8(3), 195-204.
63. Soni, V. (2000). A Twenty-First-Century Reception for Diversity in the Public Sector: A Case Study. Public Administration Review, 60(5), 395-423.
64. Stauffer, J. & Buckley, M. (2005). The Existence and Nature of Racial Bias in Supervisory Ratings. Journal of Applied Psychology, 90(3), 586-591.
65. Strachan, G., Burgess, J. & Sullivan, A. (2004). Affirmative Action or Managing Diversity: What Is the Future of Equal Opportunity Policies in Organisations? Women in Management Review, 19(4), 196-204. 66. Tharenou, P., Latimer, S. & Conroy, D. (1994). How Do You Make to the Top? An Examination of
Influences on Women‟s and Men‟s Managerial Advance. Academy of Management Journal, 37(4), 899-931.
67. Thiederman, S. (1994). Staff Diversity: The Best of All Backgrounds. Association Management, 46, 57-60. 68. Thomas, P.J., Edward, J.E., Perry, Z. & Dvaid, K.M. (1998). Racial Differences in Male Navy Officer
Fitness Reports. Military Psychology, 10(2), 127-143.
69. Todd, P. & Bird, D. (2000). Gender and Promotion in Academic. Equal Opportunities International, 19(8), 1-15.
70. Turner, J.C. (1985). Social Categorization and the Self-Concept: A Self-Cognitive Theory of Group Behavior. In E.J. Lawler (Eds.), Advances in Group Processes: Theory and Research, Greenwich, Ct: JAI Press.
71. Turner, J.C. (1987). Rediscovering the Social Group: A Self-Categorization Theory‟, Oxford: Blackwell. 72. Wilkinson, I. & Cheng, C. (1999). Perspectives: Multicultural Marketing in Australia: Synergy in