VALIDATIO OF LC-MS/MS METHOD FOR THE
QUATIFICATIO OF ORETHIDROE I HUMA
PLASMA
*M.Ganesan1, Dr. S.anjundan2, M.Gomathi3 and S.Muralidharan1
1
Micro Therapeutic Research Labs Private Limited, Chennai 2
PERI Institute of Technology, Mannivakkam, Chennai-85 3
A.J. College of Pharmacy, Chennai
Summary
Liquid chromatography coupled to tandem mass spectrometry (LC-MS/MS) methods are described, one for the quantitative determination of Norethindrone (NOR) in human. The plasma method is based on solid-phase extraction. Detection takes place by ion-spray tandem mass spectrometry in the positive ion mode. Method validation results show that the method is sufficiently selective and capable of quantifying the analytes with good precision and accuracy in the concentration range of 0.1608 to 34.9782 ng/mL. The developed LC/MS-MS method was found to be selective, simple, sensitive, accurate and linear for the analysis of Norethindrone in human plasma.
Keywords: Norethindrone, Validation, LC/MS-MS
Introduction
Norethindrone is chemically 17-Hydroxy-19-Nor-17α-pregn-4-en-20-yn-3-one. Norethindrone [NOR] and on pharmacodynamic variables that may be increased in the event of reduced contraceptive efficacy (concentrations of serum luteinizing hormone [LH], follicle-stimulating hormone [FSH], and progesterone.These methods have reported recovery to be 67-84.29%. The exact recovery can be obtained by comparing the response of processed spikedplasma with that of aqueous samples at the same concentration. The matrix effect can be evaluated by comparing spiked processedplasma blanks with aqueous samples at the same concentration.By knowing the recovery and matrix effect, the sensitivity ofthe method can be improved.
A specific and sufficiently sensitive method was required for the quantification of plasma NOR levels in clinical trials.The lowest limit of quantification was kept at 0.1608 ng/mL and the upper limit was 34.9782 ng/mL. Only limited methods are available in biological and analytical1-7.In this study we reported a simple, robust, sensitive and reproducible method hasbeen developed and validated to estimate NOR concentrations in human plasma. The validated method was applied to quantify plasma NOR concentrations in rat to determine the effect ofNorethindrone on plasma NOR levels.
Materials and Methods
Chemicals and reagents
Norethindrone was obtained from Lupin Pharmacare, Pithampur, India and the internal standard (IS), Norethindrone – d6 wasfrom Varda Biotech (P) Ltd, Mumbai, India. The All solvents and other reagents were of analytical grade. Control human plasma (EDTAanticoagulant) for the preparation of quality control (QC) sampleswas obtained from a blood bank and stored at –70°Cbefore use.
Column liquid chromatography
The column was an Acquity UPLC @ BEH column (100 mm x 2.1 mm, 1.7 µm particle size). The column waskept at 40ºC temperature. The mobile phase consisted of ammoniumformate buffer (2 mM, and acetonitrile (40:60, v/v). The flow rate was 0.6 mL/min,and the total run time was 5.5 min.
Mass spectrometry
The liquid chromatograph (Waters Acquity; USA) was coupled to a mass spectrometer with a turbo electrospray ion source (4000 Qtrap) and was used in positive ionization mode with the following source settings. The turbo ion-spray interfacewas. Analyst software (version1.4.2) was used for data registration.
Sample preparation
1 mL of water. Loaded the samples into cartridges and applied the gas.Washed the cartridges with 1 mL 0.05 ammonium acetate followed by 1 mL of 5% methanol in water twice. Dried the cartridges approximately for 3 minutes and elute with 300 µL of mobile phase. Loaded the processed samples into LC-MS/MS.
Standard curves
The calibration curve (CC) standards were prepared in water by adding known amounts of NOR. Lower limit of quantification(LLOQ) QC and low-quality control (LQC) samples were obtainedby spiking NOR in methanol. Quality control samples Lower Quality Control (LQC), Middle-quality control (MQC) and high-quality control (HQC) samples were obtained by spiking in plasma with concentrations of 0.4682 11.1473 and 27.8682 ng/mL, respectively. The bulk-spiked CC and QC samples were stored at –70°C. All calibration curves consisted of one blank sample and eight calibration points in the concentration range of 0.1608–34.9782ng/mL. The concentrations were corrected for potency and amountweighed. The resulting peak area ratios were plotted againstthe concentrations.
Validation
Specificity
A specificity exercise was performed for both water and plasma. Individual blank plasma samples, LLOQ QC samples, and water (blank) (n = 6) were prepared according to the sample preparation procedure described above and screened for interference.
Recovery
The recovery exercise was performed at all QC levels by comparing the response (area) of processed QC samples with those of directly injected QC samples. The dilutions were made in suitable solution to keep conditions the same.
Matrix effect
To study the matrix effect, blank plasma samples were processedand spiked later to obtain MQC and HQC concentrations. The response (area) was compared with directly injected samples at MQC andHQC levels.
Inter-assay and intra-assay imprecision and accuracy
Inter-assay and intra-assay imprecision and accuracy were evaluated by spiking known amounts of NOR and IS in plasma. Fourdifferent concentrations were used, and samples were preparedaccording to the procedure mentioned above. Intra-assay imprecision and accuracy were assessed within one batch, whereas inter-assay imprecision and accuracy were assessed on three separate occasions.
Stability
refrigerated stocksolutions. The drug and IS response ratios of stored and freshstocks were compared. In other stability studies, five replicates of LQC and HQC were analyzed.
Results
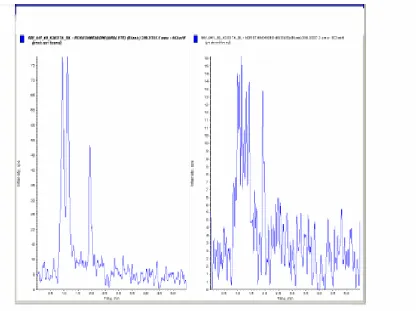
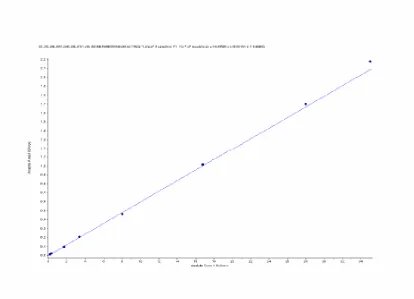
A high-performance liquid chromatographic mass spectrometric method for the estimation of NOR in human plasma has been developedand validated according to the principles of Good Laboratory Practices. The plasma was validated over a concentration rangeof 0.1608 to 34.9782 ng/mL. Sample cleanup was accomplished bysolid-phase extraction using cartridges (Figure 1). The reconstitutedsamples were analyzed by LC-MS/MS using a Acquity column. The retention times of NOR and NOR-D6 werebetween 1.94 and 1.92 min, with a total run time of 5.5 min (Figure 2). The lower limit of quantitation was 0.1685 ng/mL for NOR. The linearity of the method was determined bya weighted least-squares regression analysis of an eight point standard curve. The calibration lines were shown to be linearfrom 0.1608 to 34.9782 ng/mL. Best-fit calibration lines of the ratioof NOR to IS peak area versus the concentration of calibrationstandards were determined by least-squares regression analysiswith weighting factors of 1/x2. The r2 values were consistently>0.99 during the course of validation (Figure 3).
Figure 2 Representative Chromatogram of an Aqueous Standard Solution for Norethindrone
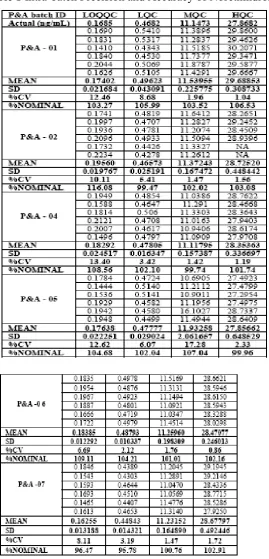
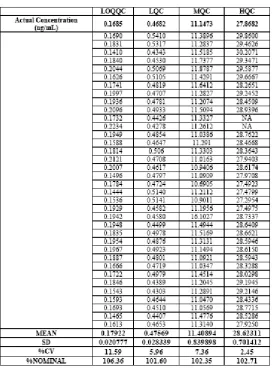
The imprecision of the assay was measured by the percentagecoefficient of variation over the concentration range of LLOQQC, LQC, MQC, and HQC samples during the course of validation.The accuracy of the assay was defined as the absolute valueof the ratio of the calculated mean values of the QC samplesto their respective nominal values, expressed as percentages (Table 1 and 2).Thepercentage matrix effect was 97.71% for analyte and 99.45% for IS.
Table 2 Inter-day or Total Precision and Accuracy of Norethindrone
Discussion
In this study, a reverse-phase HPLC method with mass spectrometricdetection using D7-NOR as an IS was developed. Various combinations of organic and aqueous phases were tried, and better chromatographywith lower baseline was achieved using 2mM ammonium formate buffer and acetonitrile (20:80, v/v) as the mobile phase. Response was observed in the range of 0.6 mL/minflow rate. Better sample cleanup and reproducibility were obtained using strata cartridges. The method described is sensitive, selective, precise, and accurate for the determination of NOR in human plasma at very low concentrations. The method has been validated for a maximum batch sizeof samples.
can contribute to the matrix effect. Hence, thismethod can be used to obtain accurate plasma NOR concentrations.
The method was successfully applied to estimate human plasma NORlevels after a single oral dose of Norethindrone(0.35 mg).
References
1. Watanabe H, Menzies JA, Jordan N, Loo JCK, HPLC-RIA of a metabolite of norethindrone in human plasma, 17α-ethinyl-5β-estrane-3α,17β-diol, following conjugate hydrolysis. Contraception 1983; 28:337-340.
2. Wenkui Li, Ying-He Li, Austin C. Li, Shaolian Zhou, Weng Naidong, Simultaneous determination of norethindrone and ethinyl estradiol in human plasma by high performance liquid chromatography with tandem mass spectrometry—experiences on developing a highly selective method using derivatization reagent for enhancing sensitivity. J Chrom B 2005; 825:223-23. 3. Thomas J, Goehl, Gloria M, Sundaresan, Vadlamani K, Prasad, Studies of the
dissolution characteristics of norethindrone-mestranol tablets. Int J Pharmace 1983;15:115-123.
4. Silvia Latsch, Torsten Selzer, Lothar Fink, Jörg Kreuter, Determination of the physical state of norethindrone acetate containing transdermal drug delivery systems by isothermal microcalorimetry, X-ray diffraction, and optical microscopy. Euro J Pharmac Biophar 2004;57:383-395.
5. Thomas J, Goehl, Gloria M, Sundaresan, Vadlamani K, Prasad, Analytical methodology applicable in dissolution testing of norethindrone-mestranol tablets, Int J Pharmac 1982; 11:181-186.
6. Saperstein S, Edgren RA, Ellis GJL DJ, Lee Kushinsky S, Olmsted A, Mroszczak E, Bioequivalence of norethindrone and ethinyl estradiol for two different weight tablets with the same hormonal content.Contraception 1986; 33:547-557.
7. Saperstein S, Edgren RA, Lee GJL Jung D, Fratis A, Kushinsky S, Mroszczak E, Dorr A, Bioequivalence of two oral contraceptive drugs containing norethindrone and ethinyl estradiol Original Research Article