www.orientjchem.org
An International Open Free Access, Peer Reviewed Research Journal
2017, Vol. 33, No. (3): Pg.1575-1580
A Selective and Sensitive Method Development and Validation
by LC-MS/MS Approach for Trace Level Quantification of
Potential Genotoxic Impurities of ERL Ethyl Ester and ERL
Nitro Compound in Erlotinib Hydrochloride Drug Substance
NELATURI SUBBAIAH
1*and GOPIREDDY VENKATA SUBBA REDDY
21Department of chemistry, S.R.N.B. Degree and P.G. College, Badvel, Kadapa,
Andhra Pradesh, 516 227, India.
2Department of Chemistry, Jawaharlal Nehru Technological University Anantapur
College of Engineering, Pulivendula, Kadapa, Andhra Pradesh, 516 390, India. *Corresponding author E-mail: [email protected]
http://dx.doi.org/10.13005/ojc/330364
(Received: March 16, 2017; Accepted: April 05, 2017)
ABSTRACT
A novel reversed-phase liquid chromatography coupled with tandem mass spectrometric (LC-MS/MS) method was developed and validated for the trace analysis of ethyl 2-amino-4,5-bis(2-methoxyethoxy)benzoate (ERL ethyl ester) and ethyl 4,5-bis(2-methoxyethoxy)-2-nitrobenzoate (ERL nitro compound) genotoxic impurities in Erlotinib Hydrochloride drug substance with the shorter run time. ERL ethyl ester and ERL nitro compound were identified as genotoxic impurities through DEREK nexus software. The method utilizes purosphere star RP 18 e (100 mm X 4.6 mm, 3.0 µm) column with electro spray ionization in multiple reaction monitoring (MRM) detection mode. The isocratic mode of elution for the impurities was carried out with the aid of the mobile phase using 0.1% formic acid in water & acetonitrile in the ratio of 42:58 v/v. The flow rate was 1.0 mL/min, column oven temperature 25ºC and elution was monitored by mass spectrometer. The method was validated as per International Conference on Harmonization (ICH) guidelines and quantitate up to 1 ppm of ERL ethyl ester and ERL nitro compound.
Key Words: Erlotinib Hydrochloride, LC-MS/MS, Genotoxic impurities, multiple
reaction monitoring (MRM), Derek nexus.
INTRODUCTION
During the synthesis of active pharmaceutical ingredients (APIs) the final products may end up with some impurities probably from starting materials,
genotoxic impurities (PGIs)1-3. Keeping in view of its significance, European Medicines Agency and ICH [ICH M7] have framed guidelines genotoxic impurities in the drug substance4, 5. These guidelines proposed a threshold limit of toxicological concern value (1.5 µg/day) of genotoxic impurities in the drug substance.
It was identified that Ethyl 2-amino-4,5-bis(2-methoxyethoxy)benzoate (ERL ethyl ester) and Ethyl 4,5-bis(2-methoxyethoxy)-2-nitrobenzoate (ERL nitro compound) were potential genotoxic impurities using DEREK nexus software6. LHASA predictions derived out of DEREK nexus report clearly indicates that ERL nitro compound is a very plausible entity that shows carcinogenicity in mammal & mutagenicity in vitro in bacterium is plausible and ERL amino compound is a carcinogenicity & skin sensitisation in mummal plausible. Though ERL nitro compound and ERL ethyl ester are known potential carcinogen, these data would ascertain that the regulatory authorities expected to control the levels of ERL ethyl ester and ERL nitro compound to be 10 ppm in the drug substance.
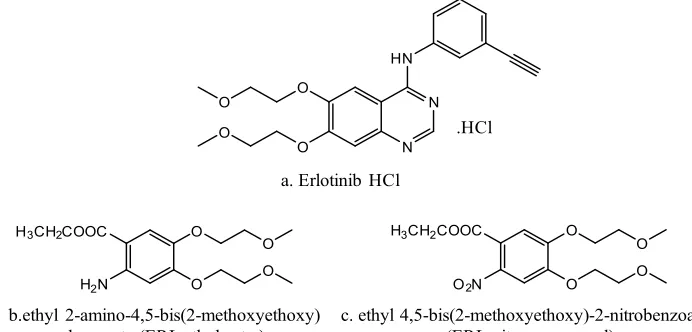
Erlotinib hydrochloride (Fig. 1a) is used for the treatment of non-small cell lung malignancy, pancreatic cancer and other types of cancer 7. The chemical name of erlotinib is N-(3-ethynylphenyl)-6,7-bis(2-methoxyethoxy) quinazolin-4-amine. Its molecular formula is C22H23N3O4.HCl, which corresponds to a molecular weight of 429.9 (hydrochloric acid salt). Our in-house active pharmaceutical ingredient Erlotinib Hydrochloride
was white to pale yellow powder & slightly soluble in methanol. ERL ethyl ester (Fig. 1b) and ERL nitro compound (Fig. 1c) are the two intermediates in the Erlotinib Hydrochloride process. It is essential to control and prove that these impurities is not getting carry forward till final stage as it has structural alert. It was a great challenge for developing a method for determinations of genotoxic impurities at low level using analytical techniques like LCMS, HPLC, GC, and UV. The literature survey related that some spectrophotometric methods, HPLC methods, and LC-MS/MS were developed for the determination of erlotinib in different combination of drugs and biological matrices8-11. No literature was available for the determination of ERL ethyl ester and ERL nitro compound at trace level in Erlotinib Hydrochloride.
The main objective of present research article is to develop a selective, sensitive, rapid and accurate method to achieve efficient separation between erlotinib, ERL ethyl ester & ERL nitro compound using LC-MS/MS technique and method to be validated as per ICH guidelines12 in terms of specificity, limit of detection (LOD), limit of quantification (LOQ), precision, linearity, accuracy and robustness.
MATERIALS AND METHODS
Chemicals and reagents
Formic acid, methanol and acetonitrile were obtained in their LCMS grade from M/S Merck (Mumbai, India). Purified water collected through Mill-Q plus water purification system (Millipore,
Fig. 1: The Chemical structure of ErlotinibHydrochloride, ERL ethyl ester and ERL nitro compound
O O
O O
N N HN
.HCl
a. Erlotinib HCl
H3CH2COOC
O2N
O
O
O O
c. ethyl 4,5-bis(2-methoxyethoxy)-2-nitrobenzoate (ERL nitro compound)
H3CH2COOC
H2N
O
O
O O
Milford, MA, USA). Erlotinib Hydrochloride, ethyl 2-amino-4,5-bis (2-methoxyethoxy) benzoate (ERL ethyl ester) and Ethyl 4,5-bis(2-methoxyethoxy)-2-nitrobenzoate (ERL nitro compound) were synthesis from our in-house M/S Cipla Ltd (R&D), Bangalore, India.
Instrumentation
The mass spectrometer system was used an Applied Bio system Sciex QTRAP-5500 model (Switzerland). LC was carried out on Agilent HPLC (1200 series, Germany) with photodiode array detector. As part of experimentation, additional equipment such as PCI sonicator (22L500/CC/DTC), and precision analytical balance (MX5, Mettler Toledo, Schwerzenbach, Switzerland). Data acquisition and processing were steered using the Analyst 1.6.2 software on a dell computer.
Chromatographic conditions
The analytical column used was purosphere star RP 18 e (100 mm X 4.6 mm, 3.0 µm) procured from M/S Merck life sciences (Mumbai, India). The mobile phase was 0.1% formic acid in water and acetonitrile in the ratio of 42:58 (v/v). The flow rate was 1.0 mL/min with the flow rate split down to 0.4 ml/min into the MS source. The column oven temperature was maintained at 25 0C and sample cooler temperature was 15 0C. The injection volume was 10 µl. Positive ion electrospray ionization probe & multiple reaction monitoring (MRM) detection mode were used for LC-MS/MS method for quantification of ERL ethyl ester and ERL nitro compound content in erlotinib Hydrochloride drug substance. Mass spectrometer conditions was represented in Table 1.
Sample and standard preparation
The test concentration of Erlotinib Hydrochloride was 1 mg/mL based on the detector response. The diluent was optimized as methanol and water in the ratio of 50:50 (v/v). The standard solution of ERL ethyl ester and ERL nitro compound were prepared with a concentration of 1.0 ppm (LOQ level), 5.0 ppm, 7.5 ppm, 10.0 ppm (Limit Level), 12.5 ppm and 15.0 ppm with respect to the test concentration. Test sample spiked with standard at LOQ, 50%, 100% and 150% level were prepared by dissolving 10 mg of test sample with standard solution in a 10 mL volumetric flask.
RESULTS AND DISCUSSION
Method development
The initial trials were carried out with HPLC using different buffers (Phosphate, TFA, Ammonium acetate etc.). During the trials it was observed that there was a lag in attaining the sensitive of the method to reach the targeted level and hence finally the method development trials were carried out using the LC-MS/MS technique for better sensitivity. The final chromatographic condition was achieved on a purosphere star RP 18 e (100 mm X 4.6 mm, 3.0 µm) procured from M/S Merck life sciences (Mumbai, India) in isocratic mode of elution using the mobile phase 0.1% formic acid in water and acetonitrile in the ratio of 42:58 (v/v)). The flow rate was 1.0 mL/ min, with flow rate split down to 0.4 mL/min into the MS source, MS parameters were set to get maximum sensitivity for the impurities of ERL ethyl ester and ERL nitro compound. Before obtaining the final method, the method was scrutinized with different stationary phase columns which includes C18, C8,
Table1: Mass spectrometer conditions
Parameter Erlotinib ERL ethyl ester ERL nitro compound
MRM monitoring for m/z transition 394.2 > 278.2 361.1 > 298.1 314.2 > 268.2
DP (V) 60 50 55
EP (V) 12 10 15
CE (V) 21 17 18
CXP (V) 18 13 23
Ion spray voltage (V) 5500 5500 5500
Source temperature (ºC) 450 450 450
Curtain gas flow (psi) 40 40 40
GS1 50 50 50
cyano and amino. In addition to that the trails were carried out with different mobile phase additives such as formic acid, ammonium acetate, methanol and acetonitrile.
Method Validation
The specificity of the method was checked by injecting 1.0 ppm of Erlotinib Hydrochloride, ERL ethyl ester and ERL nitro compound with respect to the test concentration by using mass spectral detection. The retention time of the API and genotoxic impurities were mentioned in Table 2.
Limit of detection (LOD) and limit of quantification (LOQ) were calculated from S/N (signal to noise) ratio. The LOD and LOQ for ERL ethyl ester and ERL nitro compound were obtained with the concentration of 0.3 ppm and 1.0 ppm to obtain the S/N ratio 3.2, 3.9 and 10.9, 10.6 respectively.
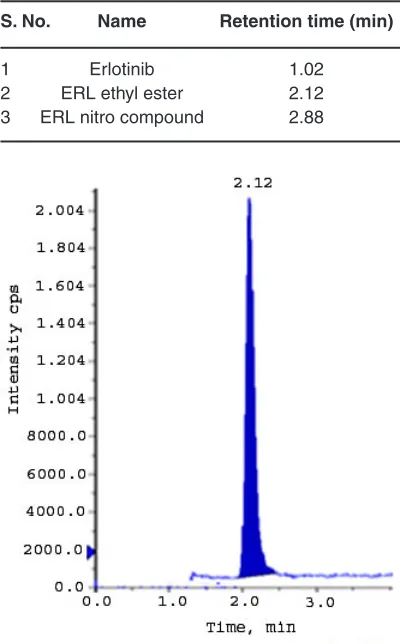
The linearity of the developed method was verified over a concentration of 1.0-15.0 ppm (LOQ, 50%, 75%, 100%, 125% and 150%). Calibration curve was plotted for the peak areas (Y-axis) of ERL ethyl ester and ERL nitro compound versus concentration of ppm (X-axis). The correlation coefficient, slope and intercept values were derived from linear least-square regression analysis and data are presented in Table 3. System precision was studied by injecting six times of ERL ethyl ester and ERL nitro compound standard solution at limit level. To determine the method precision six independent solutions were prepared by spiking erlotinib Hydrochloride with the impurity at a concentration of 10.0 ppm with respect to analyte concentration. Intermediate precision was studied with different column, different instrument and different day. % RSD of all the above determinations were calculated and found below 10. The recovery studies by the standard addition method were performed to evaluate accuracy. Accordingly the accuracy of the method was determined in six replicate at limit level, LOQ, 50% and 150% in triplicate. The recovery obtained for both the genotoxic impurities was within 90% to 110%. Spiked limit level chromatograms of accuracy was shown in fig. 2-3. Robustness of the method was determined by making slight and deliberate changes in experimental conditions. The flow rate of
Fig. 2: Accuracy at LOQ level for ERL ethyl
ester Fig. 3: Accuracy at LOQ level for ERL nitro compound Table 2: Determination of specificity
S. No. Name Retention time (min)
1 Erlotinib 1.02
2 ERL ethyl ester 2.12
Table-3: Summary of Analytical method validation results
Parameter Results
ERL ethyl ester ERL Nitro compound
LOD (ppm) 0.3 0.3
LOQ (ppm) 1.0 1.0
Linearity range (ppm) 1-15 1-15
Correlation coefficient 0.9996 0.9999
Slope 63151 43972
Intercept 1653 -2110
System precision (%RSD) 0.98 0.47
Method precision (%RSD) 0.89 0.78
Intermediate precision (%RSD) 1.91 2.71
% Recovery at LOQ (1 ppm) 93.1-104.1 94.1-107.4
% Recovery at 50% (5 ppm) 97.7-104.5 97.2-103.7
% Recovery at 100% (10 ppm) 97.1-104.9 96.3-101.9
% Recovery at 150% (15 ppm) 96.4-101.1 98.4-104.1
mobile phase was altered by 0.1 units i.e. 1.0 to 1.1 mL/min, 1 to 0.9 mL/min and effect of temperature on resolution was also studied at 23ºC and 27ºC (altered by 2 units). The cumulative % RSD values from method precision and robustness study (altered conditions) were calculated. The % RSD values calculated were found to be below 10 for ERL ethyl ester and ERL nitro compound demonstrate that the method was robust. The solution stability was carried out for ERL ethyl ester and ERL nitro compound were quantitatively spiked at limit level concentration and stored at 15 0C. The spiked sample was injected into system initially and at various intervals. The % variation of ERL ethyl ester and ERL nitro compound content in the initial and each interval was calculated and found to be below 10. This indicates that the sample solution was found to be stable up to 48 hours at 15 0C.Validation results were summarized and represented in Table 3.
The stability of Erlotinib Hydrochloride was checked by forced degradation studies and confirmed that the potential genotoxic impurities were not formed during these studies. The Erlotinib Hydrochloride was subjected to photolysis, hydrolysis, acid hydrolysis, base hydrolysis, oxidation and reduction. The Erlotinib Hydrochloride was not
sensitive for the genotoxic impurities under the stress conditions.
CONCLUSION
The results of the present study indicated that the newly developed LC-MS/MS method with the shorter run time is simple, rapid, cost-effective, linear, accurate, precise, sensitive, robust over the specified range and selective for low level quantification of ERL ethyl ester and ERL nitro compound in Erlotinib Hydrochloride drug substance. The LOD and LOQ of the developed method were quite satisfactory. In addition to this, the method is more convenient and more reliable. The quantification of ERL ethyl ester and ERL nitro compound has been successfully used for the release in quality control, routine and stability studies.
ACKNOWLEDGEMENTS
REFERENCES
1. Bolt, H.M.; Foth, H.; Hengstler, J.G.; Degan, G.H. Toxicology Letters, 2004, 151, 29-41.
2. Muller, L.; Mauthe, R.J.; Riley, C.M.; Andino, M.M.; De Antonis, D.; Beels, C.; DeGeorge, J.; De Knaep, A.G.M.; Ellison, D.; Fagerland, J.A.; Frank, R.; Fritschel, B.; Galloway, S.; Harpur, E.; Humfrey, C.D.N.; Jacks, A.S.; Jagota, N.; Mackinnon, J.; Mohan, G.; Ness, D.K.; O’ Donovan, M.R.; Smith, M.D.; Vudathala, G.; Yotti, L. Reg. Toxicol. Pharmacology, 2006,
44, 198-211.
3. Jacobson-Kram, D.; McGovern, T. Adv. Drug
deliv. Reviews, 2007, 59, 38-42.
4. Guideline on the limits of genotoxic impurities, EMA guidance MEA/CHMP/
QWP/251344/2006and EMA/CHMP/
SWP/431994/2007 Rev.3, 23 September 2010.
5. Guideline for Assessment and Control of DNA Reactive (Mutagenic) Impurities in pharmaceuticals to Limit Potential Carcinogenic risk, M7 ICH, 2014.
6. Deductive Estimation of Risk from Existing
Knowledge (DEREK) nexus, marketed by LHASA Ltd, Leeds, Yorkshire, U.K,DEREK nexus program Version Derek Nexus: 3.0.1, Nexus: 1.5.1.
7. Cohen, M.H.; Johnson, J.R.; Chen, Y.F.; Sridhar, R.; Pazdur, R. Oncologist, 2005, 10
(7), 461-466.
8. Padmalatha, M.; Kulsum, S.; Rahul, C.; Thimma Reddy, D.; Vidyasagar, G. International journal
pharmaceutical Research and Develop.,
2011, 3 (6), 53-59.
9. Geetha, G.S.S.; Raveendra Reddy, J.; Ramalingam, P.; Malleswari, P. American
Journal of pharmacy Technology and Resear.,
2012,2, 842-852.
10. Chakravarthy, V.K.; Sankar, D.G. Rasayan
Journal of Chemis.,2011, 4, 393-399.
11. Chahbouni, A.; Den Burger, J.C.; Vos, R.M.; Sinjewel, A.; Wilhelm, J. Therapeutic Drug
Monitori., 2009, 31, 683-687.