The Improvement Project
Of Science Construction PLC
Mert Erer, Marmara University, Turkey
ABSTRACT
This case is designed to be an introduction to preparing improvement projects for insolvent companies. After reading this text and answering the questions for discussion, the students understand 1) the major aspects that should be highlighted in an improvement project, 2) the links between the reasons for bankruptcy and countermeasures, and 3) the links between the planned measures and their representation in financial statements.
Keywords: Insolvency; Improvement Project; Bankruptcy Code
INTRODUCTION
he Turkish Execution and Bankruptcy Code allows insolvent companies to apply to the commercial court and propose a project for restructuring its debts and strengthening its financial status. If the project is found to be serious and feasible by the court expert, the bankruptcy will be postponed for one year.
This postponement is very important for insolvent companies, since the postponement of the decision prevents the initiation of execution proceedings or suspends the pending execution proceedings until the end of the postponement. Consequently, the plan plays a vital role for insolvent companies by allowing them to continue their operations and emerge from bankruptcy.
THE CASE
Science Construction PLC offers design, project development, equipment provision, project financing and contracting services for highways, roads, tunnels and viaducts. The most important customers of the company are Istanbul, Ankara, Ismir, Bursa, and Kocaeli Metropolitan Authorities and the General Directorate of Highways. The company sells asphalt to these customers and paves the roads under their authority.
The asphalt production capacity of the company is 520,000 tonnes per year. The headquarters is located in Istanbul. There are five active construction sites in three different cities. The company owns a license for removing equipment domestically that is valid until June 2014 as well as ISO 9001:2009 for its quality management system and OHSAS 18001:2008 for occupational health and safety management standards.
REASONS FOR BANKRUPTCY
Effects Of The Global Financial Crisis
The main reason for the bankruptcy is the ongoing financial crisis that began in 2008. Throughout the financial crisis, local demand shrank drastically, the possibility of finding financial resources became limited, and the cost of credit and credit guarantees rose. As a result, the company had difficulties preserving its profitability and maintaining the cash balance.
Public investments and the budget of metropolitan authorities were also decreased due to inadequate resources. As a company whose client base was primarily in the public sector, the effects of the crisis were significant.
Problems in Collecting Receivables
The company experienced problems collecting its receivables from the metropolitan authorities in a timely fashion. The receivables could only be collected between seven to nine months after billing. This delay resulted in the necessity of finding additional financial resources to settle short-term debts. Additional financial resources were created either by selling the receivables to factoring companies, by discounting progress bills, or by taking bank credits. The financing cost of selling receivables was 15%, it was 13% for discounting progress bills and between 11 to 16% for bank credits.
If payment terms are delayed when buying materials and equipment, in order to delay cash outflows, the prices rise. Consequently, the profitability is diminished and the long-term cash flow is damaged .
Differences in The Development Of Costs And Contract Prices
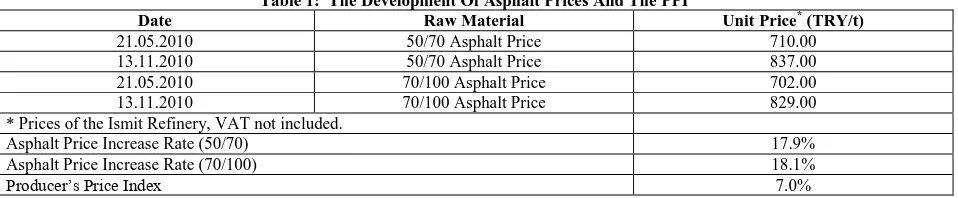
Selling asphalt to metropolitan authorities constitutes the largest proportion of revenues. The tenders are issued in February and March and production takes place between May and November. The price difference between the date of securing the contract and the delivery date is reflected in the progress payments at the level of the producer’s price index (PPI) according to the Public Procurement Law. In 2010, in particular, the PPI remained substantially below the increase in asphalt prices. The development of asphalt prices and the PPI are shown in Table 1. The raw material prices for the company rose by 18% between May and November 2010, but the PPI announced by the Statistical Institute was 7% for the same period. The production costs rose, but the company could not secure a price increase to match the difference.
Table 1: The Development Of Asphalt Prices And The PPI
Date Raw Material Unit Price* (TRY/t)
21.05.2010 50/70 Asphalt Price 710.00
13.11.2010 50/70 Asphalt Price 837.00
21.05.2010 70/100 Asphalt Price 702.00
13.11.2010 70/100 Asphalt Price 829.00
* Prices of the Ismit Refinery, VAT not included.
Asphalt Price Increase Rate (50/70) 17.9%
Asphalt Price Increase Rate (70/100) 18.1%
Producer’s Price Index 7.0%
STRENGTHS AND WEAKNESSES OF THE COMPANY
The strengths of the company can be summarised as:
•
Over 20 years of experience in the sector•
Trust in the brand Science Construction because of successfully completed major contracts•
Good relationships with the Istanbul and Ankara Metropolitan Authorities and administration of the General Directorate of Highways•
Business Experience Certificate given by the Authorities which enables the company to participate in tenders up to 95,000,000.00 TRY•
Licence for removing equipment domestically so that transportation of materials and equipment can be handled by the company•
One of the best equipment pools in Turkey and qualified staff to use the equipmentThe weaknesses of the company are:
•
Problems in collecting receivables•
Short-term debt burden with high financing costsFINANCIAL ANALYSIS
The current ratios are 0.95, 0.90 and 0.82 for the years 2008, 2009 and 2010, respectively. The current ratio is under the industry average of 1.20 and has been decreasing for three consecutive periods. The working capital of the company has also been negative in the last three periods. Thus, the company does not have sufficient current assets to cover its short-term debt. This gap has been financed by assuming more short-term debt. The leverage of the company was 5.65 in 2010. Since the leverage is high, the risk premium of the company is also high, which leads to higher interest rates for bank credits.
High short-term debt accumulated over the years and high interest rates put substantial pressure on the company limiting its ability to make decisions. The company plans to substitute the short-term debt with equity in order to correct this unhealthy financial condition.
Although the revenues are increasing, operating profit and net income have deteriorated over the last three periods. The primary reason is that the increase in cost of services sold was more than the increase in revenues. The cost of services sold increases since the price of raw materials rises. Permanent measures will be taken in order to minimize costs and keep the company running.
MEASURES TO BE TAKEN
Payments From The Shareholders
Capital Increase
The issued capital will be increased by 2,000,000.00 TRY by March 2011 and 500,000.00 TRY will be paid in the same month. The remaining 1,500,000.00 TRY will be paid in three equal terms in 2011 and 2012. The payment dates are shown in the Cash Flow Statement.
Collecting Receivables from the Shareholders
Shareholder F. K. will pay his total debt of 1,876,564.72 TRY in three equal terms in February, August and December 2011. Shareholder, Hisal Moving PLC, will pay 300,000.00 TRY in 2011 and 350,000.00 TRY in 2012.
Cost Cutting
Cuts in Production Costs
Raw Materials
Purchase price for crushed stone is 14 TRY. The purchase price consists of the price of the crushed stone (6.50 TRY) and transport costs (7.50 TRY). Starting in 2011, the company will handle the transportation with its own vehicles and cut transport costs by 3.00 TRY. The cost of raw materials is given in Table 2.
Table 2: Cost Cutting for Raw Materials per Unit Raw
Material
Amount per Unit
Current Purchase Price per Unit (TRY)
Current Amount (TRY)
Planned Purchase Price per Unit (TRY)
Planned Amount (TRY) Crushed
Stone 1.0000 14.00 14.00 11.00 11.00
Bitumen
50/70 0.0447 843.00 37.68 843.00 37.68
Fuel oil 5.5000 1.44 7.92 1.44 7.92
Gas oil 1.0000 2.62 2.62 2.62 2.62
Direct Labour
* There were 102 employees at the beginning of 2010. Some unqualified personnel were dismissed and the number of staff was reduced to 86 as of January 2011. In the coming periods, the work force will be organised according to the number and value of contracts the company secures.
* The employees that do not work due to underproduction will be given unpaid leave of absence for the period. Thus, the salaries and the subsidiary costs (e.g. meals, services) will decrease.
Production Overheads
* Weekly budgets will be prepared in order to control the consumption of indirect materials. No consumption above the caps set by the budget will be authorised.
General Overheads
* The number of vehicles used by the management will be decreased in order to reduce the maintenance, insurance, and fuel costs.
* The purchase of consumables will be centralised and credit cards given to the management will be collected so that an efficient cost control can be achieved.
* The night lighting of the headquarters and the construction sites will be removed. A saving in energy costs of up to 50% can be realised by replacing the costly lighting with halogen lamps, as can be seen in Table 3.
Table 3: Energy Cost Savings
Plant Energy Costs before 2011 (monthly, actual, TRY)
Energy Costs after 2011 (monthly, planned TRY)
Anticipated Energy Cost Savings (monthly)
HQ 667.88 320.58 347.30
Construction Site_1 2,671.53 1,442.63 1,228.90
Construction Site_2 2,385.30 1,168.79 1,216.50
Construction Site_3 1,908.24 961.76 946.48
Construction Site_4 858.71 446.53 412.18
Construction Site_5 1,049.53 503.77 545.77
Total 9,541.19 4,844.06 4,697.13
Revenues
* Infrastructure investments are gathering speed since the municipal elections are near. Ankara Metropolitan Authority contracted 950,000 tonnes of asphalt in 2011. The company has 25% market share in the Ankara district. Hence, it can be assumed that at least 230,000 tonnes will be obtained by the company in the following period. With contracts from other authorities, the company expects a sales volume of 265,000 tonnes.
* The company expects the market volume of the private sector to shrink by 5%, thus the sales volume of 20,000 tonnes in 2010 will be reduced to 19,000 tonnes.
PROFORMA FINANCIAL STATEMENTS
Proforma Income Statement
Table 4: Proforma Income Statement
01.01.-31.03. 01.01.-30.06. 01.01.-30.09. 01.01.-31.12. 2012 Revenues 1 5,488,000.00 18,210,500.00 31,499,500.00 37,705,900.00 39,591,195.00 (Cost of Services Sold) 2 (4,737,270.44) (15,166,742.12) (24,206,782.97) (30,566,013.24) (32,705,634.17) Gross Profit 750,729.56 3,043,757.88 7,292,717.03 7,139,886.76 6,885,560.83 (General Administrative
Expenses) 3 (62,742.53) (218,236.13) (370,616.85) (523,197.58) (559,821.41) Profit from On-going
Operations 687,987.03 2,825,521.75 6,922,100.18 6,616,689.18 6,325,739.42 (Financing Costs) 4 (389,938.74) (679,877.48) (910,198.35) (1,090,519.23) (1,199,571.15) (Financial Leasing Costs) 5 (358,944.98) (691,035.84) (1,023,126.69) (1,355,217.54) (1,490,739.29) Profit (60,896.69) 1,454,608.43 4,988,775.14 4,170,952.41 3,635,428.98
1. Revenues from new contracts and the relevant costs are shown in Table 5. Most of the sales will be made to the public sector. The costs are based on the calculations in “Raw Materials”.
Table 5: Revenues From New Contracts
01.01.-31.03. 01.01.-30.06. 01.01.-30.09. 01.01.-31.12. Revenues 2011
(from new contracts) 0.00 8,145,900.00 18,274,400.00 24,480,800.00
Amount (t) 0.00 9,500.00 19,000.00 19,000.00
Revenues - Private Sector (TRY) 0.00 818,900.00 1,637,800.00 1,637,800.00
Amount (t) 0.00 85,000.00 193,000.00 265,000.00
Revenues – Public Sector (TRY) 0.00 7,327,000.00 16,636,600.00 22,843,000.00 Costs 2011
(from new contracts) 0.00 5,596,668.00 12,555,488.00 16,819,616.00
Amount (t) 0.00 9,500.00 19,000.00 19,000.00
Costs - Private Sector (TRY) 0.00 562,628.00 1,125,256.00 1,125,256.00
Amount (t) 0.00 85,000.00 193,000.00 265,000.00
Costs – Public Sector (TRY) 0.00 5,034,040.00 11,430,232.00 15,694,360.00
Profit (TRY) 0.00 2,549,232.00 5,718,912.00 7,661,184.00
2. Cost of services sold consists of raw materials, direct labour, construction site expenses and cost of vehicles and equipment used in the production. The latter two comprise the overhead costs. Cost of services sold is shown in Table 6.
Table 6: Cost of Services Sold
01.01.-31.03. 01.01.-30.06. 01.01.-30.09. 01.01.-31.12. Raw Materials 0.00 5,596,668.00 12,555,488.00 16,819,616.00 Direct Labour 3,413,771.40 7,082,285.80 8,081,351.80 9,080,417.80 Overheads 1,323,499.04 2,487,788.32 3,569,943.17 4,665,979.44 Total 4,737,270.44 15,166,742.12 24,206,782.97 30,566,013.24
3. General administrative expenses consist of office expenses and the cost of vehicles used by management. Water, energy, telephone, gas, internet connection, heating, cable television, cleaning and representation expenses make up the office expenses. General administrative expenses are shown in Table 7.
Table 7: General Administrative Expenses
01.01.-31.03. 01.01.-30.06. 01.01.-30.09. 01.01.-31.12. Office Expenses 54,942.53 202,636.13 348,116.85 493,597.58
Other 7,800.00 15,600.00 22,500.00 29,600.00
Total 62,742.53 218,236.13 370,616.85 523,197.58
Table 8: Financing Costs
01.01.-31.03. 01.01.-30.06. 01.01.-30.09. 01.01.-31.12. Equipment Nr. 64973 56,301.38 112,602.74 168,904.12 225,205.51 Caterpillar Nr. 298573 18,547.37 37,094.73 46,024.23 54,953.73
Total (Credits for Equipment) 74,848.75 149,697.47 214,928.35 280,159.24
Interest payments 313,500.00 527,000.00 690,500.00 804,000.00
Transaction costs 810.00 1,620.00 2,430.00 3,240.00
Commission Fee 780.00 1,560.00 2,340.00 3,120.00
Total (Other Credits) 315,090.00 530,180.00 695,270.00 810,360.00
Total 389,938.75 679,877.47 910,198.35 1,090,519.24
5. Interest costs for financial leases are shown in Table 9.
Table 9: Financial Leasing Costs
01.01.-31.03. 01.01.-30.06. 01.01.-30.09. 01.01.-31.12.
Equipment_9675 84,514.60 169,029.19 253,543.79 338,058.38
Equipment_84963 93,590.28 187,180.56 280,770.83 374,361.11
Equipment_2367 93,448.85 160,043.57 226,638.29 293,233.01
Equipment_16789 87,391.26 174,782.52 262,173.78 349,565.04
Total 358,944.99 691,035.84 1,023,126.69 1,355,217.54
Proforma Cash Flow Statement
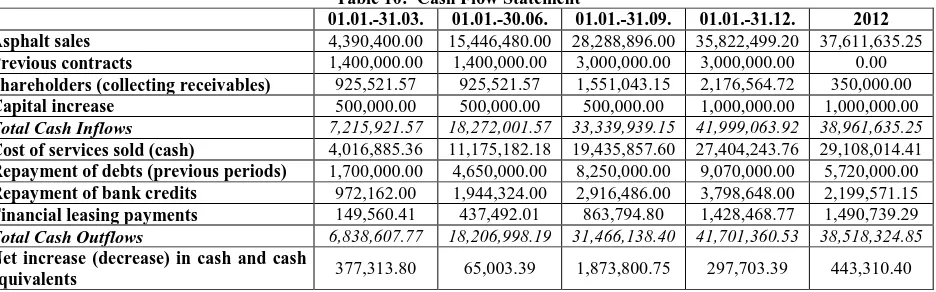
The proforma cash flow statement is shown in Table 10. Cash inflows from previous contracts result from the completed operations in Kocaeli and Ismir. The claims will be collected in March and August. The payments for crushed stone, fuel oil and gas oil are made three months after delivery, whereas the payment for bitumen 50/70 is made in the month of the delivery.
Table 10: Cash Flow Statement
01.01.-31.03. 01.01.-30.06. 01.01.-31.09. 01.01.-31.12. 2012 Asphalt sales 4,390,400.00 15,446,480.00 28,288,896.00 35,822,499.20 37,611,635.25 Previous contracts 1,400,000.00 1,400,000.00 3,000,000.00 3,000,000.00 0.00 Shareholders (collecting receivables) 925,521.57 925,521.57 1,551,043.15 2,176,564.72 350,000.00 Capital increase 500,000.00 500,000.00 500,000.00 1,000,000.00 1,000,000.00
Total Cash Inflows 7,215,921.57 18,272,001.57 33,339,939.15 41,999,063.92 38,961,635.25
Cost of services sold (cash) 4,016,885.36 11,175,182.18 19,435,857.60 27,404,243.76 29,108,014.41 Repayment of debts (previous periods) 1,700,000.00 4,650,000.00 8,250,000.00 9,070,000.00 5,720,000.00 Repayment of bank credits 972,162.00 1,944,324.00 2,916,486.00 3,798,648.00 2,199,571.15 Financial leasing payments 149,560.41 437,492.01 863,794.80 1,428,468.77 1,490,739.29
Total Cash Outflows 6,838,607.77 18,206,998.19 31,466,138.40 41,701,360.53 38,518,324.85
Net increase (decrease) in cash and cash
equivalents 377,313.80 65,003.39 1,873,800.75 297,703.39 443,310.40
BUDGET CONTROL
The budget will be measured quarterly to ensure targets are met. The budget will be managed mainly by controlling the development of expenses since they are easier to affect by economy measures than revenues.
Tolerance rate for budget control is set at three percent. If a three percent positive or negative variance is identified in budgeted revenues or expenses, the reasons for the variance will be analysed thoroughly.
CONCLUSION
Case studies showing the preparation of improvement projects for insolvent companies are very scarce, so this case fills an important gap. This case was prepared for students to show that the improvement project should include reasons for insolvency, planned measures, and their timing. Furthermore, the financial effects of the measures to be taken should also be shown by preparing budgets and proforma financial statements in order to emphasise the seriousness and the feasibility of the project.
QUESTIONS FOR DISCUSSION
1. What could Science Construction PLC have done in order to avoid bankruptcy?
2. Assume that you are a debtor of Science Construction PLC and the company has given you this project. Is there any additional financial or non-financial information that you would like to receive? What would you like to see in an improvement project as a debtor?
3. What problems could Science Construction PLC face when they implement the measures explained in the project? What should management do to execute the project effectively?
4. The project has to be approved by the court in order to get a bankruptcy postponement. The court expert writes a report on the project if the plan is serious and feasible. Assume that you are the court expert for the improvement project of Science Construction PLC. What would you write in your report?
AUTHOR INFORMATION