SCITECH
Volume 10, Issue 4
RESEARCH ORGANISATION
April 3, 2018
Journal of Research in Business, Economics and Management
www.scitecresearch.com
Tolerance, Perceived Happiness and Economic Development:
Exploring Relationships on Easterlin Variables for Latin
America
Zengrui Tian, Guillermo Andres Buitrago
Donghua University Shanghai China.Abstract
In this study, we extend the study on perceived happiness by exploring the effect of tolerance on life satisfaction in a sample of 96 countries. Our results showed that tolerance was positively linked to life satisfaction. This result remained robust even after controlling a few potential determinants of subjective wellbeing. Even more, our results showed that Latin American countries are on average associated with higher levels of life satisfaction. Finally, we’ve found that economic development mediates the link between tolerance and life satisfaction.
Keywords:
Culture; Life satisfaction; Tolerance; Latin America.1.
Introduction
With the publication of a widely cited study by Easterlin (1974) showing that higher income in the US was not linked to higher wellbeing, a large strand of literature has emerged investigating the causes of life satisfaction across countries and time. For instance, Bjørnskov et al. (2008) attempted to identify determinants of life satisfaction using data from 73 countries covering 100.000 individuals. The study applied mean regression, robust regression and extreme bounds analysis techniques. Their findings determined that political and macroeconomic variables - such as trade openness and investment -, and cultural-related values - such as trust - are among robust predictors of life satisfaction. In a similar way, Carroll (2007) also investigated how macroeconomic conditions influence life satisfaction in Australia. Strikingly, the study reported that the effect of job loss on life satisfaction overcomes the effect of income and health.
On the other hand, Deaton (2008) ran estimated life satisfaction regressions by using the 2006 Gallup World poll with samples of people in each of 132 countries. Deaton and his team discovered some important findings: First, they found out that citizens in high-income countries are more satisfied than those in lower income countries, however, after controlling for the level of economic development, economic growth was detrimental to life satisfaction. In this line, a separate avenue of research could explore the cultural determinants of life satisfaction both across and within countries.
Diener and Diener (2009) investigated various cultural correlations of life satisfaction, with data from 13, 118 College students in 31 nations measuring self-esteem, life satisfaction, and satisfaction with specific domains such as friends, family, and finances). This study found that self-esteem was one of the important correlates of subjective wellbeing which is then moderated by individualism of the nation.
happiness over honor and meeting social obligations”. This implies that culture plays important role in predicting wellbeing across developed and developing nations.
Nikolaev and Salahodjaev (2016) proposed that intelligence - another dimension related to culture - may be linked to the distribution of wellbeing within society and across nations. Using, data from 81 countries and applying wide range of estimation techniques (such as OLS regressions with robust Huber), they reported that intelligence is a significant antecedent of happiness inequality even after controlling for economic development, geography and quality of institutions. This result holds even when the authors use a panel data for 50 US states from 1972 to 2012. Moreover, they report that economic development moderates the link between intelligence and life satisfaction.
Several studies have investigated the importance of religiosity in predicting subjective wellbeing. Bergran and McConatha (2001) explored the links between religiosity, wellbeing and gender. These authors adopted two proxies of religiosity in their study, namely, religious denomination and religious participation. Their findings showed that religious denomination was more important in predicting life satisfaction relative to religious participation.
Park et al. (2011) tested the hypothesis that religiosity may be linked to life satisfaction among Korean immigrants in US. The authors, using structural equation modeling, documented that increase in religiosity was followed by a comparable increase in life satisfaction. The authors conclusion was synthetized in the following statement: “social services that facilitate religiosity and social support may be beneficial for Korean elders’ life satisfaction” (p. 641). On the other hand, Snoep (2008) explored country specific correlations between religiousness and subjective wellbeing for three countries the USA, the Netherlands and Denmark. The study finds that the highest correlation between life satisfaction and religion is documented in the USA. In contrast this correlation is insignificant for other two countries.
Considering that there is significant debate in the empirical literature on the role of culture in predicting life satisfaction across countries, we contribute to this debate by exploring the link between tolerance and life satisfaction on a sample of 96 countries. Using data from World Values Survey (WVS) we found out that tolerance is a significant antecedent of subjective wellbeing. Particularly, when tolerance increases by one standard deviation, life satisfaction increases by less than a half deviation. The estimate for tolerance is positive and significant at the o.1 percent level of significance. Overall tolerance explained approximately 10% of cross-national variations in life satisfaction. Moreover, we found also that the effect of tolerance on life satisfaction is moderated by economic development.
2.
Data and Methods
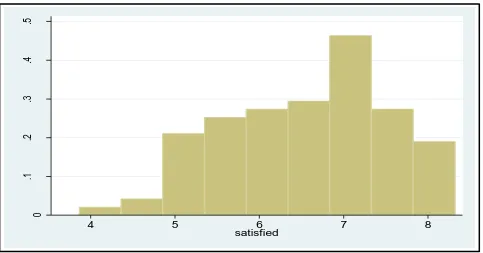
The dependent variable in this study is life satisfaction index from World Values Survey. This index was derived from the following question of the survey: All things considered, how satisfied are you with your life as a whole these days? Please use this card to help with your answer. 1 'Dissatisfied' 2. 3. 4. 5. 6. 7. 8. 9. 10 'Satisfied'. In our sample life satisfaction ranges from 3.87 in Tanzania to 8.31 in Colombo. The global average level of life satisfaction is 6.54 which is approximately is equal to the levels of Lebanon. The histogram of life satisfaction is presented in Figure 1.
Figure 1: Histogram of Life Satisfaction
0
.1
.2
.3
.4
.5
D
en
si
ty
4 5 6 7 8
The key independent variable in this study is average national level of tolerance. This variable is measured as a share of population that mentions Important child qualities: tolerance and respect for other people. The share of population that considers tolerance to be important ranges from 36% to 90% in Sweden.
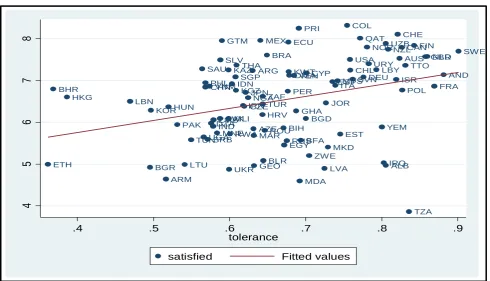
Figure 2 presents graphical link between tolerance and life satisfaction in our sample. The reported scatterplot suggested that overall tolerance is positively associated with subjective wellbeing. However, this link may be caused by other factors that are related to tolerance and life satisfaction.
Figure 2: Scatterplot of Tolerance and Life Satisfaction Index
Data: World Values Survey
We also controlled for a set of variables that associated also with life satisfaction in the empirical literature. First, we controlled for ethnic diversity index from Alesina et al. (2003). Related literature shows that ethnic diversity may be linked to economic growth (Alesina and Ferrara, 2005) and wellbeing (Okulics-Kozaryn, 2011). Next, we controlled for the democracy index from Freedom House to capture the effect of institutions on life satisfaction. Apart from ethnic diversity and democratization, then we controlled for the level of income to account for the Easterlin paradox in our empirical exercise. Finally, we added a binary variable for Latin American as this region has experienced significant economic and political transformations. The descriptive statistics for the variables used in our analysis are reported in Table 1.
Table 1: Summary Stats
Variable Description Mean Std. Dev. Min Max
Life satisfaction Life satisfaction index, 6.54 0.99 3.87 8.32
Tolerance Average national tolerance 0.67 0.12 0.36 0.90
Diversity Ethnic Diversity index 0.44 0.26 0 0.9302
Democracy Democracy index 4.66 1.98 1 7
Latin America =1 for Latin America 0.10 0.30 0 1
Income, log GDP per capita log 8.65 1.56 5.50 11.98
ALB DZA AND ARG ARM AUS AZE BHR BGD BLR BIH BRA BGR BFA CAN CHL CHN COL HRV CYP CZE DMA ECU EGY SLV EST ETH FIN FRA GEO DEU GHA GTM HKG HUN IND IDN IRN IRQ ISR ITA JPN JOR KAZ KOR KWT KGZ LVA LBN LBY LTU MKD MYS MLI MEX MDA MNE MAR NLD NZL NGA NOR PAK PER PHL POL PRI QAT ROU RUS RWA SAU SRB SGP SVK SVN ZAF ESP SWE CHE TZA THA TTO TUN TUR UGA UKR GBR USA URY UZB VEN VNM YEM ZMB ZWE
4
5
6
7
8
.4 .5 .6 .7 .8 .9
tolerance
The correlation matrix is presented in Table 2. In our sample, life satisfaction is positively correlated with tolerance, economic development, dummy variable for Latin American countries and democracy, while negatively correlated with ethnic diversity. The correlation between tolerance and life satisfaction presented in Figure 1 is 0.36.
Table 2: Correlation Matrix
I II III IV V VI
Life satisfaction 1
Tolerance 0.36 1
Diversity -0.07 -0.07 1
Democracy 0.25 0.42 0.26 1
Latin America 0.38 0.01 -0.03 0.13 1
Income, log 0.55 0.44 0.37 0.54 -0.02 1
To estimate the link between tolerance and life satisfaction we estimated the following regression model:
LSi = a + b*TOLERANCEi + Xc + ei (1)
where LS is life satisfaction in ith country, TOLERANCE is share of population that considers tolerance important, X is a set of control variables and e is an error term. We estimated this model using OLS regression method.
3.
Results
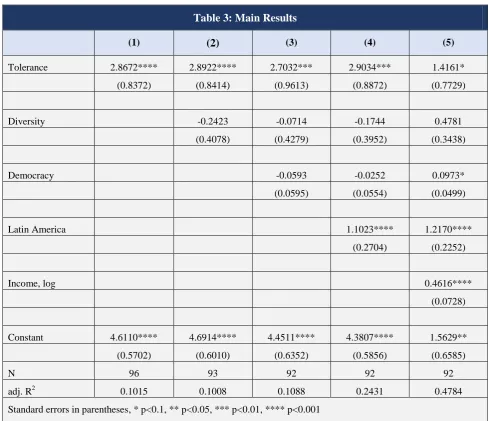
The main findings of this study are presented in Table 3. Column 1 offers coefficients from regression of life satisfaction on tolerance. As anticipated, we found that tolerance is positively linked to life satisfaction index. When tolerance increases by one standard deviation, life satisfaction increases by less than a half deviation. The estimate for tolerance is positive and significant at the o.1 percent level of significance. Overall tolerance explains approximately 10% of cross-national variations in life satisfaction. For example, we can validate the findings by comparing Latin America and China. The average level of tolerance in Latin America is 0.57 compared to 0.68 in China. In a similar way, the Latin American region reported on average higher life satisfaction 7.57 compared to 6.84 in China.
In column 2 we now bring over ethnic diversity index. We found that in our sample, ethnic diversity was negatively but insignificantly linked to subjective well-being. The results are consistent with Longhi (2014) who found that overall cultural diversity is not significantly correlated with life satisfaction. The estimate for tolerance is qualitatively and quantitatively unaffected.
In column 3 to capture the effect of political transformations on life satisfaction we included democracy index. For example, research showed that democratization has effect on economic development (Acemoglu et al., 2014), life expectancy (Franco et al., 2004) and environmental sustainability (Li & Reuveny, 2006). While democracy and ethnic diversity are insignificantly related to well-being, the effect of tolerance is positive and significant.
In column 4 we include a dummy variable for Latin America countries. First, we found that citizens in Latin America on average have life satisfaction index that is 1.1 points above other countries. Moreover, we found that the effect of tolerance on well-being is unaffected.
Finally, to captured the presence of Easterlin paradox in our sample, we included logged GDP per capita to our model. Moreover, GDP per capita may act as a catch all variable as it captures per capita income, level of economic development and macroeconomic environment. The coefficient for logged GDP per capita is positive and significant, indicating that economic development increases life satisfaction. Turning to the effect of tolerance, we found that it is now significant only at the 10% level and its value has decreased twice. This implies that economic development moderates the relationship between cultural values such as tolerance and life satisfaction.
Table 3: Main Results
(1)
(2)
(3) (4) (5)Tolerance 2.8672**** 2.8922**** 2.7032*** 2.9034*** 1.4161*
(0.8372) (0.8414) (0.9613) (0.8872) (0.7729)
Diversity -0.2423 -0.0714 -0.1744 0.4781
(0.4078) (0.4279) (0.3952) (0.3438)
Democracy -0.0593 -0.0252 0.0973*
(0.0595) (0.0554) (0.0499)
Latin America 1.1023**** 1.2170****
(0.2704) (0.2252)
Income, log 0.4616****
(0.0728)
Constant 4.6110**** 4.6914**** 4.4511**** 4.3807**** 1.5629**
(0.5702) (0.6010) (0.6352) (0.5856) (0.6585)
N 96 93 92 92 92
adj. R2 0.1015 0.1008 0.1088 0.2431 0.4784
Standard errors in parentheses, * p<0.1, ** p<0.05, *** p<0.01, **** p<0.001
4.
Conclusion
The aim of this study is to contribute to the ongoing debate on the determinant of life satisfaction. Earlier research shown that economic conditions, quality of institutions and culture are linked to life satisfaction. With respect to culture, extant studies suggest that individualism, religiosity, self-esteem and social trust are among the most explored factors.
In this study, we extend this research by exploring the effect of tolerance on life satisfaction in a sample of 96 countries. Our results showed that tolerance is positively linked to life satisfaction. This result remains robust even after controlling for a number of potential determinants of subjective wellbeing. Moreover, our results showed that Latin American countries are on average associated with higher levels of life satisfaction. Finally, we found that economic development mediates the link between tolerance and life satisfaction.
References
[1] Acemoglu, D., Naidu, S., Restrepo, P., & Robinson, J. A. (2014). Democracy does cause growth (No. w20004). National Bureau of Economic Research.
[2] Ahuvia, A. C. (2002). Individualism/collectivism and cultures of happiness: A theoretical conjecture on the relationship between consumption, culture and subjective well-being at the national level. Journal of Happiness Studies, 3(1), 23-36.
[3] Alesina, A., Devleeschauwer, A., Easterly, W., Kurlat, S., & Wacziarg, R. (2003). Fractionalization. Journal of Economic growth, 8(2), 155-194.
[5] Bergan, A., & McConatha, J. T. (2001). Religiosity and life satisfaction. Activities, Adaptation & Aging, 24(3), 23-34.
[6] Bjørnskov, C., Dreher, A., & Fischer, J. A. (2008). Cross-country determinants of life satisfaction: Exploring different determinants across groups in society. Social Choice and Welfare, 30(1), 119-173.
[7] Carroll, N. (2007). Unemployment and Psychological Well‐being. Economic Record, 83(262), 287-302.
[8] Deaton, A. (2008). Income, health, and well-being around the world: Evidence from the Gallup World Poll. Journal of Economic perspectives, 22(2), 53-72.
[9] Diener, E., & Diener, M. (2009). Cross-cultural correlates of life satisfaction and self-esteem. In Culture and well-being (pp. 71-91). Springer, Dordrecht.
[10] Easterlin, R. A. (1974). Does economic growth improve the human lot? Some empirical evidence. In Nations and households in economic growth (pp. 89-125).
[11] Franco, Á., Álvarez-Dardet, C., & Ruiz, M. T. (2004). Effect of democracy on health: ecological study. Bmj, 329(7480), 1421-1423.
[12] Nikolaev, B., & Salahodjaev, R. (2016). The role of intelligence in the distribution of national happiness. Intelligence, 56, 38-45.
[13] Li, Q., & Reuveny, R. (2006). Democracy and environmental degradation. International studies quarterly, 50(4), 935-956.
[14] Longhi, S. (2014). Cultural diversity and subjective well-being. IZA Journal of Migration, 3(1), 13.
[15] Okulicz-Kozaryn, A. (2011). Does religious diversity make us unhappy?. Mental Health, Religion & Culture, 14(10), 1063-1076.
[16] Park, J., Roh, S., & Yeo, Y. (2011). Religiosity, social support, and life satisfaction among elderly Korean immigrants. The Gerontologist, 52(5), 641-649.