Article
1
Big data log-based correlation analysis profiling auto
2
generation model
3
Dongsik Sohn1, Seungpyo Huh2 , Taejin Lee3, Jin Kwak4
4
1 ISAA Lab., Department of Computer Engineering, Ajou University, Suwon, South Korea;
5
6
2 SOC, Wins., Seongnam, South Korea; [email protected]
7
3 Department of Computer engineering, Hoseo University, Korea; [email protected]
8
4 Department of Cyber Security, Ajou University, Suwon, South Korea; [email protected]
9
* Correspondence: [email protected]; Tel.: +82-10-6773-9484
10
11
Abstract: The number of SIEM introduction is increasing in order to detect threat patterns in a short
12
period of time with a large amount of structured/unstructured data, to precisely diagnose crisis to
13
threats, and to provide an accurate alarm to an administrator by correlating collected information.
14
However, it is difficult to quickly recognize and handle with various attack situations using a
15
solution equipped with complicated functions during security monitoring. In order to overcome
16
this situation, new detection analysis process has been required, and there is an effort to increase
17
response speed during security monitoring and to expand accurate linkage analysis technology. In
18
this paper, reflecting these requirements, we design and propose profiling auto-generation model
19
that can improve the efficiency and speed of attack detection for potential threats requirements. we
20
design and propose profiling auto-generation model that can improve the efficiency and speed of
21
attack detection for potential threats.
22
Keywords: Big Data; SIEM; Correlation Analysis; Cyber Crime Profiling
23
24
1. Introduction
25
According to IDC's latest research report, the global big data and analytics market is expected to
26
grow by 12.4% year-on-year to reach $ 150.8 billion, and investment in analytical solutions is getting
27
increasing [1]. Today, security threats can cause enormous financial damage with new attack
28
techniques. Therefore, each security companies have been actively researching and developing
29
SIEM(Security Information & Event Management) which is big data security solution. Also, the
30
number of companies introducing SIEM solutions is continuously increasing [2].
31
The real-time detection field, which is the core of security monitoring, requires rapid detection
32
of attack sites that are continuously attacking in various ways and correlation analysis in various
33
source logs. However, existing SIEMs have difficulty in preemptive response and rapid analysis due
34
to complex processes and lack of awareness of functions. Therefore, it is necessary to set up an
35
effective function in the managerial aspect so that administrator can easily create and profile rules in
36
various security event logs. This paper is to propose profiling auto-generation model with
37
correlation analysis based on big data log. The proposed model analyzes the rank by attack site and
38
target IP in the existing profile analysis result using graph analysis and correlates these result with
39
Security Intelligence system to identify the most important IP and, finally recommend the profile
40
generation model to the administrator.
41
The composition of this paper is as follows. Chapter 2 analyzes the existing analysis model of
42
integrated security monitoring. Section 3 proposes a profiling auto-generation model with
43
correlation analysis based on big data Log. Section 4 evaluates the experimental results of the
44
proposed model and last section 5 concludes.
45
2. Review of Related Literature
46
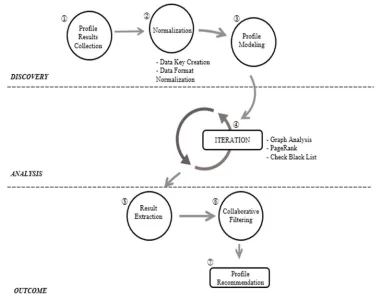
In the case of the Big Data Security Analysis Model, there are a number of analytical methods to
47
detect potential attacks for security threats in the past. Andrey F is a widely used predictive analysis
48
that uses some linear relationship between two variables in various fields. In the security field, It
49
detects abnormal symptoms from heterogeneous security event logs and associates them with each
50
other in gathered logs. Finally, it deduces and finds an event that can be suspected of an attack.
51
However, as the number of data increases, the correlation coefficient value becomes larger and
52
reliability may be lowered[3].
53
SIEM with rule-based analysis studied by In-Seok J and Idoia A filters threat events with
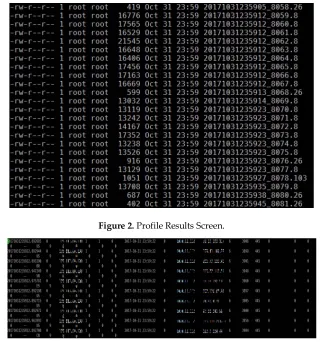
54
conditions such as AND, OR between various events. The filter condition has the advantage of
55
alerting to the administrator in the form of alarm such as Dashboard Pop-up, SMS, E-Mail if various
56
conditions such as attack IP, destination IP, signature, and port are satisfied. But, there are
57
disadvantages in that threats cannot be detected when rules do not exist if the detection rate is good
58
within the defined condition range. So there is always a need for a lot of human resources to
59
maintain the latest rules [4, 5].
60
Alistair S and Manuel E can execute effective detection interworking with SIEM based on
61
highly expert-based scenarios with years of know-how and technology, such as hacking threats
62
response, malware and ransomware analysis. However, there is a disadvantage in that it is
63
necessary to have a specialist group capable of analyzing difficult infringement incidents and that
64
human resources and physical resources should be fully supported[6, 7].
65
Alvaro A and Matthias is an analytical technique that can easily be applied in various fields,
66
from traditional statistical analysis to statistical analysis using a parallel framework. Recently, it is
67
equipped as a function in the security solution. Especially, in the field of security monitoring service,
68
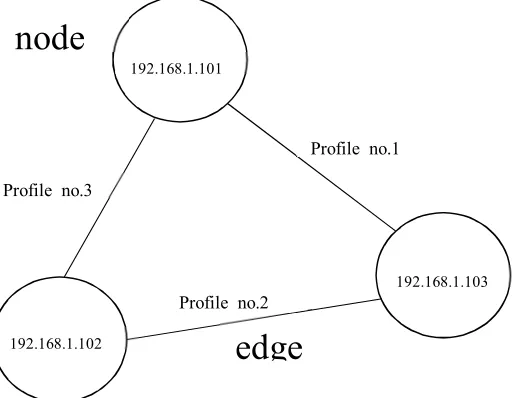
there is active researchers on threat analysis using machine learning and artificial intelligence
69
technology, and blocking and prevention analysis of abnormal patterns in advance[8, 9].
70
Kuan-Yu C and Gerardo C create a pattern or rule based on a specific time with time series
71
analysis and generate an alarm to the administrator when it is determined that the pattern is
72
abnormal. It is mainly used for short-term prediction because it has an advantage that it can analyze
73
the minimum data quickly. However, there is a difficulty in long-term prediction and it is possible to
74
perform mid-term prediction using a lot of information, but a more complicated process is required
75
[10, 11].
76
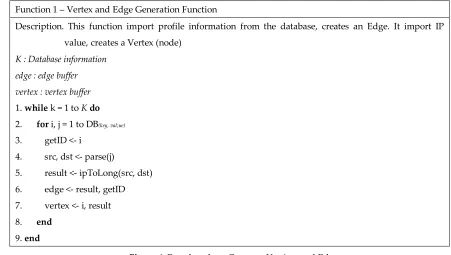
In addition, Yunhong et al. Claim that there are Collaborative Filtering model and
77
Contents-based Filtering model in introducing profile recommendation technology [12], and
78
Collaborative Filtering model is divided into User-based and Item-based again. Collaborative
79
filtering has the advantage of intelligent analysis that it can generate another item is similar to
80
recommendation by measuring similarity, However, there is a disadvantage that it is difficult to
81
recommend without existing data referred to as "cold start." [13][14] The Content-based filtering
82
model analyzes contents itself rather than analyzing the behavior of users and the properties of
83
items so that it solves the cold start problems arising from collaborative filtering. [15] Therefore, in
84
order to solve the problems of the above analysis, in Chapter 3, we propose a model of automatic
85
generation recommendation method that enables cross-reference analysis to minimize security
86
administrator's decision.
87
3. Proposed Scheme
88
3.1. System Overview
89
SniperBD1 which is a big data security solution has a profile function that stores the results
90
detected by different conditions in the heterogeneous security log. Accordingly, a formalization
91
work is required in order to analyze the stored profile results according to the proposed
92
environment. As shown in Figure 1, ① the result of the profile is collected, ② after the
93
formalization work, ③ it is constructing and modeling dataset according to the graph analysis and
94
Security Intelligence information system and sort IP which has malicious activity, ⑤ the result is
96
extracted, ⑥ recommend profile auto-generation based on collaborative filtering and ⑦finally
97
perform an alert function to the administrator.
98
99
Figure 1. System Overview.
100
3.2. Profile Result Collecting - Data Acquisition
101
In the proposed system, if a profile meets various conditions based on heterogeneous security
102
log, it is regarded as abnormal behavior and stored as a profile. The profile information is stored in
103
the order of the detected time and has a filename such as a date and profile IP. Each item of the
104
profile result is configured as result information detected by profile such as Row key, device IP,
105
device name, start time, end time, source IP, destination IP, source port and destination port as
106
shown in Figure 3. Therefore, the necessary information for modeling the profile is source IP and
107
109
Figure 2. Profile Results Screen.
110
111
Figure 3. Profile Results Contents Information Screen
112
3.3. Profile Modeling – Generation Process
113
The source IP and the destination IP among the profile result information are formalized and
114
expressed as a graph theory composed of two elements, namely a node (vertex) and an edge. Graph
115
theory is a mathematical structure used to model relationships between objects and consists of
116
connecting nodes and edges. It is divided into a non-directional graph and directional graph
117
according to the direction of an edge. As shown in Figure 4, the proposed graph network
118
configuration step allows the symmetric edges to have multiple profile relationships between the
119
same IPs and to have the multi-edge in parallel. In other words, one IP is connected to several
120
profiles, and any IP is structured to allow various connections. Table 1 shows the configuration
121
123
Figure 4. Profile Graph Network Configuration.
124
Table 1. Profile Collection Contents.
125
SRC IP DST IP PROFILE ID
192.168.1.101 192.168.1.102
1
192.168.1.102 192.168.1.103
2
192.168.1.103 192.168.1.105
3
126
3.4. Graph Analysis – Page Rank Reference Model
127
PageRank is aimed at getting the rank of each document based on how many documents are
128
linking to it in a web page. This algorithm is used to get the rank of web pages, but it is also used to
129
evaluate the importance of scientific papers or to find influential SNS users. In the proposed method,
130
assuming that each IP is a web page and edge is a profile, it calculates rank ratio by applying the
131
PageRank algorithm. In other words, if the IP referenced in each IP has many edges, the rank is high
132
and it means that this IP is important from another IP. So it is necessary to look closely at security
133
monitoring. Before referring to this model, nodes are represented by IP and links are represented by
134
profiles as shown in Figure 4. Also, as shown in Figure 5, a profile is shown between IPs
135
136
137
Figure 5. Graph model showing node and link relationship.
138
node
edge
192.168.1.101
192.168.1.102
192.168.1.103
Profile no.1
139
Table 2 shows the numerical information about the node, and a long value is sequentially given
140
to generate a unique ID for IP.
141
Table 2. Node Scheme.
142
ID Property
1
192.168.1.100
2
192.168.1.101
3
192.168.1.102
Table 3. Link Scheme.
143
Source ID Destination ID Property
1
2
31
2
3
22
3
2
12
144
In the link scheme of Table 3, the Source ID and the Destination ID represent the unique ID
145
value sequentially given in Table 2, and the profile ID is defined as Property accordingly. For
146
example, the first row of Table 3 is the profile log directing the source 192.168.1.100 to the destination
147
192.168.1.101 in profile 31. According to these schemes, you can configure Vertex (node) and Edge
148
(link) by providing a graph analysis library in Apache Spark to create nodes and edges. The
149
pseudo-code that configures the vertex and edge is as follow as Figure 6. Figure 6 is the pseudo-code
150
for creating Edge and Vertex. To import into Apache Spark's RDD type, after importing profile
151
information from the database, it converts the IP value into Long type and creates Edge with source
152
IP, destination ID and profile ID value. Also, it converts all of profile ID value, source IP, destination
153
IP to Long value except for duplicate IP, then create the vertex and is terminated.
154
155
Function 1 – Vertex and Edge Generation Function
Description. This function import profile information from the database, creates an Edge. It import IP value, creates a Vertex (node)
K : Database information
edge : edge buffer
vertex : vertex buffer
1. while k = 1 to K do
2. for i, j = 1 to DB(key, val;ue)
3. getID <- i 4. src, dst <- parse(j)
5. result <- ipToLong(src, dst) 6. edge <- result, getID
7. vertex <- i, result 8. end
9. end
Figure 6. Pseudocode to Generate Vertices and Edges.
156
157
Figure 7 shows the pseudo-code that performed graph-based PageRank analysis with Edge
158
performs core function for finding the most important IP. When we look at the individual IPs as
160
vertices, they are considered to interact with each other and give importance to all IP (source,
161
destination) existing in the whole graph. This is a method of recommending an important IP to
162
administrators as a given result. It is not simply to give a score because of the high frequency but to
163
give a score to the vertices that seem to be important on the graph. Equation (1) shows a formula for
164
assigning a score to a vertex and updates the rank of each IP with the weighted sum of neighbor
165
ranks for the directional network G with the neighbor matrix A.
166
In this, ‘a’ is a Damping Factor with a value between 0 and 1, ‘N’ is the total number of nodes,
167
and 'd_out(v)’ is a degree toward the link of v.
168
PR(u) = 1 − + ( )/ ( ) (1)
Figure 7 shows pseudo-code that finds the edge of the source IP and destination IP in node
169
using Graph.triplets.filter, and extract black IP list and each array interworking security Intelligence
170
information system with the found source and destination IP.
171
Function 2 – Page Rank Execution Function
Description. It create RDD with vertex and edge buffer information and it perform page rank algorithm after constructing graph.
graph : Graph
eRDD : edge RDD
vRDD : vertex RDD
srcRank : Profile source IP Rank Buffer
dstRank : Profile destination IP Rank Buffer
1. graph <- Graph(vRDD, eRDD) 2. ranks <- graph.pagerank.vertices
3. result <- ranks.join(vRDD) 4. while k = 1 to result do
5. src <- graph.triplets.filter(t => t.srcAttr.equals(k)) 6. dst <- graph.triplets.filter(t => t.dstAttr.equals(k))
7. result <- CheckBlackList(src, dst) 8. srcRank <- k, src, result
9. dstRank <- k, dst, result
10. end
Figure 7. Performs Page Rank Algorithm after Edge and Vertex RDD Generation.
172
3.5. Collaborative Filtering - Automatic Creation Recommendation
173
The proposed automatic creation recommendation model extracts the accuracy based on
174
collaborative filtering and recommends a new profile between similar sets of IP. Collaborative
175
filtering can be learned without knowing the attributes of profile ID and IP, and the data set before
176
learning is shown in Table 4. Table 4 shows the dataset based on the source IP, destination IP, profile
177
ID, and rank ratio created in Figure 8 through the PageRank reference model. Also, the datasheet is
178
made by dividing into source IP and the destination IP as shown in table 4. The created dataset does
179
not include profile ID and IP information. In Table 4, the first field Profile ID is the information
180
stored in the actual database, the second field Item is IP information digitized as an integer. The
181
connected between IPs through the PageRank reference model. Figure 8 shows the pseudo-code for
183
recommending the auto-created profile IP. It creates an ALS recommendation model to abstract the
184
profile IP, profile ID, and rank data. It extracts profile_ip and profile_id from ratings RDD and
185
performs prediction for the pair of profile_ip - item(profile_id) using model.predict. 'profile_ip -
186
item(profile_id)' is used as key and predicted rating is used as a value. It creates a new RDD by
187
combining two RDDs with the same type of key and the actually predicted ratings for the pair of
188
profile_ip – item(profile_id). Finally, it sums the squared errors by using 'reduce' and calculate the
189
mean square error(MSE) by dividing by 'rateandpreds.count'.
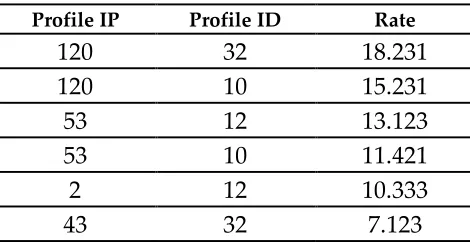
190
Table 4. Graph Analysis Result Data Set Structure.
191
Profile IP Profile ID Rate
120
32
18.231
120
10
15.231
53
12
13.123
53
10
11.421
2
12
10.333
43
32
7.123
192
Function 3 – Auto Generation Recommendation Function
Description. This function is modeled to perform recommend system, the page rank value is evaluated and the profile is recommended measuring average error squared value based on the page rank
value.
1. Get profile_IP, profile_ID
2. ratings <- data.map(case Array(profile_IP, profile_ID, rate)) 3. model <- ALS.train(rantings, rank, numIteration)
4. item <- ratings.map(case Rating(profile_ip, profile_id, rate)) => (profile_ip, profile_id)
5. prediction <- model.predict(item).map(case Rating(profile_ip, profile_id, rate)) => ((profile_ip, profile_id),
rate)
6. rateandpreds <- ratings.map(case Rating(profile_ip, profile_id, rate)) => ((profile_ip, profile_id),
rate).join(predictions)
7. MSE <- rateandpreds.map(case ((profile_ip, profile_id), (r1, r2)) =>
math.pow((r1 – r2), 2)).reduce(_+_) / rateandpreds.count
Figure 8. Pseudocode to Auto Generation Recommendation Model
193
4. Experimental Result
194
4.1. Experimental Environment
195
The experimental environment of the proposed system is shown in Table 5, and the security log
196
is collected in more than 300 security solution. Therefore, we did an experiment in the environment
197
where more than 6000 are detected during 1 month in October among the results detected by the
198
profile function described above.
199
Table 5. Proposed System Configuration.
201
Categorization Version
OS
CentOS 6.6
Store
Hadoop 2.x
Analysis
Apache Spark 1.6.x
Graphx
Database
MariaDB 5.1.x
Collaborative
Filtering
Apache Spark 1.6.x
MLlib
202
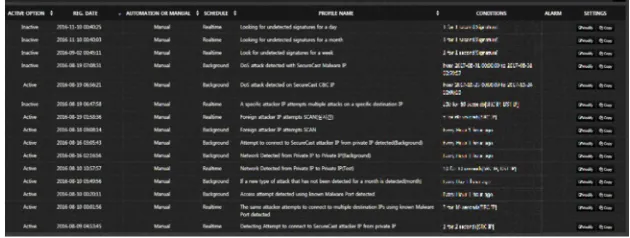
Figure 9 shows about 80 profile screens defined in the proposed system. Each profile was
203
defined with different conditions and the experiment was performed under the condition that more
204
than 6000 cases were detected per day on the profile.
205
206
207
Figure 9. Proposed System Profile Set Screen.
208
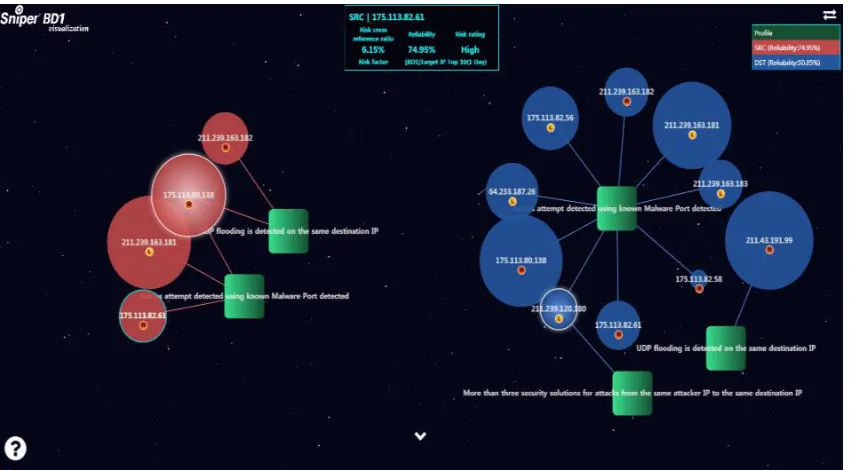
4.2. Experimental Analysis
209
Figure 10 shows the visualization result corresponding to the main part of this study. On the
210
left side is the profile recommendation screen for the source and the right is the profile
211
recommendation screen for the destination. In Figure 10, each IP is a node, and the profile is a link.
212
The larger the size of a circle is displayed, the higher the risk cross-reference rate is, and the smaller
213
the value is displayed, the lower the risk cross-reference rate is. It means that It is considered as more
214
important IP if the risk cross-reference rate has the higher value and, It is considered as relatively
215
less important IP if the risk cross-reference rate has the lower value. In the circle, the threat level
216
indicator is composed of C (critical), H (high), M (medium) and L (low). The Security Intelligence
217
Black IP list is marked with a C rating. Others are indicated by the threat level of the general event
218
log.
219
221
Figure 10. Profile Auto Generation Main Screen.
222
223
The reliability of Figure 10 can be a reliable measure as it is the mean square error value in the
224
auto-generation recommendation model of the proposed method. Accordingly, it can be determined
225
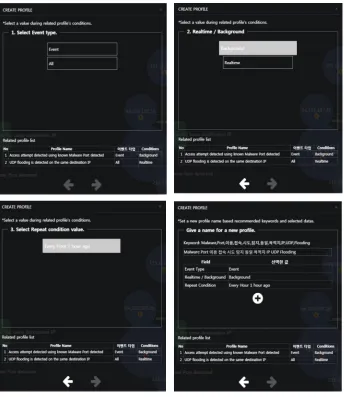
whether the IP is recommended or not according to the reliability. The new profile creation screen is
226
shown in Figure. 11, and a new profile is created in the following order.
227
228
1. When creating a new profile, if you click the IP that can be recommended among the source IP
229
and destination IP, The screen of ① in Figure.11 appears. You can choose which type to detect
230
in the recommended profile.
231
2. If the type is determined, You can select whether to detect in real time or background as shown
232
in ② screen
233
3. In ③ screen for repeat condition setting, the condition for time can be selected in background
234
detection, and the condition for time/number can be selected in real time detection.
235
4. ④ is a screen for creating a new profile title. The recommended profile keyword provides a
236
keyword that can be easily set by the administrator. This keyword is found as a word by the
237
tokenizer() function in the title of the correlation profile and is designated as a central noun by
238
extracting a word root with high detection frequency.
239
240
If you create a profile in the above process, a recommended profile is created in the existing
241
profile definition screen, as shown the red box in Figure 12. First, the default setting is changed from
242
‘unused' to ‘enabled', The log detected by the new recommendation profile can be checked on the
243
245
Figure 11. New Profile Registration Process Screen.
246
247
248
Figure 12. New Profile Registration Screen.
249
4.3. Experimental Result
250
Performance evaluation was performed by using the samples of 45 well-known attack and 50
251
kinds of unknown attack in order to proceed in two types. The samples of well-known attacks are
252
used by the attack related to 2017 OWASP TOP 5 as shown in Table 6 and the samples of unknown
253
attack are used by the attack that was not detected on 'virustotal.com' among the APT attack
254
diagnosed through actual reversing analysis.
255
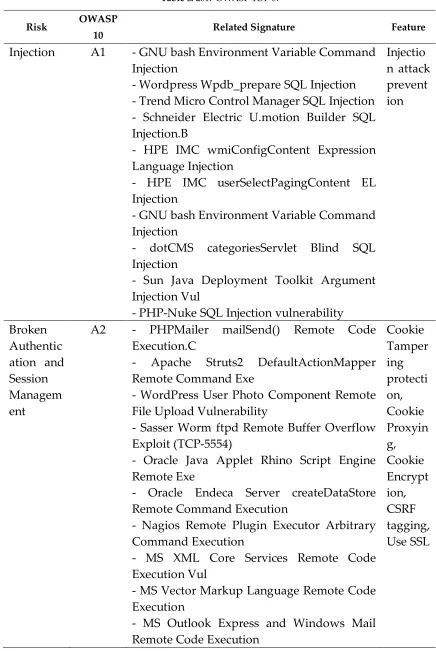
Table 6. 2017 OWASP TOP 5.
257
Risk OWASP
10 Related Signature Feature
Injection
A1
- GNU bash Environment Variable Command
Injection
- Wordpress Wpdb_prepare SQL Injection
- Trend Micro Control Manager SQL Injection
- Schneider Electric U.motion Builder SQL
Injection.B
- HPE IMC wmiConfigContent Expression
Language Injection
- HPE IMC userSelectPagingContent EL
Injection
- GNU bash Environment Variable Command
Injection
- dotCMS categoriesServlet Blind SQL
Injection
- Sun Java Deployment Toolkit Argument
Injection Vul
- PHP-Nuke SQL Injection vulnerability
Injectio
n attack
prevent
ion
Broken
Authentic
ation and
Session
Managem
ent
A2
- PHPMailer mailSend() Remote Code
Execution.C
- Apache Struts2 DefaultActionMapper
Remote Command Exe
- WordPress User Photo Component Remote
File Upload Vulnerability
- Sasser Worm ftpd Remote Buffer Overflow
Exploit (TCP-5554)
- Oracle Java Applet Rhino Script Engine
Remote Exe
- Oracle Endeca Server createDataStore
Remote Command Execution
- Nagios Remote Plugin Executor Arbitrary
Command Execution
- MS XML Core Services Remote Code
Execution Vul
- MS Vector Markup Language Remote Code
Execution
- MS Outlook Express and Windows Mail
Remote Code Execution
Cross-Site
Scripting
(XSS)
A3
- EPSON TMNet WebConfig XSS
- D-Link PHP ActionTag XSS
- Cacti spikekill.php XSS
- Apache Struts2 XWork WebWork XSS.A
- Apache Struts2 XWork WebWork XSS
- Apache Struts2 Dynamic Method Invocation
XSS
- Apache Struts showConfig.action XSS
- Apache Struts actionNames.action XSS
- MS System Center Operations Manager Web
Console XSS
- MS SharePoint Server Callback Function XSS
XSS
Attack
zPreven
tion
Broken
Access
Control
A4
- Apache Struts2 ParametersInterceptor
ClassLoader Sec Bypass.C
- Apache Struts2 ParametersInterceptor
ClassLoader Sec Bypass.B
- Apache Struts2 ParametersInterceptor
ClassLoader Sec Bypass.A
- Apache Struts2 ParametersInterceptor
ClassLoader Sec Bypass
- Apache Struts Parameters Interceptor
security bypass
- Apache Struts 2 ParameterInterceptor Class
OGNL Command Exe
- Apache Struts CookieInterceptor Security
Bypass(8080)
- Apache Struts CookieInterceptor Security
Bypass
Apache
Struts
security
bypass
vulnera
bility
Security
Misconfig
uration
A5
- OpenSSL X.509 IPAddressFamily Extension
Parsing Error DoS.A
- OpenSSL X.509 IPAddressFamily Extension
Parsing Error DoS
- OpenSSL TLS Heartbeat Extension Memory
Disclosure
- OpenSSL TLS Heartbeat Extension Memory
Disclosure
- Linux ftpd SSL Buffer Overflow (TCP-21)
PCI
reports,
SSL
features
In the first experiment, samples were applied to the A-system as a rule-based analysis system,
258
the B-system as a correlation-based system, and the proposed system. However, since the analysis
259
methods and results of the comparative systems are different from each other, they are regarded as
260
the same if they result in correlated or cross-referenced derivatives. Before detecting potential
261
threats, Table 7 shows the results of preliminary testing of 45 well-known attacks in Table 6 for the
262
comparison and proposed systems for one month in October. Table 7 shows the number of
263
average, both systems A and B seem to have a large number of correlated generations for
265
well-known attacks, however, the average number of cross-references in the proposed system is
266
significantly higher than that of the comparison system. Also, in the results verified to determine the
267
accuracy of whether it is an actual well-known attack or not in the proposed system, 150 cases, 83%
268
of the average number of cases, were actually detected as well-known attacks. This means that the
269
newly created profile can detect well-known attacks.
270
Table 7. Comparison of existing system and proposed system after Well Known Attack
271
System A1 A2 A3 A4 A5 AVG TP FP TPR
A
4
17
8
4
9
41
20
19
49%
B
12
7
3
6
15
43
22
21
51%
Proposal
53
14
34
45
33
179
150
39
83%
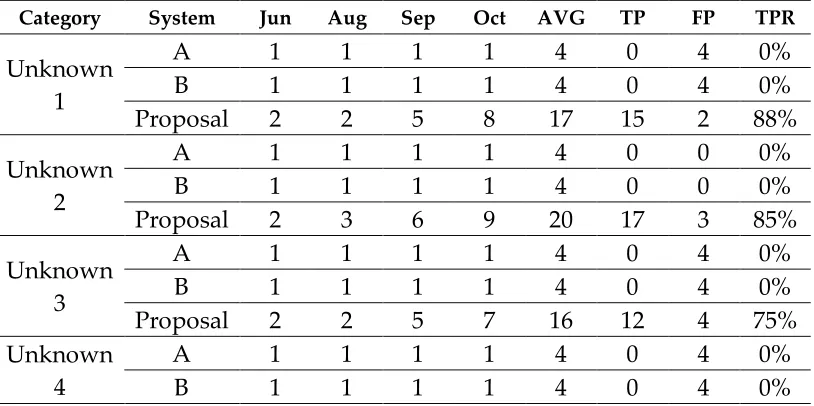
In second experiment, we re-register the profile or rule of each result derived from the first
272
experiment in each system and attack 50 kinds of Unknown attack. Unknown attacks are samples
273
which is classified into five categories such as Scanning, Network, DoS, Web, and System, and which
274
is self-developed to do real malicious behavior. Unknown attack detection is considered as
275
successful detection if the results detected by the condition are extracted or there are
276
cross-referenced generation after unknown attack. As a result of the detection test from July to
277
October as shown in Table 8, The number of the extraction result and reference generation detected
278
by the condition for all attacks were 1, but the proposed system showed more than 2 cases per
279
month. In detail, each one detected in systems A and B was blocked in a whitelist scheme that
280
blocked all values except the first allowed list. Whitelist security can be more secure, but it is not
281
recommended because it is difficult to operate. However, the proposed system detected a large
282
number of unknown attacks, and the number of detections in the proposed system was two in July
283
and an average of eight in October as shown in Figure 13. This means that the generated profile
284
condition is to detect the variant of the unknown attack effectively by increasing the detection
285
conditions to several combinations. In the results verified to determine the accuracy of whether it is
286
an actual well-known attack or not in the proposed system, over 85% of the average number of cases
287
in all category except unknown 3, were actually detected as unknown attacks. This means that the
288
newly created profile can detect well-known attacks. As a result, we could evaluate the performance
289
of the proposed system with the automatically generated profile results through the second
290
experiment. Also, we can evaluate whether the proposed auto generation profile can detect potential
291
threats or effectively cope with zero-day attacks through experimental evaluation.
292
Table 8. Comparison of existing system and proposed system after Unknown Attack
293
Category System Jun Aug Sep Oct AVG TP FP TPR
Unknown
1
A
1
1
1
1
4
0
4
0%
B
1
1
1
1
4
0
4
0%
Proposal
2
2
5
8
17
15
2
88%
Unknown
2
A
1
1
1
1
4
0
0
0%
B
1
1
1
1
4
0
0
0%
Proposal
2
3
6
9
20
17
3
85%
Unknown
3
A
1
1
1
1
4
0
4
0%
B
1
1
1
1
4
0
4
0%
Proposal
2
2
5
7
16
12
4
75%
Unknown
4
A
1
1
1
1
4
0
4
0%
Proposal
1
3
7
10
42
37
5
88%
Unknown
5
A
1
1
1
1
4
0
4
0%
B
1
1
1
1
4
0
4
0%
Proposal
2
3
5
8
18
16
2
88%
294
Figure 13. Detection Result after Unknown Attack
295
5. Conclusions
296
The profile function of the SIEM solution is to detect and recognize the event log detected by the
297
conditions set by the administrator. On the contrary, there is a disadvantage that it is difficult to
298
generate a profile and response speed is slow unless the expert technology is cultivated. The
299
proposed model of this study does not need such technical expertise and can reduce the speed of
300
response as much as possible. Also, it is possible to create a profile in only a few steps. In addition, it
301
is possible to do scenario analysis in hacking threats through cross-reference analysis between
302
several profiles and, it reduces analysis and response time in terms of infringement accident
303
analysis. Currently, SIEM is designed as a semi-automatic setting so that the recommended profile
304
conditions in real business can be changed by the administrator, but it will be automated to
305
minimize administrator decision as reducing profile conditions.
306
6. Acknowledgment
307
This work was supported by the National Research Foundation of Korea(NRF) grant funded by
308
the Korea government(MSIT) (No. NRF-2017R1E1A1A01075110).
309
Conflicts of Interest: The authors declare no conflict of interest.
310
References
311
1. http://www.kr.idc.asia/press/pressreleasearticle.aspx?prid=483
312
2. Gartner Magic Quadrant. Magic Quadrant for Security Information and Event Management. 2016, 3.
313
3. Reza, S.; Ali, G. Alert Correlation Survey: Framework and Techniques. Proceedings of the 2006 International
314
Conference on Privacy, Security and Trust. Article No, 37, Oct, 2006.
315
4. Andrey, F.; Igor, K.; Didier, E. Correlation of security events based on the analysis of structures of event
316
types, Intelligent Data Acquisition and Advanced Computing Systems: Technology and Applications
317
5. Jeon, I.-S.; Han, K.-H.; Kim, D.-W; Choi, J.-Y. Using the SIEM Software vulnerability detection model
319
proposed. Journal of The Korea Institute of Information Security & Cryptology. VOL.25, NO.4, Aug, 2015
320
6. Idoia, A.; Sergio, A. Improving the Automation of Security Information Management: A Collaborative
321
Approach. IEEE Security & Privacy, Vol. 10, issue 1, pp, 55-59, Jan,-Feb, 2012
322
7. Alistair, S. Scenario-based requirements analysis. Requirements Engineering. Vol 3, issue 1, pp 48–65,
323
March 1998.
324
8. Manuel, E.; Theodoor, S.; Engin, K.; Christopher, K. A survey on automated dynamic malware-analysis
325
techniques and tools. Journal ACM Computing Surveys, Vol 44, issue 2, Feb, 2012.
326
9. Alvaro, A.; Pratyusa, K.; Sreeranga, P. Big Data Analytics for Security. IEEE Security & Privacy, Vol. 11,
327
issue 6, Nov-Dec, 2013.
328
10. Matthias, G.; Michael, Felderer.; Basel, K.; Adrian, T.; Ruth, B.; Alessandro, M. Anomaly Detection in the
329
Cloud: Detecting Security Incidents via Machine Learning. International Workshop on Eternal Systems:
330
EternalS 2012: Trustworthy Eternal Systems via Evolving Software.Data and Knowledge. pp 103-116.
331
11. Chen, K.-Y.; Luesak, L.; Chou, S.-T. Hot Topic Extraction Based on Timeline Analysis and
332
Multidimensional Sentence Modeling. IEEE Transactions on Knowledge and Data Engineering. Vol. 19, issue 8,
333
Aug, 2007.
334
12. 12. Gerardo Canfora, Michele Ceccarelli, Luigi Cerulo, Massimiliano Di Penta, “Using multivariate time
335
series and association rules to detect logical change coupling: An empirical study”, Software Maintenance
336
(ICSM), 2010 IEEE International Conference on, Sep, 2010
337
13. 13. Yunhong, ZhouDennis, WilkinsonRobert, SchreiberRong Pan, “Large-Scale Parallel Collaborative
338
Filtering for the Netflix Prize”, International Conference on Algorithmic Applications in Management, pp.
339
337-348. 2008
340
14. 14. Badrul Sarwar, George Karypis, Joseph Konstan, John Riedl, “Item-based collaborative filtering
341
recommendation algorithms”, Proceeding WWW '01 Proceedings of the 10th international conference on World
342
Wide Web, pp. 285-295. ACM New York, NY, USA ©2001
343
15. G. Linden, B. Smith, J. York, “Amazon.com recommendations: item-to-item collaborative filtering”, IEEE
344