For Peer Review
Standard PK/PD concepts can be applied to determine a dosage regimen for a macrolide: the case of tulathromycin
in the calf
Journal: Journal of Veterinary Pharmacology and Therapeutics Manuscript ID JVPT-2016-2282
Manuscript Type: Original Article Date Submitted by the Author: 19-Jan-2016
Complete List of Authors: Toutain, Pierre; Ecole Nationale Veterinaire de Toulouse, POTTER, Timothy Jonh; The Royal Veterinary College
Pelligand, Ludovic; Royal Veterianry College, Veterinary Basic Sciences Lacroix, Marlene; Ecole National Veterinaire de Toulouse,
Illambas, Joanna; The Royal Veterinary College Lees, Peter
For Peer Review
Standard PK/PD concepts can be applied to determine a dosage regimen for a
macrolide: the case of tulathromycin in the calf
P.-L.Toutain1*,T. Potter2#a, L. Pelligand2, M. Lacroix1, J. Illambas2#b, P. Lees2
1 École Nationale Vétérinaire de Toulouse, UMR 1331 Toxalim INRA, 23, Chemin
des Capelles-BP 87614, 31076 Toulouse Cedex 03, France.
2
The Royal Veterinary College, Hawkshead Campus, Hatfield, Herts., AL9 7TA,
United Kingdom
#a
Current address: Westpoint Veterinary Group, Dawes Farm, Bognor Road,
Warnham, Sussex, RH12 3SH, United Kingdom
#b
Current address: Zoetis, Global Development & Operations, VMRD, Hoge Wei 10,
B-1930 Zaventem, Belgium
*Corresponding author: Pierre-Louis Toutain
E-mail to : [email protected] Fax: +33 561 19 39 17
Short running title: PK/PD for dosage regimen for tulathromycin in calf
Key words: Tulathromycin; PK/PD; dosage regimen; Monte Carlo simulation
For Peer Review
Abstract
1
The pharmacokinetic (PK) profile of tulathromycin, administered to calves
2
subcutaneously at the dose rate of 2.5 mg/kg, was established in serum, inflamed
3
(exudate) and non-inflamed (transudate) fluids in a tissue cage model. The PK profile
4
of tulathromycin was also established in pneumonic calves. For Mannheimia
5
haemolytica and Pasteurella multocida, tulathromycin Minimum Inhibitory
6
Concentrations (MIC) were approximately 50 times lower in calf serum than in
7
Mueller Hinton Broth. The breakpoint value of the PK/pharmacodynamic (PD) index
8
(AUC(0-24h)/MIC) to achieve a bactericidal effect was estimated from in vitro time-kill
9
studies to be approximately 24 h for M. haemolytica and P. multocida. A population
10
model was developed from healthy and pneumonic calves and, using Monte Carlo
11
simulations, PK/PD cut-offs required for the development of Antimicrobial
12
Susceptibility Testing (AST) were determined. The population distributions of
13
tulathromycin doses were established by Monte Carlo Computation (MCC). The
14
computation predicted a Target Attainment Rate (TAR) for a tulathromycin dose rate
15
of 2.5 mg/kg of 66% for M. haemolytica and 87% for P. multocida. The findings
16
indicate that free tulathromycin concentrations in serum suffice to explain the efficacy
17
of single dose tulathromycin in clinical use, and that a dosage regimen can be
18
computed for tulathromycin using classical PK/PD concepts.
19 20
Introduction
21
Good clinical efficacy and bacteriological cure with macrolides in human and animal
22
medicine are commonly achievable with plasma/serum concentrations that are lower,
23
For Peer Review
for tulathromycin (Nowakowski, Inskeep et al., 2004), gamithromycin (Huang,
25
Letendre et al., 2010) and tildipirosin (Menge, Rose et al., 2012), three agents of the
26
triamilide sub-class, licensed for farm animal use. Because of the disparity between
27
in vivo plasma concentration and in vitro MICs, the application of classical PK/PD
28
concepts to macrolides has frequently been challenged. This has led some authors
29
and regulatory authorities to claim that there is no plasma concentration-effect
30
relationship for macrolides. A corollary has been to propose that dosages for clinical
31
use can only be established in a clinical setting using a dose-titration approach.
32
However, an alternative to this view is to question the value and applicability of the in
33
vitro MIC data obtained in matrices optimized for bacterial growth, as for example in
34
Mueller Hinton Broth (MHB). This issue is addressed in this article.
35
To explain the clinical efficacy of macrolides at recommended dose rates,
36
alternatives to the PK/PD paradigm have been proposed. For example, many authors
37
have proposed that lung tissue concentration is more relevant than that in
38
plasma/serum, in determining outcome of treatment with macrolides. For
39
tulathromycin, the drug investigated in the present paper, lung homogenate
40
concentrations in pigs and calves were more than 50-fold higher than corresponding
41
plasma concentrations (Nowakowski, Inskeep et al., 2004; Villarino, Lesman et al.,
42
2013). However, it is now widely accepted that lung homogenate is not the biophase
43
for lung infections (Mouton, Theuretzbacher et al., 2008; Villarino, Brown et al., 2013;
44
Villarino, Lesman et al., 2013; Villarino, Lesman et al., 2013; Villarino, Brown et al.,
45
2014). The two pathogens considered in this article, Pasteurella multocida and
46
Mannheimia haemolytica, are strictly extracellular pathogens and pulmonary
47
epithelial lining fluid (PELF) is the main location for such extracellular organisms. In
48
some studies, PELF concentrations have exceeded the plasma non-protein bound
49
For Peer Review
concentrations, leading to a view of the lung as a local drug “reservoir”, able to
50
control the local extracellular concentration. However, in vivo conditions are dynamic
51
and any (very slow) release of drug from the lung (very long half-life) would be
52
unable to maintain an effective local extracellular concentration. Consequently, the
53
lungs should, rather, be viewed not as a “reservoir” but as a “sump”. According to
54
Kiem and Schentag (Kiem & Schentag, 2008), it is the lysis of cells (containing high
55
drug concentrations) during the bronchoalveolar lavage procedure required to collect
56
PELF that explains high PELF drug concentrations. Therefore, these authors,
57
consider the high drug concentrations in PELF to be artefactual.
58
Many reports have shown that macrolides may accumulate in high concentrations in
59
neutrophils and macrophages (Scorneaux & Shryock, 1998; Scorneaux & Shryock,
60
1999; Villarino, Brown et al., 2013). Uptake by and subsequent off-loading of drug,
61
for example azithromycin, from these cells in vivo has been proposed as a
62
mechanism of drug delivery to the biophase (Gladue, Bright et al., 1989; Mandell &
63
Coleman, 2001; Bosnar, Kelneric et al., 2005). However, in vivo evidence to support
64
this hypothesis is entirely lacking and it may also be questioned on theoretical
65
grounds using mass balance considerations. Even assuming that the entire
66
circulating neutrophil pool is in the lung extracellular water (about 2x10¹¹ cells
67
corresponding to a volume of 6mL for a 50kg calf) and also that the total macrolide
68
content is immediately released, the neutrophil pool would be unable to dynamically
69
control the local biophase concentration over the several days of the claimed
70
duration of drug efficacy. We conclude that it is most improbable that these cells can
71
be accorded the role of “truck-containing bullets off-loading their drug content” and
72
targeting the biophase, thereby achieving in vivo high local and sustained drug
73
For Peer Review
microdialysis techniques, it has been shown that inflammation generally does not
75
increase local antimicrobial drug (AMD) concentrations (Muller, dela Pena et al.,
76
2004).
77
In light of the challenges to the applicability of the PK/PD paradigm to macrolides, the
78
aim of this study was to generate PK and PD data for tulathromycin for M.
79
haemolytica and P. multocida in calves to show that it is possible to establish
80
therapeutically relevant in vivo PK/PD relationships for a macrolide, as for any AMD
81
(Toutain, del Castillo et al., 2002; Toutain & Lees, 2004). More specifically, using a
82
population PK model of tulathromycin disposition, we have estimated PK/PD cut-offs
83
of tulathromycin to compare their Target Attainment Rate (TAR) with the current
84
clinical breakpoints (BP) used for Antimicrobial Susceptibility Testing (AST) in cattle.
85
Finally, using MIC distributions of M. haemolytica and P. multocida, we have
86
generated by Monte Carlo computation (MCC) the population distribution of the
87
tulathromycin doses to determine the corresponding TAR for the currently marketed
88
dose of 2.5 mg/kg. This has provided a comparison of results obtained using a
89
PK/PD approach with the dose derived from the dose titration approach.
90 91
Materials and Methods
92
Animals and procedures
93
This study was carried out in strict accordance with the recommendations in the
94
Guide for the Care and Use of Laboratory Animals of the National Institutes of
95
Health. The protocol was approved by the Ethics and Welfare Committee of the
96
Royal Veterinary College and the UK Home Office (Project License 70/6986) and all
97
efforts were made to minimize suffering.
98
For Peer Review
99
A PK study was conducted in 10 healthy female Aberdeen Angus calves and 16
100
calves that were subjected to an experimental pulmonary infection. For healthy
101
calves, body weights were in the range 145-204 kg and ages ranged from 79-131
102
days. Tissue cages were implanted subcutaneously in the paralumbar fossa, under
103
general anesthesia, as described by Sidhu et al. (Sidhu, Shojaee Aliabadi et al.,
104
2003). Tulathromycin (Draxxin®, Pfizer Animal Health, Sandwich, Kent, UK) was
105
injected subcutaneously into the flank at a dose rate of 2.5 mg/kg at zero time. Also
106
at zero time, 0.5 mL of 1% w/v sterile lambda carrageenan solution in saline
107
(Viscarin, Marine Colloids, Springfield, Ill, U.S.A.) was injected into a single tissue
108
cage. This cage was used to harvest exudate. A second, unstimulated cage was
109
used to collect non-inflammatory fluid (transudate).
110
A pneumonia model using M.haemolytica type A1; ref M 7/2 was used in 16
two-111
week old Holstein Friesian bull calves. Upon arrival, animals were treated with a
112
single subcutaneous dose of florfenicol 40 mg/kg bodyweight (Nuflor,
Schering-113
Plough Animal Health, Middlesex, UK), to ensure freedom from sub-clinical
114
infections. Animals were weaned at 5-6 weeks of age, after which they were group
115
housed until the start of the study. The calves were 12-13 weeks of age at the
116
commencement of the study. A M. haemolytica inoculum containing 1.27-9.60 109
117
cfu/mL was used to induce pneumonia as previously described (Sarasola, Jernigan
118
et al., 2002).
119 120
For Peer Review
Sampling procedures
121
For healthy calves, blood samples (10 mL volume) were collected, protected from
122
light, from a jugular vein, into vacutainers (Becton, Dickinson and Company, Oxford,
123
Oxon, U.K.) without anticoagulant, before and regularly up to 336 h after injection of
124
tulathromycin. Exudate and transudate samples (1.5 mL volume) were collected,
125
protected from light, before and regularly up to 336 h after dosing. All samples were
126
centrifuged (2000 g for 10 min at 4°C) and supernatants stored at -70°C prior to
127
assay for tulathromycin concentration and for measurement of ex vivo antibacterial
128
activity. For experimentally infected calves, blood samples were collected regularly
129
from time 0 to 48 h after injection of tulathromycin and samples were processed as
130
described for the healthy calves.
131 132
Analysis of tulathromycin in serum, exudate and transudate
133
Serum, exudate and transudate samples were assayed for tulathromycin, using a
134
tandem mass spectrometry method, adapted from Scheuch et al. (Scheuch, Spieker
135
et al., 2007).
136
The methods were validated according to the published guideline (Committee for
137
medicinal products for human use (CHMP), 2011). Selectivity was checked for each
138
matrix. A quadratic model weighted by 1/X2 was selected over the calibration range
139
5-1000 ng/mL. Intra-day and inter-day precisions were less than 15% and the
140
accuracy ranged from 102 to 106%. The lower limit of quantification (LLOQ) was 5
141
ng/mL with a precision of 8% and an accuracy of 105%. The processed extracts of
142
tulathromycin were stable in the autosampler at room temperature for at least 24 h.
143 144
For Peer Review
Pharmacokinetic-pharmacodynamic modelling of in vitro time-kill data
145
PK/PD modelling of in vitro time-kill data was undertaken to compute the BP value of
146
the PK/PD index (AUC(0-24h)/MIC) selected to express tulathromycin in vivo activity
147
i.e. its bacteriostatic, bactericidal or 4 log10 decrease in count potency. Data from
148
previously reported time-kill studies, using both MHB and calf serum as matrices,
149
were used for PK/PD modelling (see for details (Lees, Illambas et al., 2016)). Briefly,
150
six isolates each of the species M. haemolytica and P. multocida were investigated,
151
using tulathromycin concentrations corresponding to 0.25, 0.5, 1, 2 and 4 x multiples
152
of MIC. The bacterial growth, after 24 h incubation in the absence or presence of a
153
given tulathromycin concentration (expressed as log10 cfu/mL subtracted from the
154
initial inoculum count log10 cfu/mL), was measured as the response to the
155
tulathromycin in vitro activity (dependent variable); the ratios of AUC(0-24h)/MIC were
156
calculated for each isolate at each of the five tulathromycin concentrations tested and
157
these comprised the independent variable for fitting data to a sigmoidal Emax model to
158
estimate parameters of tulathromycin efficacy and potency (Equation 1).
159
max 0
50
N
N N
E C
E E
EC C
×
= +
+ (1)
160
where E is the bacterial growth for a given concentration of tulathromycin; E0 is the
161
corresponding bacterial growth in the absence of drug (control samples); Emax (the
162
efficacy parameter) is the maximum antimicrobial growth inhibition determined as the
163
change in log10 cfu/mL over 24 h incubation; 50
N
EC (the potency parameter) is the
164
AUC(0-24h)/MIC value providing 50% of the maximum antibacterial effect; C (the
165
independent variable) is the concentration term (expressed as AUC(0-24h)/MIC); and N
166
is the Hill coefficient. The AUC(0-24h)/MIC corresponding to a bacteriostatic effect
167
For Peer Review
(E=0, no change form initial inoculum count), a bactericidal effect (E=-3, a 3log10
168
reduction from initial inoculum count) or (E=-4 a 4log10 reduction from initial inoculum
169
count) were computed by solving equation 1 for each isolate of each organism in
170
MHB and serum (Aliabadi & Lees, 2001; Lees, Shojaee Aliabadi et al., 2004).
171 172
Pharmacokinetic analyses
173
Tulathromycin concentration-time data in serum, exudate and transudate in individual
174
calves were analyzed using the WIN-NONLIN regression program (Pharsight
175
Corporation, Mountain View, CA, USA) submitted to non-compartmental analysis
176
using the statistical moment approach.
177
A more advanced population analysis was carried out with Phoenix (Phoenix
178
WinNonlin 6.3 and NLME1.2; Certara, L.P., St. Louis, MO, USA) to analyze
179
simultaneously the serum concentrations obtained from the 10 control calves and the
180
16 calves subjected to an experimental infection. The more specific goal of the
181
population analysis was to develop a basic model of tulathromycin disposition in
182
calves, in order to compute the PK/PD cut-off values that could be used
183
subsequently to select a clinical BP for an AST that will be adapted to the calf. As the
184
BP for any AST is always a single value (for a given species and a given pathogen) a
185
PK model including different co-variates was not required for this objective.
186
Nevertheless, we explored the health status (pneumonic vs. control calves) as a
187
relevant co-variate to assess the influence, if any, of an experimentally induced
188
pneumonia on tulathromycin disposition in the calf.
189
For Peer Review
The selected structural model was a bi-exponential model for an extravascular route
190
of administration. The parameterisation was carried out in terms of macroconstants
191
corresponding to equation 2:
192
( )
(
)
(
) (
)
(
)
Y t = A EXP× − ×
α
t +B EXP× − ×β
t − A B+ ×EXP −KA t× (2)193
Where A and B (ng/mL) are intercepts and Ka,Alpha and Beta are slopes (1/h) with
194
Ka>alpha>beta. The estimated fixed parameters (the thetas vector) are reported as
195
their typical values (tv). The second component of a mixed effect model is the
196
random component (random effect). The Between Subject Variability (BSV) was
197
modeled using an exponential model of the form:
198
( )
1
i EXP i
θ
=θ
×η
(3)199
where θi is the value of theta in the ith animal, θ1 is the typical population value of
200
this theta and ηi, the deviation (noted eta) associated to the ithanimal from the
201
corresponding theta population value. The distribution of the etas was assumed to
202
be normal with a mean of 0 and a variance ω2.
203 204
A full covariance matrix of the etas was estimated. From the diagonal of this matrix,
205
formed by the variance terms in the log-domain, we estimated the BSV using
206
equation 4 which converts the variance to a coefficient of variation (CV%) in the
207
original scale.
208
( )
( )
2% 100 1
CV = × EXP ω − (4)
209
The full matrix of the etas was used for the subsequent Monte Carlo simulations.
210
For Peer Review
The residual model which reflects unexplained variability after controlling for other
211
sources of variability (analytical imprecision, departure from the model) was a
212
multiplicative (proportional) model with ε the error term having a mean of 0 and a
213
variance σ2.
214
Parameter estimation with associated standard errors (SE), as a measure of the
215
precision of the estimation, was based on minimizing an objective function value
216
using maximum likelihood estimation. A Quasi-Random Parametric Expectation
217
Maximization (QRPEM) was selected for this estimation. Shrinkage of random effects
218
towards the means was calculated for the etas and epsilon, allowing use of Empirical
219
Bayes Estimates -based diagnostic (Karlsson & Savic, 2007).
220
Monte Carlo simulations with the basic model were performed to generate 1,040 data
221
sets from 0 to 336 h with a step of 6 h. These simulated serum tulathromycin
222
concentration profiles were used to determine the PK/PD cut-off values and the
223
distribution of the apparent clearance, which was used for the population dose
224
computation.
225 226
Population Dosage prediction
227
The adequacy of the current dosage of tulathromycin (2.5 mg/kg) was explored by
228
computing population doses covering different TAR i.e. different percentages of the
229
population to assess the ability of a PK/PD model to validate or not the current dose
230
for tulathromycin. For AMDs for which the PK/PD index that best predicts efficacy is
231
AUC(0-24h)/MIC, the following equation can be used (Equation 5).
232
( )
for 10 days for 10 days of activity
distribution
Cl SF MIC
Dose
fu F
× ×
=
× (5)
233
For Peer Review
Where Dose is the amount of AMD to be administered to guarantee an activity of
234
tulathromycin over 10 days for a given TAR (see Discussion for the selection of this
235
10 days duration ); Clfor 10 days is the population distribution of the apparent plasma
236
clearance (Cl/F) as obtained in our population PK analysis; SF is a scaling factor
237
without units, obtained by dividing the BP value of the PK/PD index i.e. AUC
(0-238
24h)/MIC, by 24 h, permitting computation of a SF of 1 for the present analysis; this
239
indicates that, to achieve a bactericidal action, the average serum concentration of
240
tulathromycin should be equal to the MIC (see (Toutain, Bousquet-Melou et al., 2007)
241
for further explanation on derivation of the SF from AUC(0-24h)/MIC); fu is the free
242
drug fraction (Anonymous, 2005) (the binding to serum protein is low, with the bound
243
fraction ranging from 0.32 to 0.39 in cattle) and we incorporated in equation 5 fu as
244
a uniform distribution between 0.61 and 0.68. For the MIC distributions, the results of
245
a survey kindly provided by J. Watts (Zoetis) giving the MIC distribution of P.
246
multocida and M. haemolytica from the years 2004 to 2010, obtained in artificial
247
broth, were used. We first selected all the MICs equal to or less than the BP
248
proposed by the CLSI i.e. 16 µg/mL; this value is, according to CLSI, the susceptible
249
pathogen population that clinically can be successfully treated with tulathromycin and
250
that should therefore be considered to compute a dose. The percentage of
251
susceptible pathogens was 89.82% and 91.11% for M.haemolytica (n=2233 strains)
252
and P. multocida (n=2483 strains), respectively. The MHB MICs were then
253
transformed into vectors of equivalent MICs in serum by dividing all reported MICs
254
by a factor of 50 i.e. by the SF previously determined when comparing MICs in the
255
two matrices (Lees, Illambas et al., 2016).
256 257
For Peer Review
Dosage distribution was computed using MCC (n=5000) in Oracle Crystal Ball
258
(Oracle Corporation, Redwood Shores, CA, USA) and the range of TAR from 0 to
259
90% of cases for which a range of dose levels are able to achieve an average serum
260
concentration equal to the MIC over the 10 days. The dose level corresponding to a
261
TAR of 90% was considered as the population dose of tulathromycin, given the
262
actual susceptible MIC distribution and assuming activity duration of 10 days. Finally,
263
a sensitivity analysis was carried out to apportion the overall variability of the dose
264
distributions either to the PK variables (clearance, fu) or to the PD variability (MIC).
265
Figure 1 gives a flowchart of the different steps for data collection and analysis.
266
Fig.1
267 268
Statistical analyses
269
PK variables are presented as geometric, harmonic or arithmetic means, as
270
appropriate, and SEM. Mean differences in AUC(0-24h)/MIC ratios determined in MHB
271
compared with those determined in serum for bacteriostatic, bactericidal and 4log10
272
reductions in count were compared by ANOVA.
273 274
Results
275
Calf in vivo study
276
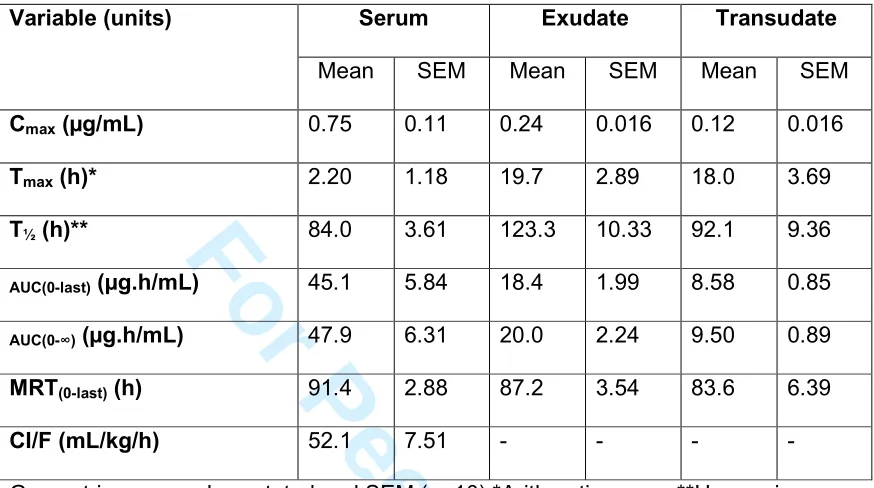
Tulathromycin concentrations in serum, exudate and transudate (NCA
277
analysis)
278
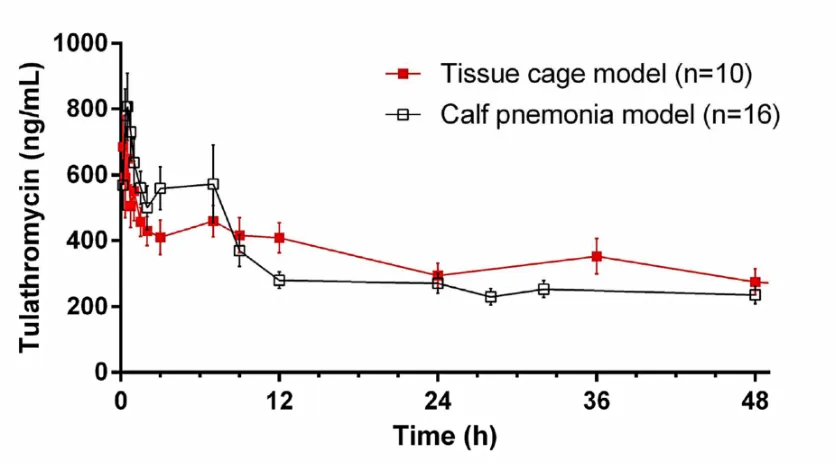
The mean (+SEM) concentrations of tulathromycin are presented in Fig. 2 (serum,
0-279
15 h) and Fig. 3 (serum, exudate and transudate, 0-336 h). Maximum concentration
280
(Cmax) of tulathromycin (0.69 µg/mL) was often observed at the first sampling time (10
281
min). Concentrations exceeded 0.40 µg/mL up to 12 h and were still quantifiable
282
For Peer Review
(mean = 0.025 µg/mL) at 336 h. Serum terminal half-life was 84.0 h and mean
283
residence time (MRT) was 91.4 h (Table 1).
284
Fig. 2
285
Fig. 3
286 287
Penetration of tulathromycin into and clearance from carrageenan-induced exudate
288
and transudate were dissimilar. Concentrations (Cmax) and areas under curves
289
(AUC(0-last)) were higher in exudate than in transudate; 0.24 and 0.12 µg/mL for Cmax
290
(P<0.05) and 18.4 and 8.58 µg.h/mL for AUC(0-last) (P<0.05). More importantly , for
291
both non-vascular fluids concentrations and areas were lower than in serum at all
292
sampling times, P<0.01 (for serum Cmax = 0.75 µg/mL and AUC(0-last) = 45.1 µg.h/mL)
293
indicating a lack of tulathromycin accumulation in an inflammatory fluid compared to
294
serum (see discussion). However, mean values of MRT were similar for all three
295
fluids, indicating that a state of equilibrium was achieved between the tissue cages
296
and serum.
297 298
Pharmacokinetic-pharmacodynamic surrogates
299
PK/PD integration established the surrogates, Cmax/MIC, T>MIC, AUC(0-24h)/MIC and
300
AUC(0-∞)/MIC for tulathromycin, derived from in vivo concentrations in the PK study
301
(n=10) and in vitro MICs (n=6 for each species) measured in serum. Based on the
302
geometric mean serum MICs of 0.04 µg/mL for both P. multocida and M.
303
haemolytica, Cmax/MIC (18.75±0.11), AUC(0-24h)/MIC (238±5.8h), AUC(0-∞)/MIC ratios
304
(1198±6.3h) and T>MIC (281±17.5h) indicated that serum concentrations of
305
For Peer Review
tulathromycin would be predicted to have a high level of activity against the six
306
strains each of P. multocida and M. haemolytica investigated.
307
In vitro PK/PD modelling to establish the breakpoint value of AUC(0-24h)/MIC
308
The BP value of the PK/PD index was required to compute a dose (SF of equation
309
5); for both M. haemolytica and P. multocida geometric mean MIC values were 2.07
310
µg/mL (n = 6 per species) in MHB and 0.04 µg/mL (n = 6) in calf serum (Lees,
311
Illambas et al., 2016). For both matrices and both organisms, the in vitro time-kill data
312
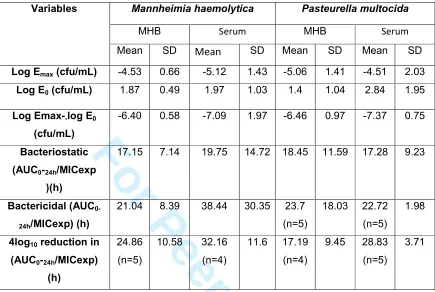
provided typical BP estimates of AUC(0-24h)/MIC required to produce, after 24 h
313
exposure, three levels of growth inhibition (Table 2). A strong bactericidal effect was
314
observed with a steep concentration-effect relationship. For both M.haemolytica and
315
P multocida AUC(0-24h)/MIC values providing a 3log10 reduction in count were
316
approximately 24 h in both serum and MHB. The same result expressed in term of
317
multiples of MIC was approximately 1 and we selected for the MCS an overall
318
average BP of 24 h for the PK/PD index (i.e. a SF equal to 1 in equation 5).
319
The reported AUC/MIC values (in h) are proportionality factors between the
320
experimental MIC (MICexp) and the average MHB or the average serum
321
tulathromycin concentration to achieve a bacteriostatic or a bactericidal effect e.g.
322
the AUC(0-24h)/MIC of 17.15 h providing a bacteriostatic effect in MHB indicates that
323
the corresponding average concentration over 24 h in MHB was
324
17.15h/24h=0.71times the MIC and that the bactericidal effect in serum was obtained
325
with a concentration of 38.44h/24h or 1.6 times the MIC.
326 327
For Peer Review
Population analysis
328
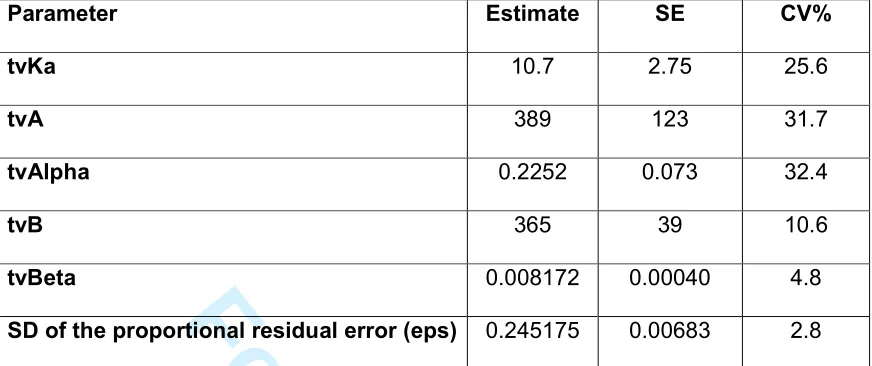
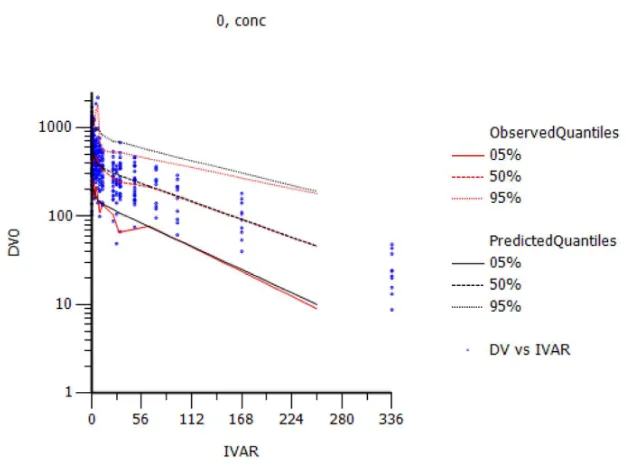
Figure 4 shows the Visual Predictive Check (VPC) i.e. the observed serum
329
concentration (ng/ml) vs. time (h) and observed and predicted quantiles; this is the
330
most useful diagnostic plot for the assessment of model adequacy. Typical values of
331
the primary structural parameters of the model (thetas), the secondary parameters
332
(AUC and half-life), their associated Standard Error (SE) and the SD of the residual
333
for the basic model are given in Table 3; for all calves, the tv of the terminal half-life
334
was 84.8 h (CV 4.8%) and the tv of the population AUC was 46,291 ng*h/mL (CV
335
11.5%) i.e. very similar values to those computed by the NCA with the 10 control
336
calves. The estimates of shrinkage were relatively small or moderate and provided
337
support for the reliability of the estimates of the random effects. Coefficient of
338
variation (CV%) of the variance of the etas expressing the BSV are given in Table 4.
339
They were relatively large for A, alpha and Ka and the inclusion in the model of the
340
covariate health status largely reduced these CV% (Table 4).
341
A and B (ng/mL) are intercepts and Ka, Alpha and Beta are slopes (1/h) with
342
Ka>alpha>beta. CV% was the standard error percentage calculated as 100* SE /
343
Parameter Value indicating the reliability of the model. Proportional residual error
344
was 24.5% and the epsilon shrinkage was 0.05375.
345
Fig.4
346 347
Using the basic structural model, the serum disposition curves (Individual Predicted
348
values based on individual ETAs) of 1,040 calves were simulated (serum
349
concentrations predicted from time 0 to 336 h with a step of 6 h). These 1,040
350
simulations were subjected to a NCA, and partial areas (from 0 to 24h, 0 to 48hWup
351
For Peer Review
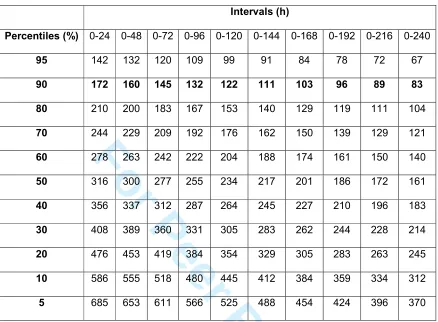
over these time intervals were calculated. Next, the corresponding quantiles (5 to
353
95%) were established (Table 5). These serum concentrations can be viewed as the
354
PK/PD cut-offs for these time intervals and for a selected TAR. For example, if the
355
claimed duration of tulathromycin activity is 240 h and if a TAR of 90% is expected,
356
the PK/PD cut-off is 83 ng/mL, indicating that for 90% of the calves it can be
357
guaranteed that the average serum concentration of tulathromycin will be at least 83
358
ng/mL over the first 10 days following tulathromycin administration at the nominal
359
dosage of 2.5mg/kg. As the ratio of MIC obtained in MHB:serum is approximately
360
50:1, the PK/PD cut-off for a TAR of 90% for an expected duration of activity of 240 h
361
is 4.15 µg/mL for MHB, a value lower than the current clinical breakpoint of CLSI (16
362
µg/mL) (Lees, Illambas et al., 2016) but consistent with EMEA opinion (Committee for
363
medicinal products for veterinary use (CVMP), 2003) (see Discussion).
364 365
Dosage computation
366
From the MCS, using parameters of the basic model, the corresponding 1,040
367
apparent serum clearance values were computed (Dose/AUC(0-inf)) with Dose = the
368
standard tulathromycin dose of 2.5mg/kg. The distribution of these 1,040 serum
369
clearances (L/kg/day) was right-skewed and this distribution was normalized by a log
370
transformation (log of the mean clearance of 0.287 and SD of 0.53252). The mean
371
clearance for the 10 days selected for solving equation 5 was 2.589 in the LN
372
domain.The distribution of MICs, after transformation by a scaling factor of 50 to take
373
into account the serum effect, is presented in Figure 5.
374
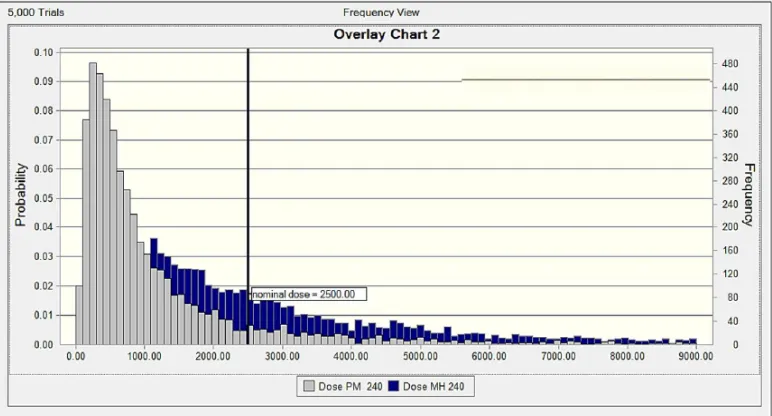
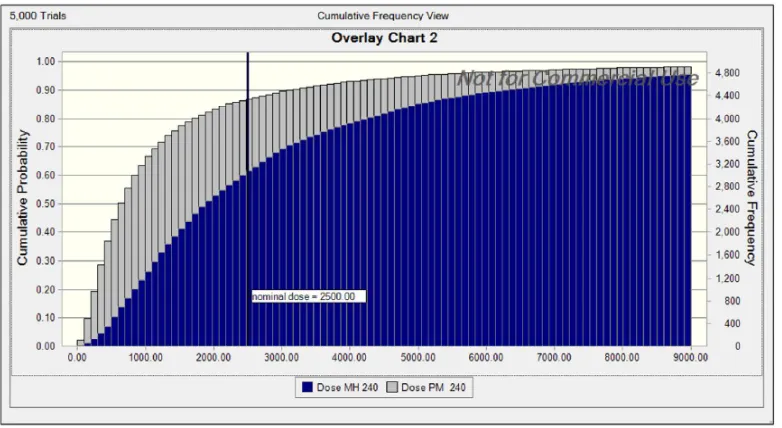
Figures 6 and 7 illustrate the non-cumulative and cumulative distributions of doses
375
for M. haemolytica and P. multocida, respectively. For a TAR of 90%, the computed
376
dose for M. haemolytica was 5.3mg/kg, indicating that, with this dose, the average
377
For Peer Review
serum concentration of tulathromycin over the first 240 h following administration of
378
this dose will be equal to the MIC of M. haemolytica in 90% of calves. For the
379
nominal dose of 2.5mg/kg, the corresponding TAR for M. haemolytica was 65.9%.
380
For a TAR of 90%, the computed dose for P. multocida was 2.52 mg/kg and for the
381
nominal dose of 2.50 mg/kg, the TAR was 87.2%.
382
Fig. 5
383
Fig 6
384
Fig. 7
385
To identify the main sources of variability amongst the factors controlling the dose
386
(plasma clearance, MICs or fu), a sensitivity analysis was performed to apportion
387
variability to these three factors. The main source of variability for P. multocida was
388
MIC (76.7%); the BSV of serum clearance was lower (23.0%) and the variability of fu
389
was negligible. For M. haemolytica, results were very similar with 70.3% of the
390
variability due to the MIC distribution and 29.2% to the BSV of clearance, indicating
391
that the data should be relevant for different cattle populations.
392 393
Discussion
394
The principal findings of the present study are that: (i) contrary to previous claims, the
395
dosage of tulathromycin can be documented using standard PK/PD concepts; (ii) the
396
recommended dose of tulathromycin (2.5mg/kg) is consistent with our calculated
397
population doses, with computed TARs of 66% and 87% for a 2.50 mg/kg dose for M.
398
haemolytica and P. multocida, respectively; (iii) tulathromycin did not accumulate in
399
For Peer Review
the PK/PD index i.e. the AUC(0-24h)/MIC was approximately 24 h, indicating that
401
tulathromycin has a potent bactericidal effect for a concentration approximately equal
402
to the MIC; (v) PK/PD cut-offs are consistent with the current BPs of AST issued by
403
the CLSI and EMA; and (vi) the main source of variability to take into account to
404
determine a dose for a given animal is of PD origin (MIC) and not the actual
405
tulathromycin exposure.
406 407
The aim of this study was to determine the adequacy (or not) of the currently
408
recommended dosage of tulathromycin (2.5mg/kg) for calves, by computing a
409
population dose covering a range of TARs i.e. the aim was to assess the ability of a
410
standard PK/PD model to determine a dose for tulathromycin for different
411
percentages (up to 95%) of the population. The present PK/PD approach clearly
412
indicated the therapeutic relevance of serum concentration; and the data further
413
suggest that other explanations for the efficacy of tulathromycin, including high local
414
intracellular pulmonary concentration or a specific transportation of the drug by
415
macrophages or neutrophils to the extracellular biophase in the lung (as discussed in
416
the Introduction) do not need to be invoked. The dose of tulathromycin was first (prior
417
to licensing) determined in field studies and was based primarily on clinical efficacy,
418
because it was considered that the clinical efficacy for this drug could not be derived
419
from a PK/PD relationship. The present data provide clear evidence that standard
420
PK/PD concepts would, in fact, have fully sufficed to derive an appropriate dosage for
421
tulathromycin. The crucial proviso, however, is that, for the PK/PD integration and
422
modelling approaches to be valid, MICs have to be determined in serum and not, as
423
is routine and almost universal, in an artificial medium such as MHB. We therefore
424
conclude that what should be questioned for macrolides is the utilization of in vitro
425
For Peer Review
MICs in a non-biological fluid such as MHB, when establishing PK/PD relationships
426
as a basis for dosage determination.
427
The main limitation to our computations is the selected value of the SF used to
428
transform MICs derived from the epidemiological survey and obtained in broth, into
429
equivalent MICs in serum. A factor of 50 was used, based on broth:serum MIC ratios
430
for tulathromycin reported in our previous paper (Lees, Illambas et al., 2016). This
431
revealed a very large serum effect on the potency of tulathromycin, as had been
432
previously reported by others (Godinho, Keane et al., 2005). For example, Godhino
433
et al (Godinho, 2008) obtained a lower broth:serum MIC ratio (up to 16) but in the
434
presence of only 40% bovine serum (rather than the 100% serum used in the present
435
study).
436
As the ratio MHB:serum MIC is approximately 50, the PK/PD cut-off (in MHB) for a
437
TAR of 90% for an expected duration of activity of 240 h is 4.15 µg/mL, a value
438
almost four times lower than the current clinical BP of the CLSI (16 µg/mL) but more
439
consistent with the EMA/CVMP BP of ≤ 8 µg/mL (Committee for medicinal products for
440
veterinary use (CVMP), 2003) supporting the validity of our PK/PD approach.
441
The second possible limitation of our computations is the limited number of animals
442
that were considered in the population analysis (n=26) with the possibility of having
443
excluded some relevant variability factors (for example breed of animal).
444
Nevertheless, we are confident in the overall conclusions, because the sensitivity
445
analysis showed clearly that the impact of the PK variability is minimal in comparison
446
with that of PD origin (the epidemiological MICs). Moreover, our population model
447
included both healthy and diseased animals and it was previously reported that there
448
were no statistically significant differences in tulathromycin PK between pre-ruminant
449
For Peer Review
2003). It is concluded that our PK population model was sufficiently robust for the
451
purpose of deriving PK/PD cut-offs and population dose distributions.
452
For single dose administration of a long acting formulation, computation of a dose
453
using a PK/PD approach requires estimation of the duration of action. To the best of
454
our knowledge, this duration has not been experimentally determined for cattle.
455
However, in pigs duration of effectiveness of tulathromycin was determined in a
456
pulmonary–disease challenge model, using Actinobacillus pleuropneumoniae by
457
administering a single dose of tulathromycin from 11 to 3 days before the challenge
458
(Waag, Bradford et al., 2008). These authors concluded that a single dose of
459
tulathromycin provides up to 9 days of protection against death and severe morbidity.
460
For the calves used in this study, we define a priori the activity period as that for
461
which the average serum concentration of tulathromycin was lower than the
462
EMA/CVMP BP of 8 µg/mL in MHB (equivalent to 160 ng/mL in serum). The MCSs
463
indicated that the average concentration over the first 10 days following a dose of 2.5
464
mg/kg was 184 ng/mL and this duration was selected to explore the population dose
465
distribution, although any other duration could be investigated using this approach.
466
Computation of a PK/PD dose also requires selection of an appropriate PK/PD index
467
and determination of its BP value. From the rate and extent of killing of M.
468
haemolytica and P. multocida by tulathromycin in time-kill studies, the actions were
469
judged to be, for the former, concentration-dependent in MHB and co-dependent in
470
serum and, for the latter, co-dependent in both matrices (Lees, Illambas et al., 2016).
471
Therefore, for both bacterial species, the use of AUC/MIC as a PK/PD surrogate
472
for/predictor of efficacy is justified (Thomas, Forrest et al., 1998; Schentag, 2000;
473
Evans, 2005).It should be noted that the time-kill studies were conducted with initial
474
inoculum counts of the order of 106 to 107 cfu/mL i.e. for an inoculum size likely to be
475
For Peer Review
relatively high when considering a natural infection; according to Roof (ROOF, 2011)
476
the total CFU of pathogens in the entire lung for cattle with identified pathogens
477
ranged from 2x10⁷ – 2x10⁸ CFU for P.multocida and 9x10⁶ – 9x10⁸ CFU for M.
478
haemolytica, indicating that our time-kill curves were indeed obtained with a an
479
appropriate inoculum size, regarding a natural infection. However, for
480
metaphylaxis/control conditions, for which a lower pathogen load is expected, lower
481
concentrations of tulathromycin in the biophase are likely to be required, thus
482
indicating that our results are conservative enough to cover all infectious conditions.
483
The present findings confirm, in part, previous publications on the PK of
484
tulathromycin (Nowakowski, Inskeep et al., 2004; Evans, 2005). After subcutaneous
485
dosing, a terminal half-life of 90 h was reported by these authors, and in this study
486
half-life was 84 h. However, corresponding AUC(0-last) values were 16.0 µg.h/mL
487
[1,33] and 45.1 µg.h/mL [this study], where AUC(0-last) was measured over similar
488
times. The causes of these differences are unknown. Our data further extends the
489
results of earlier workers, by establishing the distribution of tulathromycin into
490
extravascular fluids (exudate and transudate) in a tissue cage model. This model
491
provides a means of sampling inflammatory exudate to allow comparison of the time
492
course and magnitude of drug penetration into an inflamed (exudate), a non-inflamed
493
(transudate) fluid and in serum (Higgins, Lees et al., 1984; Sidhu, Shojaee Aliabadi et
494
al., 2003). Exudate concentrations were always lower than serum concentration,
495
indicating that there was no specific accumulation of this drug in an inflammatory
496
biophase, as advocated by those assuming a special delivery of tulathromycin in
497
inflammatory fluid by accumulation of macrophages or neutrophils.
498 499
For Peer Review
Conclusions
500
Based on PK/PD modelling, the present study predicts, that the current marketed
501
dose of tulathromycin is appropriate and that serum concentrations achieved with this
502
dosage is biologically and clinically relevant. Recourse to consideration of the high
503
concentration of tulathromycin in lung homogenate or to a specific transport of the
504
drug by leucocytes into the biophase is not necessary, and this conclusion
505
recognizes that the relevant matrix to estimate MIC is serum.
506 507
For Peer Review
Conflict of interest statement
P Lees has acted as a consultant to Pfizer Animal Health. He has not consulted ever
for Zoetis, only the predecessor company Pfizer on another drug. L. Pelligand has
received funding from Zoetis Ltd for non-related studies on maropitant in the dog.
None of the other authors has a financial or personal relationship with other people or
organizations that could inappropriately influence or bias the contents of the paper.
This does not alter our adherence to PLOS ONE policies on sharing data and
materials.
Acknowledgements
Tulathromycin was kindly supplied by Pfizer Animal Health Ltd.
References
Aliabadi, F.S. & Lees, P. (2001) Pharmacokinetics and pharmacodynamics of danofloxacin in serum and tissue fluids of goats following intravenous and intramuscular administration. American Journal of Veterinary Research, 62(12), 1979-1989.
Anonymous (2005). Freedom information summary. Original new animal drug application. Draxxin injectable solution (Tulathromycin). In Freedom information summary. Original new animal drug application. Draxxin injectable solution (Tulathromycin) Ed Administration, F.a.D. pp. 1-57. PFIZER.
Bosnar, M., Kelneric, Z., Munic, V., Erakovic, V. & Parnham, M.J. (2005) Cellular uptake and efflux of azithromycin, erythromycin, clarithromycin, telithromycin, and cethromycin. Antimicrobial Agents and Chemotherapy, 49(6), 2372-2377.
Committee for medicinal products for human use (CHMP) (2011). Guideline on
bioanalytical method validation. In Guideline on bioanalytical method
For Peer Review
Committee for medicinal products for veterinary use (CVMP) (2003). Scientific discussion -
Draxxin. In Scientific discussion - Draxxin pp. 1-31. European Medicines Agency, London.
Evans, N.A. (2005) Tulathromycin: an overview of a new triamilide antibiotic for livestock respiratory disease. Veterinary therapeutics : research in applied veterinary medicine, 6(2), 83-95.
Gladue, R.P., Bright, G.M., Isaacson, R.E. & Newborg, M.F. (1989) In vitro and in vivo uptake of azithromycin (CP-62,993) by phagocytic cells: possible mechanism of delivery and release at sites of infection. Antimicrobial Agents and Chemotherapy, 33(3), 277-282.
Godinho, K.S. (2008) Susceptibility testing of tulathromycin: interpretative breakpoints and susceptibility of field isolates. Veterinary Microbiology, 129 (3-4), 426-432.
Godinho, K.S., Keane, S.G., Nanjiani, I.A., Benchaoui, H.A., Sunderland, S.J., Jones, M.A., Weatherley, A.J., Gootz, T.D. & Rowan, T.G. (2005) Minimum inhibitory concentrations of tulathromycin against respiratory bacterial pathogens isolated from clinical cases in European cattle and swine and variability arising from changes in in vitro methodology. Veterinary therapeutics : research in applied veterinary medicine, 6(2), 113-121.
Higgins, A.J., Lees, P. & Wright, J.A. (1984) Tissue-cage model for the collection of inflammatory exudate in ponies. Res Vet Sci, 36(3), 284-289.
Huang, R.A., Letendre, L.T., Banav, N., Fischer, J. & Somerville, B. (2010) Pharmacokinetics of gamithromycin in cattle with comparison of plasma and lung tissue concentrations and plasma antibacterial activity. Journal of Veterinary Pharmacology and Therapeutics, 33(3), 227-237.
Karlsson, M.O. & Savic, R.M. (2007) Diagnosing model diagnostics. Clinical Pharmacoly and Therapeutics, 82(1), 17-20.
Kiem, S. & Schentag, J.J. (2008) Interpretation of antibiotic concentration ratios measured in epithelial lining fluid. Antimicrobial Agents and Chemotherapy, 52(1), 24-36.
Lees, P., Illambas, J., Potter, T., Pelligand, L., Rycroft, A. & Toutain, P.L. (2016) What is the true in vitro potency and efficacy of tulathromycin against
Mannheimia haemolytica and Pasteurella multocida ? Journal of Veterinary Pharmacology and Therapeutics, submitted.
Lees, P., Shojaee Aliabadi, F. & Toutain, P.L. (2004) PK-PD modelling:an alternative to dose titration studies for antimicrobial drug dosage selection. The Regulatory Affairs Journal Pharma, 15(3), 175-180.
Mandell, G.L. & Coleman, E. (2001) Uptake, transport, and delivery of antimicrobial agents by human polymorphonuclear neutrophils. Antimicrobial Agents and Chemotherapy, 45(6), 1794-1798.
Menge, M., Rose, M., Bohland, C., Zschiesche, E., Kilp, S., Metz, W., Allan, M., Ropke, R. & Nurnberger, M. (2012) Pharmacokinetics of tildipirosin in bovine plasma, lung tissue, and bronchial fluid (from live, nonanesthetized cattle).
Journal of Veterinary Pharmacology and Therapeutics, 35(6), 550-559.
Mouton, J.W., Theuretzbacher, U., Craig, W.A., Tulkens, P.M., Derendorf, H. & Cars, O. (2008) Tissue concentrations: do we ever learn? Journal of Antimicrobial Chemotherapy, 61(2), 235-237.
Muller, M., dela Pena, A. & Derendorf, H. (2004) Issues in pharmacokinetics and pharmacodynamics of anti-infective agents: distribution in tissue. Antimicrobial Agents and Chemotherapy, 48(5), 1441-1453.
For Peer Review
Nowakowski, M.A., Inskeep, P.B., Risk, J.E., Skogerboe, T.L., Benchaoui, H.A., Meinert, T.R., Sherington, J. & Sunderland, S.J. (2004) Pharmacokinetics and lung tissue concentrations of tulathromycin, a new triamilide antibiotic, in cattle. Veterinary therapeutics : research in applied veterinary medicine, 5(1), 60-74.
ROOF, C. (2011). Qualification and quantification of bacterial pathogen load in acute bovine respiratory disease cases In Qualification and quantification of bacterial pathogen load in acute bovine respiratory disease cases Kansas State University, Manhattan, Kansas.
Sarasola, P., Jernigan, A.D., Walker, D.K., Castledine, J., Smith, D.G. & Rowan, T.G. (2002) Pharmacokinetics of selamectin following intravenous, oral and topical administration in cats and dogs. Journal of Veterinary Pharmacology and Therapeutics, 25(4), 265-272.
Schentag, J.J. (2000) Clinical pharmacology of the fluoroquinolones: studies in human dynamic/kinetic models. Clinical Infectious Diseases, 31 Suppl 2, S40-44.
Scheuch, E., Spieker, J., Venner, M. & Siegmund, W. (2007) Quantitative determination of the macrolide antibiotic tulathromycin in plasma and broncho-alveolar cells of foals using tandem mass spectrometry. Journal of chromatography. B, Analytical technologies in the biomedical and life sciences, 850(1-2), 464-470.
Scorneaux, B. & Shryock, T.R. (1998) Intracellular accumulation, subcellular distribution and efflux of tilmicosin in swine phagocytes. Journal of Veterinary Pharmacology and Therapeutics, 21(4), 257-268.
Scorneaux, B. & Shryock, T.R. (1999) Intracellular accumulation, subcellular distribution, and efflux of tilmicosin in bovine mammary, blood, and lung cells.
Journal of Dairy Science, 82(6), 1202-1212.
Sidhu, P., Shojaee Aliabadi, F., Andrews, M. & Lees, P. (2003) Tissue chamber model of acute inflammation in farm animal species. Res Vet Sci, 74(1), 67-77.
Thomas, J.K., Forrest, A., Bhavnani, S.M., Hyatt, J.M., Cheng, A., Ballow, C.H. & Schentag, J.J. (1998) Pharmacodynamic evaluation of factors associated with the development of bacterial resistance in acutely ill patients during therapy.
Antimicrobial Agents and Chemotherapy, 42(3), 521-527.
Toutain, P.L. (2009). PK/PD approach for antibiotics: tissue or blood drug levels to predict antibiotic efficacy. In PK/PD approach for antibiotics: tissue or blood drug levels to predict antibiotic efficacy Eds Riviere, J.E. & Fink Gremmels, J. pp. 19-21. Journal of Veterinary Pharmacology and Therapeutics, Leipzig, Germany.
Toutain, P.L., Bousquet-Melou, A. & Martinez, M. (2007) AUC/MIC: a PK/PD index for antibiotics with a time dimension or simply a dimensionless scoring factor?
Journal of Antimicrobial Chemotherapy, 60(6), 1185-1188.
Toutain, P.L., del Castillo, J.R.E. & Bousquet-Mélou, A. (2002) The pharmacokinetic-pharmacodynamic approach to a rational dosage regimen for antibiotics.
Research in Veterinary Science, 73(2), 105-114.
Toutain, P.L. & Lees, P. (2004) Integration and modelling of pharmacokinetic and pharmacodynamic data to optimize dosage regimens in veterinary medicine.
Journal of Veterinary Pharmacology and Therapeutics, 27(6), 467-477.
Villarino, N., Brown, S.A. & Martin-Jimenez, T. (2013) The role of the macrolide
For Peer Review
Villarino, N., Brown, S.A. & Martin-Jimenez, T. (2014) Understanding the pharmacokinetics of tulathromycin: a pulmonary perspective. Journal of Veterinary Pharmacology and Therapeutics, 37(3), 211-221.
Villarino, N., Lesman, S., Fielder, A., Garcia-Tapia, D., Cox, S., Lucas, M., Robinson, J., Brown, S.A. & Martin-Jimenez, T. (2013) Pulmonary pharmacokinetics of tulathromycin in swine. Part 2: Intra-airways compartments. Journal of Veterinary Pharmacology and Therapeutics, 36(4), 340-349.
Villarino, N., Lesman, S., Fielder, A., Garcia-Tapia, D., Cox, S., Lucas, M., Robinson, J., Brown, S.A. & Martin-Jimenez, T. (2013) Pulmonary pharmacokinetics of tulathromycin in swine. Part I: Lung homogenate in healthy pigs and pigs challenged intratracheally with lipopolysaccharide of Escherichia coli. Journal of Veterinary Pharmacology and Therapeutics, 36(4), 329-339.
Waag, T.A., Bradford, J.R., Lucas, M.J., Rooney, K.A., Nutsch, R.G., Lechtenberg, K.F. & Smothers, C.D. (2008) Duration of effectiveness of tulathromycin injectable solution in an Actino bacillus pleuropneumoniae respiratory-disease challenge model in swine. Journal of Swine Health and Production, 16(3), 126-130.
For Peer Review
Table 1. Pharmacokinetic variables for tulathromycin in serum, exudate and
transudate in calves
Variable (units) Serum Exudate Transudate
Mean SEM Mean SEM Mean SEM
Cmax (µg/mL) 0.75 0.11 0.24 0.016 0.12 0.016
Tmax (h)* 2.20 1.18 19.7 2.89 18.0 3.69
T½ (h)** 84.0 3.61 123.3 10.33 92.1 9.36
AUC(0-last) (µg.h/mL) 45.1 5.84 18.4 1.99 8.58 0.85
AUC(0-∞) (µg.h/mL) 47.9 6.31 20.0 2.24 9.50 0.89
MRT(0-last) (h) 91.4 2.88 87.2 3.54 83.6 6.39
CI/F (mL/kg/h) 52.1 7.51 - - - -
Geometric mean unless stated and SEM (n=10) *Arithmetic mean; **Harmonic mean.
Tmax: Time following dosing at which the maximum concentration (Cmax) occurred.
T½: Terminal Half-life
AUC(0-last): Area under the concentration-time graph from 0 to the last sampling time
AUC(0-∞): Area under the concentration-time graph from 0 to infinity
MRT: Mean residence time
CI/F: Clearance scaled by bioavailability
For Peer Review
Table 2. Results obtained from the killing curve assay.
Variables Mannheimia haemolytica Pasteurella multocida
MHB Serum MHB Serum
Mean SD Mean SD Mean SD Mean SD
Log Emax (cfu/mL) -4.53 0.66 -5.12 1.43 -5.06 1.41 -4.51 2.03
Log E0 (cfu/mL) 1.87 0.49 1.97 1.03 1.4 1.04 2.84 1.95
Log Emax--log E0
(cfu/mL)
-6.40 0.58 -7.09 1.97 -6.46 0.97 -7.37 0.75
Bacteriostatic (AUC0-24h/MICexp
)(h)
17.15 7.14 19.75 14.72 18.45 11.59 17.28 9.23
Bactericidal (AUC
0-24h/MICexp) (h)
21.04 8.39 38.44 30.35 23.7
(n=5)
18.03 22.72
(n=5)
1.98
4log10 reduction in
(AUC0-24h/MICexp)
(h)
24.86
(n=5)
10.58 32.16
(n=4)
11.6 17.19
(n=4)
9.45 28.83
(n=5)
3.71
Data (mean, SD, n=6 unless stated) for three levels of growth inhibition of M.
haemolytica and P. multocida by tulathromycin in Mueller Hinton broth (MHB) and
serum.
For Peer Review
Table 3. Population parameters for tulathromycin disposition in calves.
Parameter Estimate SE CV%
tvKa 10.7 2.75 25.6
tvA 389 123 31.7
tvAlpha 0.2252 0.073 32.4
tvB 365 39 10.6
tvBeta 0.008172 0.00040 4.8
SD of the proportional residual error (eps) 0.245175 0.00683 2.8
Typical values (tv) of the structural parameters of the population model (thetas), their
associated Standard Error (SE) and Coefficient of Variation (CV%) and the SD of the
residual for the model.
For Peer Review
Table 4. Between Subject Variability (BSV) of tulathromycin disposition in
calves.
ETA ηKa ηA ηAlpha ηB ηBeta
No covariate 129 344 224 53 8
With the health status as covariate 109 154 122 52 7.8
Coefficient of variation (CV%) of the variance of the etas (η) indicating the magnitude
of the BSV for the model without covariate and model with the health status as
covariate
For Peer Review
Table 5. PK/PD cut-offs for tulathromycin in calves.
Intervals (h)
Percentiles (%) 0-24 0-48 0-72 0-96 0-120 0-144 0-168 0-192 0-216 0-240
95 142 132 120 109 99 91 84 78 72 67
90 172 160 145 132 122 111 103 96 89 83
80 210 200 183 167 153 140 129 119 111 104
70 244 229 209 192 176 162 150 139 129 121
60 278 263 242 222 204 188 174 161 150 140
50 316 300 277 255 234 217 201 186 172 161
40 356 337 312 287 264 245 227 210 196 183
30 408 389 360 331 305 283 262 244 228 214
20 476 453 419 384 354 329 305 283 263 245
10 586 555 518 480 445 412 384 359 334 312
5 685 653 611 566 525 488 454 424 396 370
These values are the average serum concentrations (ng/mL) of tulathromycin over 10
incremental time intervals (0-24h, 0-48hW.0-240h) that are at least achieved by a
given percentage of the calf population (Target Attainment Rate from 5 to 95%) after
a single subcutaneous administration of tulathromycin at a dose rate of 2.5 mg/kg.
These values should be multiplied by 50 to give the equivalent PK/PD cut-offs in
MHB. For example, for 90% TAR and a duration of 0-240 h serum concentration =
4,150 ng/mL and for 50% TAR and a time interval of 0-120 h serum concentration =
11,700 ng/mL.
For Peer Review
Fig.1. Flow chart of the main steps of sample collection, data analysis and
results outputs for the PK/PD analysis of tulathromycin in calves.
For Peer Review
Fig. 2. Tulathromycin concentration in serum over the first 12 h after subcutaneous
administration of tulathromycin in calves. Mean + SEM tulathromycin concentration in
serum from 0 to 12 h after subcutaneous injection of tulathromycin at a dose rate of
2.5mg/kg.
For Peer Review
Fig.3. Tulathromycin concentrations in serum, exudate and transudate over 336 h after
subcutaneous administration of tulathromycin in calves. Mean + SEM tulathromycin
concentrations in serum, exudate and transudate for calves after subcutaneous injection of
tulathromycin at a dose rate of 2.5mg/kg.
For Peer Review
Fig. 4: Visual Predictive Check: Observed plasma concentration (ng/ml) vs. time (h)
and observed and predicted quantiles. This diagnostic plot illustrates the observed (red) 5,
50 and 95% quantiles superimposed with the predictive check quantiles (black) 5, 50 and
95% over the observed serum concentrations (blue symbols).
For Peer Review
Fig. 5. MIC distribution of M. haemolytica and P. multocida. Frequency of Minimum
Inhibitory Concentrations (MICs) for tulathromycin against bovine respiratory pathogens P.
multocida (n=2483) and M. haemolytica (n=2233). The isolates were from the Zoetis
surveillance program and were isolated from years 2004 to 2010. MICs (µg/mL) were
obtained in Mueller Hinton Broth; results are given for only susceptible strains according to
the CLSI clinical breakpoint (MICs ≤ 16µg/mL)
For Peer Review
Fig. 6. Population distributions of tulathromycin doses. Comparison of the two
population distributions of tulathromycin doses, as predicted by a population PK/PD model
for P. multocida (grey) and M. haemolytica (blue) for duration of action of 240 h. The vertical
bar indicates the nominal dose of 2.5 mg/kg. Dose (0 to 9000 µg/kg) is indicated on the X
axis.
For Peer Review
Fig. 7. Cumulative population distributions of tulathromycin doses. Comparison of the
two cumulative distributions of doses of tulathromycin, as predicted by a population PK/PD
model for P. multocida (grey) and M. haemolytica (blue) for a duration of action of 240 h in
terms of Target Attainment Rate (Y axis: 0-100%). The vertical bar indicates the nominal
dose of 2.5 mg/kg. Dose (0 to 9000 µg/kg) is indicated on the X axis.