Design And Development Of A Fire Evacuation
System Using Fuzzy Logic Control
Allie B. Villanueva, Ralph Sherwin A. Corpuz
Abstract: Fires are among the worst disasters that can happen anywhere, anytime, and to anyone, for so many reasons. The risks are even higher for highly-congested areas and public buildings where evacuation schemes are not effectively planned and implemented. There is a wide-range of fire-sensing technologies available in the market to prevent fire incidents, however, the extent of flexibility and reliability of these devices are still subject for further improvements. This paper presents the design and development of a Fire Evacuation System (FES) using Mamdani-type Fuzzy Logic Control (FLC) with the main intent to improve responsiveness and reliability of fire detection. The authors compared two types of smoke sensors then interfaced with a microcontroller unit, relay drivers, Light Emitting Diodes (LED) indicators, and other system peripherals to simulate the existence of smoke and to indicate the evacuation map. The authors further implemented the FLC rules using C programming language in an Arduino Integrated Development Environment (IDE). Testing results revealed that there is no significant difference on the responsiveness of the two smoke sensors with independent T-test value of t (26.131) = -0.026 and p = 0.979. Likewise, T-test results further proved that there is no significant difference on the reliability performance of the smoke sensors and LED indicators with dependent T-test value of tA_ON (19) = -0.847; pA_ON = 0.408; tA_OFF (19) = 0.678; pA_OFF = 0.506; tB_ON (19) =
-0.764; pB_ON = 0.454; tB_OFF (19) =1.212; pB_OFF = 0.240 in activated and deactivated modes, respectively. These results confirmed that the prototype is
responsive and reliable, and the use of FLC is effective for the design and development of fire evacuation systems.
Index Terms: Fuzzy Logic Control, fire evacuation map, microcontroller applications, Mamdani FLC, fire management system
————————————————————
1
INTRODUCTION
Fires are among the hazardous incidents that can happen to any people, properties, or location. Ineffective interventions on fires can result to significant damages, injuries, and even deaths [1]. In the Philippines, fires usually happen in highly-densed areas, such as Metro Manila, in which the most common root-causes are attributed to faulty electrical connections, lit cigarette butts, and open flames from unattended stoves [2]. According to the Bureau of Fire Protection, there are 72,318 recorded incidents; 4,091 injuries; 1,203 deaths; and PhP 18.8 billion estimated damages for the year 2012-2016 alone [3]. Trends show that there is an increasing rate of fire incidents in the country year after year, which causes an alarm among authorities and common people alike. Despite being potentially disastrous to humanity and to the community, fires are also controllable to certain extents, hence, the implementation of preventive programs, activities and methodologies, such as evacuation plans and drills, are helpful for people to avoid the risks and other emergencies [4]. Similarly, the utilization of various fire-fighting facilities also have positive impacts in managing fires for household, work, or public use. Today, there is a wide range of commercially-available sensors used for fire detection. These sensors can be categorized in terms of their capability to detect levels of temperature, humidity, carbon monoxide, smoke, Liquified Petrolium Gas (LPG), etc. [5]. These sensors are found to be effective for specific applications, can work as stand-alone units, or can also be integrated with existing fire alarm systems [6], wireless multiple sensors [7], GSM networks [8], multi-thread embedded systems [9], etc. In designing the frameworks of these technologies, Artificial Intelligence (AI) is one of the most recently-explored approaches for fire management purposes [6].
The common AI techniques used are neural networks [10], image processing [11], fuzzy logic control [12], support vector machines [13], Internet of Things (IOT) [6], etc. While each technique has its own strengths and weaknesses, the most common issues still persist due to the verity of certain factors, such as the uncertainty of fire system structures, mutation of fire sources, inefficiency of existing controls, and the nature of working conditions. Particularly, these issues are more prevalent in public organizations or buildings, such as state universities, which have larger internal area and population size, more complex channel setting and structure design, overloaded electrical system, and inefficient evacuation schemes, thus resulting to higher risks of fires and emergencies [6]. With the above-mentioned AI techniques, Fuzzy Logic Control (FLC) is one of the most popular approaches studied extensively for fire management purposes [14], [15], [16], [17]. FLC is a mathematical tool used to handle logic of imprecision, analogous to the capabilities of the human brain [15, 18]. Shown on Fig. 1 is the FLC process model, which has five basic sub-processes, namely: fuzzification, application of fuzzy operations, implication, aggregation, and defuzzification. In FLC, the inputs and outputs are initially fuzzified or modelled into membership functions then eventually applied with logical operators whether to intersect (AND) or disjoint (OR). Afterwards, the resulting fuzzy sets are subjected to implication method where a rule-based system of ―if-then-algorithms‖ are created. These fuzzy sets are then further aggregated and deffuzified in order to extract the most logical output for specific application [18], [19], [20].
______________________________________
• Allie B. Villanueva, Assistant Professor, Electronics Engineering Technology Department, Technological University of the Philippines, Manila, Philippines. E-mail: [email protected]
2097 While FLC is considered as one of the top choices in
designing and developing fire-related systems due to its simplicity, flexibility, and robustness in modelling imperfect signals, the identified fire-related issues still remain unanswered, hence, the directions of research should focus more in finding interventions and solutions on these issues. This paper presents the utilization of FLC in designing a framework toward the development of a fire evacuation map. It intends to explore a potential method of improving flexibility and responsiveness of sensors, and to ensure reliability of fire detection and evacuation plan.
2
METHODOLOGY
2.1 Fuzzy Logic Control Model
Through Matlab computing software, the authors designed the control system of the Fire Evacuation System (FES) using a Mamdani-type Fuzzy Logic Control (FLC). Shown on Fig. 2 is the FLC model with 4 input sensors and 4 output LED indicators.
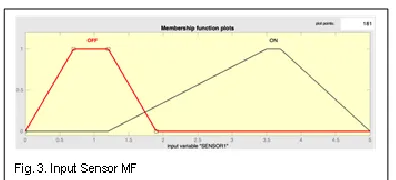
Congruent with the FLC process, the authors initially fuzzified the input and output variables through a Membership Function (MF). The following Table 1 and Fig. 3 show the MF characterization of the 4 input sensors, which operate in deactivated (OFF) or activated (ON) modes with ideal voltage threshold of 0.7-1.2v and 3.5-3.7v, respectively. In the model, the MF
of these input sensors were mapped out using trapezoidal curve (trapmf) with parameters of ―[0 0.7 1.2 1.9]‖ during OFF and ―[1.2 3.5 3.7 5]‖ during ON modes.
Meanwhile, the following Table 2 and Fig. 4 elaborate the MF characterization of the 4 output LED indicators. Similarly, the output variables operate at 0.7-1.2v and 3.5-2.v ideal voltage threshold for OFF and ON modes, respectively. Each MF was modelled using triangular curve
(trimf) with working parameters of ―[0 0.95 1.9]‖ for the OFF mode and ―[1.2 3.6 5]‖ for the ON mode.
After the fuzzification, the authors then defined the relationship of input variables through logic operations, then applied implication method using rule-based algorithm, also known as fuzzy rules. These requirements were implemented through the use of a Truth Table and FLC Rules. Listed on Table 3 is the Truth Table of the FES, which explains the intersectional (AND) relationship between input sensors and output LED indicators. In here, a logic value of 1 means that the ideal voltage threshold is measured approximately at 3.5-3.7v (maximum of 5v) while a logic value of 0 means an ideal threshold of 0.7-
1.2v. Meanwhile, the following Fig. 5 shows the generated 16 FLC Rules, which are algorithms that control the relationship between the inputs and output variables. Each rule has a pair of an antecedent (―if‖) and a consequent (―then‖) with a total
TABLE1
INPUT MEMBERSHIP FUNCTION
Sensor Deactivated (OFF) Activated (ON) Type Parameters 1, 2, 3,
4 0.7-1.2 v 3.5-3.7v trapmf
OFF – [0 0.7 1.2 1.9] ON - [1.2 3.5 3.7 5]
TABLE2
OUTPUT MEMBERSHIP FUNCTION
LED
Indicator Deactivated (OFF) Activated (ON) Type Parameters 1, 2, 3,
4
0.7-1.2v 3.5-3.7 Trimf OFF – [0 0.95 1.9] ON - [1.2 3.6 5]
TABLE3
TRUTH TABLE
Sensor1 Sensor2 Sensor3 Sensor4 LED1 LED2 LED3 LED4
0 0 0 0 0 0 0 0
1 0 0 0 1 0 0 0
0 1 0 0 0 1 0 0
1 1 0 0 1 1 0 0
0 0 1 0 0 0 1 0
1 0 1 0 1 0 1 0
0 1 1 0 0 1 1 0
1 1 1 0 1 1 1 0
0 0 0 1 0 0 0 1
1 0 0 1 1 0 0 1
0 1 0 1 0 1 0 1
1 1 0 1 1 1 0 1
0 0 1 1 0 0 1 1
1 0 1 1 1 0 1 1
0 1 1 1 0 1 1 1
weight of ―1‖. These FLC rules are consistent with the characterization of the Truth Table
The results of the FLC Rules were then further simulated by the authors using FLC Rule Viewer, which illustrates the fourth and fifth FLC processes of aggregation and deffuzification methods. Shown on Fig. 6 is a sample simulation result where, for this particular example, Sensor 1, 2, 3, and 4 detect input signals at 3.46, 3.32, 3.51, and 3.12v respectively. Consequently, the LED indicator 1, 2, 3, and 4 are estimated at 3.26v each. This means that while all sensors are activated, then all LED indicators are also activated.
Another tool used by the authors to ensure the validity of the FLC model is the use of the Surface Viewer, a 3D graphical user interface, which maps out the relationship between 2 inputs and 1 output, one projection at a time. Depicted on Fig. 7 is a sample surface view simulation where Sensor 3, Sensor 4, and LED 1 are all activated while Sensor 2, 1, and LED 1, 2, and 3 are deactivated.
2.2 Prototype Development
After the FLC modelling, the authors then designed and developed the prototype of the FES, which was made of various hardware and software components. Shown on Fig. 8 is the conceptual model used as reference in the development of the hardware components with 4 input sensors, specifically
2 types of smoke sensors, 4 output LED indicators and system peripherals such as the evacuation map, relay drivers, voltage regulator integrated circuit, and connecting wires or
cables. Illustrated on Fig. 9 is the front panel of the FES evacuation map. It shows a floor plan of a test environment with boxes labeled 401 to 430, signifying the room numbers based on the actual floor plan of a sampled State University in Manila, Philippines. It also has 4 black rectangle panels, which are made of LED arrays. Each LED indicator displays ―✓‖ which means ―passable‖ if no sensor is activated, while ―X‖ which means ―not passable‖ if a sensor is activated in a particular area of the floor plan.
Illustrated on Fig. 10 is the back panel of the FES. It houses the hardware components of the system which include the (A) Arduino Atmega328 microcontroller unit, which serves as the FLC of the system; (B) terminal blocks as connection slots for the input sensors (1, 2, 3, and 4); (C) LM7805 IC to regulate voltage fluctuations; (D) relay drivers to stabilize the output LED indicators; and (E) the LED indicator panels (LED 1, 2, 3 and 4) to indicate the evacuation route.
2099 In order to simulate the existence of fire, the authors utilized 2
types of smoke sensors, named as Sensors A and Sensors B, which are readily-available via online shopping. As illustrated on Fig. 11, smoke sensors A (Code: OEM ASIC) and B (Code: SS-168) are both general-purpose smoke detectors, which use photoelectric technology by detecting the presence of smoke or combustion particles in the air rather than heat, flame or gas through infrared diodes. Both produce digital outputs of 1 (~3-5v, 20mA) once activated; operate with 9v supply voltage; and sound an alarm once a smoke is detected. Specifically, the authors used 4 pieces, named as Sensor 1, 2, 3, and 4 sequences, for each set of Sensors A and B and simulated them to test their responsiveness and compatibility with the FLC model.
After the development of the prototype, the FLC was implemented further using C programming language in an Arduino Integrated Development Environment (IDE). The final program has been downloaded to the Arduino microcontroller unit as hex file through serial communication interface. Shown on Fig. 12 is a screenshot of the sample algorithm, which is compatible with the Arduino IDE, as used in the prototype.
2.3 Testing Methodology
In this paper, the authors utilized two types of testing methodologies in order to realize its objectives through the following null hypotheses:
H01 = there is no significant difference on the responsiveness of the two types of smoke sensors.
H02 = there is no significant difference on the reliability of the system based on the accuracy of the smoke sensors and the LED indicators.
For the first hypothesis, the authors simulated the FES by comparing the response time of Sensors A and Sensors B, where each sensor 1, 2, 3 and 4 sequence was activated through smoke. With 5 trials per sensor, the H01 was tested using independent samples T-test analysis (unequal variances) with the following equation:
𝑡 = ̅ ̅ √(
)
(1)
Where ―H01‖ is the first null hypothesis; ―x̅1‖ is the population mean of Sensors A; ―x̅2‖ is the population mean of Sensors B; ―n1‖ is the sample size (number of observations) of Sensors A; ―n2‖ is the sample size (number of observations) of Sensors B; ―s1‖ is the standard deviation of Sensors A; and ―s2‖ is the standard deviation of the Sensors B. The calculated t value is then compared with critical t value distribution table with degrees of freedom ―df‖ computed as:
𝑑𝑓 = (
)
(2)
H02:μ1=μ2 (3)
𝑡 = ̅
̅ (4)
𝑆𝑥̅ =
√ (5)
Where ―H02‖ is the second null hypothesis; ―μ1‖ is the population mean of Sensors A; ―μ2‖ is the population mean of Sensors B; ―t‖ is the test statistic for Paired Samples T-test to test the significant difference of the two paired samples; ―x̅diff‖ is the sample mean of the differences; ―n‖ is the sample size; ―Sdiff‖ is the sample standard deviation of the differences; and ―Sx̅‖ is the estimated standard error of the mean ―
√ ‖ [21].
3
RESULTS
AND
DISCUSSION
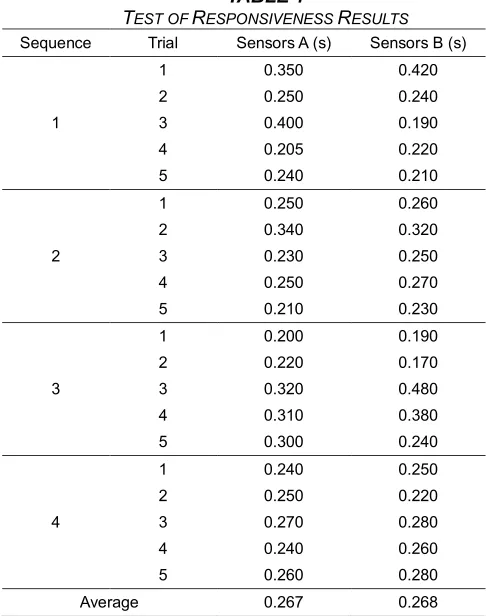
The following figures and tables show the results of the actual simulation and testing procedures. The discussions focus on answering the objectives and hypotheses of the study and in interpreting the data generated from various technical and statistical testing procedures. Shown on Table 4 is the result of test of responsiveness of Sensors A and Sensors B. With 5 trials conducted per sensor sequence, Sensors A detect smoke at approximately 0.267s, which is comparably fast as the Sensors B with 0.268s
Moreover, based on the results of independent samples T-test, Table 5 reveals that the responsiveness of Sensors A and B are not significantly different from each other with t (26.131) = -0.026 and p = 0.979, hence, the null hypothesis is accepted. After the first hypothesis testing, the authors then tested the system to establish its reliability as per requirements of H02. This was done by comparing the voltage threshold of the Sensors A and B with their equivalent LED indicators. A voltage of approximately 3.5-3.7v means that a smoke sensor or LED indicator is activated, while 0.7-1.2v means that they are deactivated. A deviation on the activation or deactivation levels means that there can be a bug in the algorithm or there is a hardware malfunction. Fig. 13 and 14 illustrate the trend results of reliability test, specifically between Sensors A and their LED indicators, and Sensors B and their LED indicators, respectively. As summarized, the voltage threshold for both sensors are almost similar to each other, where Sensors A and
their LED indicators activate at an average of 3.503v and 3.565v, respectively. Likewise, Sensors B and their LED indicators also activate almost at the same time with an average of 3.554v and 3.591v, respectively. The same results can also be manifested at deactivation mode, where Sensors A and Sensors B and their corresponding LED indicators are deactivated at 0.809v, 0.790v, and 0.825v and 0.804v, respectively.
TABLE4
TEST OF RESPONSIVENESS RESULTS
Sequence Trial Sensors A (s) Sensors B (s)
1
1 0.350 0.420
2 0.250 0.240
3 0.400 0.190
4 0.205 0.220
5 0.240 0.210
2
1 0.250 0.260
2 0.340 0.320
3 0.230 0.250
4 0.250 0.270
5 0.210 0.230
3
1 0.200 0.190
2 0.220 0.170
3 0.320 0.480
4 0.310 0.380
5 0.300 0.240
4
1 0.240 0.250
2 0.250 0.220
3 0.270 0.280
4 0.240 0.260
5 0.260 0.280
Average 0.267 0.268
TABLE5
INDEPENDENT SAMPLES T-TEST RESULTS
Leven’s Test of Equality
of Variance
s
t-test for Equality of Means
t df Sig. (2-tail ed)
Me an Diff
Std . Err or Diff .
95% Confidenc
e Interval of the Differnce
F Sig wer Lo per Up
Responsiv eness Equal Variances
Assumed 80 .7 83 .3 -0. 26 38
.97 9
-.00
1 .38 39
-.07 87
.07 67
Equal Variances
Not Assumed
-0. 26
26.1 31 .979
-.00
1 .38 39
-.07 99
2101 Moreover, the following Fig. 15 to 17 depict the results of
actual testing procedures conducted to ensure that a particular LED indicator displays the correct evacuation sign whenever a specific smoke sensor (this time Sensors A’s 2, 4, then all) is activated. As shown, all LED indicators (LED2, LED4, and ALL) have displayed the correct evacuation sign of ―✓‖ (passable) or ―X‖ (not passable) based on the detection of their particular sensors, as for which the smokes are still visible in the following images.
Lastly, the following Tables 6, 7, 8, and 9 show the Paired Samples Statistics 1, Dependent Samples T-Test 1 for Sensors A, and Paired Samples Statistics 2, and Dependent Samples T-Test 2 for Sensors B, respectively, which data are used as basis in testing further the H02. Based on the results of paired samples t-test, the study found that there is no significant difference on the activation mode of the input Sensors A (sequence 1, 2, 3, and 4) and their corresponding output LED indicators, where the average voltages are measured at 3.505300v ± 0.257684v (Sensors A) and 3.56450v ± 0.245946v (LED indicators) with tA_ON (19) = -0.847 and pA_ON = 0.408. The results are also similar with the deactivation mode where average voltages are measured at 0.80900v ± 0.76082v (Sensors A) and 0.79000v ± 0.099472 (LED indicators) with tA_OFF (19) = 0.678 and pA_OFF = 0.506. Same results can also be drawn on the activation and deactivation modes of Sensors B (sequence 1, 2, 3, and 4) and their corresponding LED indicators. As recorded, the activation voltage levels are 3.55350v ± 0.159614v (Sensors B) and 3.59080v ± 0.147893v (LED indicators) with tB_ON (19) = -0.847 and pB_ON = 0.408. The results are also similar with the deactivation mode where average voltages are measured
TABLE6
PAIRED SAMPLES STATISTICS 1
Mean N Deviation Std.
Std. Error Mean Pair 1-
Sensors A_ON & LED_ON
3.505300
3.56450 20 20 .257684 .245946 .057620 .054995
Pair 1- Sensors A_OFF & LED_OFF
.80900
.79000 20 20 .099472 .76082 .017012 .022243
TABLE7
DEPENDENT SAMPLE T-TEST RESULTS 1
Paired Differences
t df Sig.
(2-taile
d) Me
an Std. Devi ation
Std. Error
Mea n
95% Confidence
Interval of the Difference Low
er Upp
er Pair 1 -
SensorA _ON - LED_O N
-0.0 615
0.32 482
0.07 2632
-0.21 3521
0.09 0521
-0.8
47 1 9
0.40 8 Pair 2 -
SensorA _OFF - LED_OF F
0.0 19
0.12 5274
0.02 8012
-0.03
963 0.07
763 0.6
78 1 9
at 0.80900v ± 0.76082v (Sensors B) and 0.79000 ± 0.099472 (LED indicators) with tB_OFF (19) = 0.678 and pB_OFF = 0.506. In consideration on the results of dependent paired t-test where Sensors A and B were compared with their corresponding LED indicators at both activated and deactivated modes, the authors then accepted the null hypothesis 2 (H02), which states that there is no significant difference on the reliability of the system based on the accuracy of the sensors and the LED indicators. This further confirms that the system is reliable and can display the appropriate evacuation indicator based on the correct detection of its smoke sensors under study.
5 CONCLUSIONS
In this paper, the authors explored the feasibility of using Fuzzy Logic Control in the design and development of a fire evacuation system, with the main intent to improve the flexibility and responsiveness of compatible smoke sensors and to ensure the reliability of the system based on the accuracy of its detection vis-à-vis its evacuation signs. To realize these objectives, the authors proposed two null hypotheses: ―H01 = there is no significant difference on the responsiveness of the two types of smoke sensors‖; and ―H02=there is no significant difference on the reliability of the system based on the accuracy of the smoke sensors and the LED indicators.‖ Based on the results of simulation and actual testing procedures, the study found that there is no significant difference on the responsiveness of the two smoke sensors with independent T-test value of t (26.131) = -0.026 and p = 0.979. Likewise, test results further proved that there is no significant difference on the reliability performance of the smoke sensors and LED indicators with dependent T-test value of tA_ON (19) = -0.847; pA_ON = 0.408; tA_OFF (19) = 0.678; pA_OFF = 0.506; tB_ON (19) = -0.764; pB_ON = 0.454; tB_OFF (19) =1.212; pB_OFF = 0.240 in both activated and deactivated modes, respectively. Hence, both null hypotheses are accepted. These results confirmed that the prototype is responsive and reliable, and the use of FLC is effective for the design and development of fire evacuation systems.
6
REFERENCES
[1]. J. Yao, and X. Zhang, ―Spatial-temporal dynamics of urban fire incidents: a case study of Nanjing, China,‖ ISPRS-International Archives of the Photogrammetry, Remote Sensing and Spatial Information Sciences, vol. 4, no. B2, pp. 63-69, 2016.
[2]. ABS-CBN News, ―In the know: the top 3 causes of fire in the Philippines,‖ ABS-CBN News, March 1, 2018. [Online], Available: https://news.abs- cbn.com/news/03/01/18/in-the-know-the-top-3-causes-of-fire-in-ph. Accessed Nov. 23, 2019]. [3]. Philippine Government, ―BFP nationwide fire incidents
statistics for CY 2012-2016, GOVPH, Nov. 7, 2018.
[Online], Available:
https://data.gov.ph/?q=dataset/bfp-nationwide-fire-incidents-statistics-cy-2012-2016. [Accessed November 23, 2019]
[4]. P. P. Purpura, Security and Loss Prevention, 5th ed., Elsevier, 2008. [E-book] Available: https://doi.org/10.1016/B978-0-12-372525-7.X0001-9. [5]. O. Giandi, and R. Sarno, ―Prototype of fire symptom
detection system,‖ In Proc. International Conference on Information and Communications Technology (ICOIACT)’18, 2018, .pp. 489-494.
[6]. H. Jiang, ―Mobile fire evacuation system for large public buildings based on artificial Intelligence and iot,‖ IEEE Access, vol. 7, pp. 64101–64109, 2019. [7]. Hu, H., Wang, G., Zhang, Q., Wang, J., Fang, J., &
Zhang, ―Design wireless multi-sensor fire detection and alarm system based on ARM, 9th International Conference on Electronic Measurement & Instruments ’09, 2009, pp. 3-285-3288.
[8]. C. Lian, ―Design of intelligent fire alarm system based on GSM network,‖ In Proc. International Conference on Electronics and Optoelectronics ’11, 2011, pp.V-393-396.
[9]. H. Liu, J. Zheng, and Y. Chen, ―The application of multi-thread-based embedded system in the fire monitor,‖ In Proc. 2nd International Symposium on Electronic Commerce and Security ’09, 2009, pp. 506-508.
[10].C. Cheng, F. Sun, and X. Zhou, ―One fire detection method using neural networks,‖ Tsinghua Science and Technology, vol. 16, no. 1, pp. 31-35, 2011. [11].O-H. Kwon, S-M. Cho, and S-M Hwang, ―Design and
implementation of fire detection system,‖ In Proc. Advanced Software Engineering and Its Applications ’08, 2008, pp. 233-236.
[12].B. Sarwar, I.M. Bajwa, S. Ramzam, and M. Kausar, ―Design and application of fuzzy logic based fire monitoring and warning systems for smart buildings,‖ Symmetry 2018, vol. 10, no. 11, p. 61, 2018, doi: doi.org/10.3390/sym10110615.
[13].H. Wang, D. Li, Y. Wang and W. Yang, ―Fire detecting technology of information fusion using support vector machines,‖ In Proc. International Conference on Artificial Intelligence and Computational Intelligence ’10, 2010, pp.194-198.
[14].J. Gyu-Jin, P. Pyung, M-H. Kim, J-J. Jung, and T-K Ahn, ―Recognition of fire levels using fuzzy reasoning,‖ In Proc. 2nd International Conference on Industrial Mechatronics and Automation ’10, 2010, pp. 557-560.
TABLE8
PAIRED SAMPLES STATISTICS 2
Mean N Std.
Deviation
Std. Error Mean Pair 1- Sensors
B_ON & LED_ON
3.55350 3.59080 20 20 .159614 .147893 .035691 .033070 Pair 1- Sensors
B_OFF & LED_OFF
.82475 .80360 20 20 .070352 .067071 .015731 .014997 TABLE9
DEPENDENT SAMPLE T-TEST RESULTS 1
Paired Differences
t df Sig. (2-tailed ) Mea n Std. Deviat ion Std. Error Mean 95% Confidence Interval of the
Difference Lowe
r Upper Pair 1 -
SensorB_ ON - LED_ON 0.21 8403 0.048 836 -0.139 516 0.064
916 -0.764 19 0.4 54
0.21 8403 Pair 2 -
SensorB_ OFF - LED_OFF 0.07 8029 0.017 448 -0.015 368 0.057
668 1.212 19 0.2
2103 [15]. R. Sowah, K.O. Ampadu, A. Ofoli, K. Koumadi, G.A.
Mills, and J. Nortey, ―Design and implementation of a fire detection and control system for automobiles using fuzzy logic,‖ In Proc. IEEE Industry Applications Society Annual Meeting ’16, 2016, doi:10.1109/ias.2016.7731880
[16]. O. Giandi, and R. Sorno, ―Prototype of fire symptom detection system,‖ In Proc. International Conference on Information and Communications Technology (ICOIACT) ’18, 2018. pp. 489-494.
[17]. S.K. Nagpal, and S. Sudha, ―Two-level fuzzy based fire prediction scheme using wireless sensor network,‖ In Proc. 2nd International Conference on Advances in Computing and Communication Engineering ’15, 2015, pp. 57-62.
[18]. Z. Zadeh, ―Fuzzy Logic,‖ Computer, vol. 1, no. 4, pp. 83-93, 1988.
[19]. R. S. A. Corpuz and J. C. Orquiza, ―Utilization of Fuzzy Logic Control in a Waste Robot,‖ In Proc. 10th International Conference on Humanoid, Nanotechnology, Information Technology, Communication and Control, Environment and
Management ’18, 2018, Doi:
10.1109/HNICEM.2018.8666242
[20]. MathWorks Inc., ―Fuzzy Logic Toolbox‖, mathworks.com, Sep. 2019. [Online]. Available: https://www.mathworks.com/help/pdf_doc/fuzzy/fuzzy. pdf. [Accessed Nov. 24, 2019].