73
Laboratory Investigation Of The Suction Of Peat
Soil In Drying And Wetting Process
Yulindasari Sutejo, Anis Saggaff, Wiwik Rahayu, HanafiahAbstract: The suction of peat soil illustrate the characteristics of peat soil. This research aimed to investigate the peat soil suction (drying and wetting condition). Filter Paper testing (Whatman42) has been used for testing. The peat soil sample was acquired in village III Banyu Urip, Regency of Banyuasin, South Sumatera province. The percentage values of optimum water content in this study are: W1=41 %, W2=42 %, W3= 43 %, W4=44 %, W5=45 %, W1=46 %, W1=47 %, W1=48 %, and W1=49 %. The results of the test such as: the average water content (
opt) = 45 %, the value of optimum dry content weight value (γdopt) = 0.954 kN/m3. The results of
peat soil suction value (Ψ) due to the influence of wetting and drying are: P = 321.860454 kPa, W1 = 46.75611 kPa, W2 = 56.67991 kPa, W3 = 43.48429 kPa, W4 = 65.56742 kPa, W5 = 37.42705 kPa, W6 = 32.04885 kPa, W7 = 37.86667 kPa, W8 = 35.74133 kPa, and W9 = 28.58823 kPa. The results in the drying condition were greater when compared to the wetting condition.
Index Terms: Peat Soil, Suction, Soil Water Characteristics Curve (SWCC), Drying, Wetting
—————————— ——————————
1.
INTRODUCTION
Peat soil is the result of a mixture of fragmented organic matter formed in wetlands under climatic conditions and topography. The behavior of fibrous peat soil is very different from clay soil due to fiber in soil. The suction of peat soil can describe the behavior of peat soil. In the field of geotechnical, soil suction is a magnitude of groundwater that is absorbed by cations. Suction on the ground is directly related to the free energy in the pore in the soil [1]. Many methods can be used to quantify the value of soil suction. One technique or method that can be used in the calculation of suction, both soil suction and Soil Water Characteristics Curve (SWCC) is filter paper method. SWCC is a method of filter paper on dry soils, an extensive soil of the matric is up to 1 million kPa, and a zero value on the soil is fully saturated. The matric suction can be likened to negative pore water pressure. Soil Water Characteristics Curve (SWCC) is a curve describing the relationship between the amount of water in the soil and suction [3,4,5]. The amount of water here is Gravimetric water Content (GWC) (W), Volumetric Water Content (VWC) (θ), or degree of saturation (S). The testing method on this research used the laboratory Filter Paper testing as a passive sensor. These tests to evaluate soil matric and potential totals of soil suction. Paper Filter Type is Whatman42 [2,12]. Suction total is related to free energy in groundwater. While the suction of the matric and the osmotic suction is a component of free energy. In the form
of equations can be written as follows:
Ψ = (Ua – Uw) + π (1)
Where: (Ua – Uw) = matric suction (kN/m2
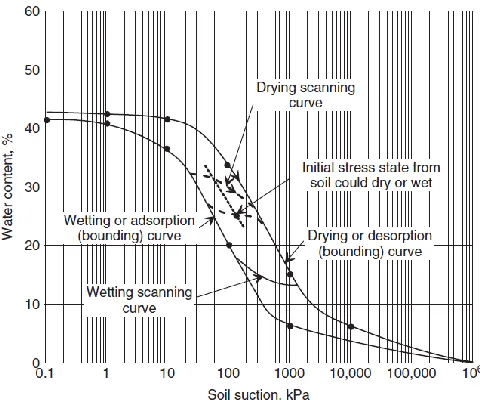
), Ua = air pore pressure (kN/m2), Uw = water pore pressure (kN/m2), π = osmotic suction (kN/m2) The soil suction measured from relative moisture is typically called total suction. In which, the total suction consist of the matric suction and the osmotic suction. Some environmental conditions that affect the absorption of matric are ground conditions, climatic or weather conditions, and groundwater-surface. In geotechnical knowledge, it is difficult to determine whether the land is in the drying process or the wetting process when in the field. The difference between drying and wetting from the SWCC is seen in terms of soil suction. The curve chart plots between the matric suction with moisture content for the drying process and the wetting shown in Figure 1. This graph illustrates the hysteresis effect of drying and wetting. [6] determined the process of drying SWCC. The sample for the test is the compacted Khon Kaen soil. The characteristic of an expansive soil had been studind by [7]. The research was studied the cycles of wetting and drying of the expansive soil.
———————————————— Yulindasari is lecturer in civil engineering in Universitas Sriwijaya,
Inderalaya, Indonesia, PH-006282375590849. E-mail: [email protected]
Anis Saggaff is Proffesor and lecturer in civil engineering Universitas Sriwijaya, Inderalaya,, PH-006281373292129. E-mail:
Wiwik Rahayu is lecturer in civil engineering in Universitas Indonesia, Depok, Indonesia, PH-0087884476400. E-mail:[email protected]
Fig. 1. The scanning curves and designation of the initial stress state of wetting and drying process (Fredlund et al.,
2012)
2 RESEARCH METHODOLOGY
2.1 Peat Soil
Samples of peat soil were taken at shallow depths. The methods of sampling were using the block sampling method. The location of the peat soil sample is in village III Banyu Urip, Regency of Banyuasin, South Sumatera province. Peat soil samples and research locations can be views in Fig. 1, and Fig. 2. Undisturbed peat soil samples had been used for the testing of index properties such as moisture content, density, void ratio, unit weight, and acidity levels are performed to obtain the behavior of peat soil. Von Post classifies peat soil or the degree of humification (H1-H10), fiber content (FC, %), organic content (OC, %), and ash content (AC, %). In this study, characteristics/mechanical properties in peat soil were testing using filter paper testing equipment. Types of peat soil samples are disturbed soil samples. Modeling of peat soil behavior in Banyuasin Regency, South Sumatra Province in the condition of drying and wetting with testing SWCC (Soil Water Characteristics Curve).
Fig. 1. Peat soil sample
Fig. 2. Research location (Walhi, 2015)
2.2 Laboratory Test
Standard Proctor Compaction Test function to define the relationship between moisture content (
density (γd, kN/m3
). Results obtained from the Standard
opt) and
optimum dry content weight (γdopt). The parameter of the
optimum water content value is used for suction soil testing. This test is to determine the effect of the drying process or the wetting process on peat soil suction value. ASTM D 5298-03 is a standard testing method for measuring soil suction using filter paper (Fig 3). The Whatman42 filter paper type is used for this test.
(a) (b)
Fig. 3. Filter paper test
The paper filter method of this research is a testing technique that takes advantage of filter paper or paper filter as the primary medium of suction power measurement in soil suction testing. Filters paper filter paper first in oven for at least 16 hours. Then filter paper filters are placed in plastic boxes and stored in a desiccator until use. After preparing the filter paper to be used, the suction measurement can be performed, including two measuring ways: the total suction measurement and the measurement of suction matric. 200-400 grams of peat soil samples were placed on sample containers. Soil sample filling in the sample container is fully cultivated to reduce equilibrium time and minimize the suction change in the soil. The equilibrium suction when the suction measurement is performed by closing the sample container and sealing it with an elastic and adhesive plastic electrical
75
insulation. Then save the sealed sample container into the insulated chest or closed insulation box, which is placed in the room temperature 20 ̊C with a variation in temperature 3 ̊C. This suction equilibrium is done at least 7 days. Samples for testing of soil absorption of peat are molded from the Standard Proctor Compaction test results. The standard for the Standard Proctor Compaction test is ASTM D558-82. The Standard Proctor Compaction testing is used to knowing the value of
opt) of peat soil. The percentage
value of optimum water content used to know the value of the suction of peat soil that has having drying then rewetting process: 41% (W1), 42% (W2), 43% (W3), 44% (W4), 45% (W5), 46% (W6), 47% (W7), 48% (W8), and 49 % (W9). Several sample test items for each percentage of six samples. All tests were performed at the Soil Mechanics Laboratory of Civil Engineering, Faculty of Engineering, Sriwijaya University.
3 RESULTS AND DISCUSSION
3.1 Index Properties Test Results
The beginning identification of peat soil is based on the index properties and classification testing. The location of the soil sample is derived from the village III Banyu Urip, Regency of Banyuasin, South Sumatera province. The properties of the index and classification include determination of water content, density, soil weight, pore numbers, and classification. The index properties and classification results are presented in Table 1. The average water content (
laboratory testing is 263.538%. Peat is known to have a low pH value, and its acidity tends to decline with depth. The test results showed that the average pH value was 3.353. Further, the result of other parameters of peat soil is the void ratio (eo) of 3.296, the average weight of a wet unit of 3,771 kN/m3 ranges between 8.30-15.50 kN/m3, and the weight of the average dry unit is 4.125 kN/m3. The type of peat soil is determined using the standard Mac Farlane and Von Post. Based on Mac Farlane, peat soil is classified as a fibrous peat soil. Meanwhile, according to Von Post, peat soil is including in the H4 category.
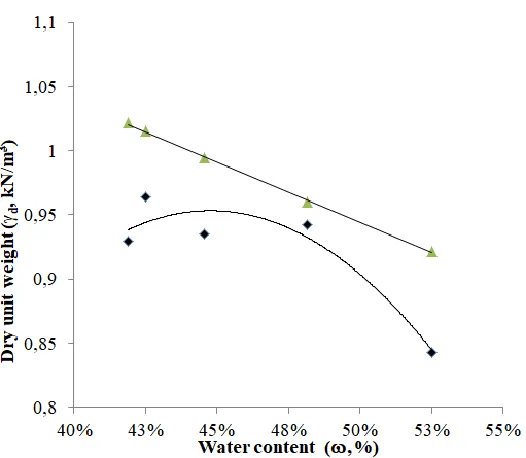
3.2 Standard Proctor Compaction Test Results
The standard compaction test curve for the village III Banyu Urip, Banyuasin Regency, South Sumatera Province can be seen in Fig. 4. Based on Figure 4, it can see the standard compaction test result for village III Banyu Urip peat soil
opt) and the
optimum dry content weight value (γdopt) of 45 % and 0.954
kN/m3.
TABLE1
RESULT OF PEAT SOIL INDEX PROPERTIES AND CLASSIFICATION
No. Results Test Village III
Banyu Urip
1 Water Content %) 294.300
2 Specific Gravity (Gs) 1.799
3 Acidity pH) 3.160
4 Void Ratio (e0) 3.092
5 Wet Unit Weigh b, kN/m 3
) 15.050
6 d, kN/m
3
) 4.132
7 Organic Content (OC, %) 77.400 8 Ash Content (AC, %) 22.610 9 Fiber Content (FC, %) 70.450
10 Von Post H4
11 Mac Farlane Fibrous peat
Fig. 1. The standard compaction test result of a Dusun iii banyu urip peat soil
3.3 Soil Suction Test Results
Soil suction testing on peat soil in this study was conducted under the reference of ASTM D 5298-03. To find out how much suction value is obtained in soil suction testing, then the sum of water content (
calibrating. The ground suction value of the percentage of
opt) of 45 % is shown in Table 2. As
well as Fig. 5, Fig. 6 and Fig. 7 that illustrates the graph of ground relationship to water con
saturation (Sr, %), and volumetric water content (θ, %) Result of peat soil suction testing.
TABLE2
RESULT OF PEAT SOIL SUCTION AT AN OPTIMUM WATER CONTENT OF 45%(W5 SAMPLE)
No. Water Content (w, %) Degree of Saturation (Sr, %)
Volumetric Water Content ( ϴ v, %)
Soil Suction (Ψ), kPa
14 47.6287 77.8136 62.63928 194.00529
The resulting parameters of peat soil suction test are obtained, such as the degree of saturation (Sr) is 100% with the moisture content
content (θ (ψ
the soil suction value (Ψ) for the W5 sample. Based on these graphs can be seen some points of the initial value of soil suction. The points are the AEV (Air Entry Value) value and the residual water content. From the figure of Ψ soil suction of
initial value of soil suction, Ψ
72.23904 % as the AEV value, and Ψ2 amounted to
content value. Fig.7 shows a relationship degree of saturation (Sr) and peat soil suction (Ψ) of W5 samples. The parameters obtained are the initial value of soil suction. AEV (Air Entry Value) and volumetric water content value. Based on Fig. 7, Ψ (soil suction) results of 1.000 kpa with Sr of 100.00000 % as the initial value of soil suction testing. Ψ1 of 8.207490 kPa with an Sr1 of 94.23036 % as the AEV value and Ψ2 of 92.438541 kPa with Sr2 amounted to 78.04964 % as a residual water content value. The graph of the relationship between the volumetric water content (ϴv) and the peat soil suction (Ψ) of the W5 sample is described in Fig. 8. Fig. 8 shows a few points of initial ground suction testing: AEV (Air Entry Value) and residual water content. The result is that the Ψ soil is hissed at 1.000 kPa with ϴv by 89.097498 % as the initial value of soil suction testing, Ψ1 of 8.207490 kPa with θv1 of 81.700750 % as AEV value and Ψ2 of 92.438541 kPa with ϴv2 by 63.602206 % as the moisture content of residue. The result of peat soil suction with the filter paper testing method due to the effect of drying and wetting is shown in Table 3. According to Table 3, the Peat soil suction value (Ψ) ranges 28.58823-65.56742 of the kPa.
Fig. 5. Graph of moisture content and peat soil suction in the W5 sample
Fig. 6. Graph of saturation and suction degree of peat soil on the W5 sample
Fig. 7. Graph of volumetric water content and peat soil suction link on w5 samples
TABLE3
RECAPITULATION OF PEAT SOIL SUCTION TEST DUE TO THE EFFECT OF DRYING AND WETTING
Sample
Soil Suction Soil
Suction Initial
Air Entry Value (AEV)
Residual Water Content Value
W1
, % 74.7926 65.8574 46.3367 Sr, % 100.000 92.8452 78.4965 ϴv,% 84.0865 77.2255 62.2653
Ψ, kPa 1.00000 9.3898 46.7561
W2
, % 76.1031 67.2191 47.1485 Sr, % 100.000 89.1341 79.0507 ϴv,% 84.6347 77.7290 62.6712
Ψ, kPa 1.00000 10.5039 56.6799
W3
, % 78.9801 72.4658 48.9310 Sr, % 100.000 94.2674 85.7510 ϴv,% 84.6304 78.349 65.5933
Ψ, kPa 1.00000 9.0014 43.4842
W4
77 ϴv,% 84.8891 77.9626 62.0559
Ψ, kPa 1.00000 8.6120 65.5674
W5
, % 83.9358 72.2394 51.0965 Sr, % 100.000 94.23036 79.1729 ϴv,% 89.0975 81.70075 65.2388
Ψ, kPa 1.00000 8.2074 37.4270
W6
, % 85.5739 75.2425 53.4847 Sr, % 100.000 94.4637 79.4109 ϴv,% 89.9765 83.0404 66.9537
Ψ, kPa 1.00000 7.0329 32.0488
W7
, % 86.0296 74.7845 53.2983 Sr, % 100.00000 95.9096 80.3065 ϴv,% 90.9333 83.5137 67.3352
Ψ, kPa 1.00000 8.3045 37.8666
W8
, % 88.0030 77.1369 54.5209 Sr, % 100.000 93.1052 78.4345 ϴv,% 90.5134 83.1286 67.0243
Ψ, kPa 1.00000 8.0298 35.7413
W9
, % 87.9598 77.094 54.4942
Sr, % 100.000 89.4652 75.3590 ϴv,% 91.0444 83.6175 67.4175
Ψ, kPa 1.00000 7.0538 28.5882
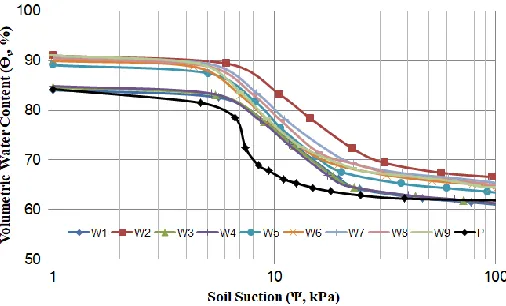
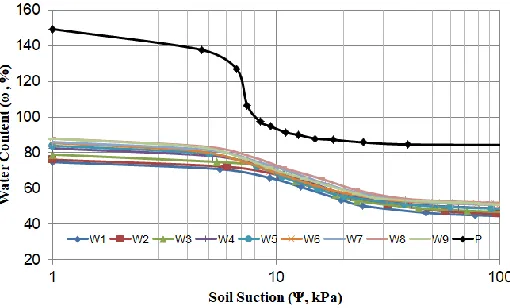
The suction graph with volumetric water content as well as the moisture content suction graph due to the wetting and drying influence on peat soil for sample P and W5 samples are shown in Fig. 8 and Fig. 9. In Figure 8, the value of the absorption of peat soil due to the wetting influence is higher than drying. As well as Fig. 9 shows the value of a peat soil suction due to smaller wetting influence than drying. The relationship between suction value and volumetric water content due to the wetting and drying influence on all peat soil samples is described in Fig. 10. Whereas Figure 11 shows the graph between the suction value and the moisture content due to the wetting and drying influence of all peat soil samples. Based on the figure, it can be concluded that the higher the water content is added then the suction value will be smaller. This condition is due to an empty cavity in peat soil pores.
Fig. 8. Suction graph with volumetric water content due to the influence of wetting and drying on peat soil (sample P and W5
samples
Fig. 9. Suction graph with moisture content due to wetting and drying effect on peat soil (sample P and W5 samples)
Fig. 11. Suction Graph with moisture content due to wetting and drying influence on all peat soil samples
Fig. 12 shows a graph of peat soil suction value due to the influence of wetting and drying. Based on Figure 10, the results of peat soil suction value (Ψ, kPa) are: sample P of 321.860454 [8], W1 sample of 46.75611, W2 sample of 56.67991, W3 sample of 43.48429, W4 sample of 65.56742, W5 sample of 37.42705, W6 sample of 32.04885, a W7 sample of 37.86667, a W8 sample of 35.74133, and a W9 sample of 28.58823. The absorption rate of peat soil due to drying is higher when compared to the absorption rate of peat soil due to wetting. Peat soil suction value is also obtained based on the calibration curve for Whatman42 Filter Paper. The suction rate of peat soil (Ψ, kPa) for W1 samples are 2.42196 (Yulindasari), 1.82786 (ASTM D5298), 0.15864 (Chandler and Gutierrez), 1.99227 (Chandler et al.,), 1.90365 (Oliveira and Marinho). The recapitulation of calculated results according to the calibration curve can be seen in Table 4. The research result from [9], is about FPM. FPM is a method to use to get the parameter matric suction for soils in a range of suction. The parameter using the value of dry density = 95 % MDD. Another results from [5] also using the filter paper method. This technique had been used for soil-suction measurement. The results shows the value of suction with an inflection point occurring at 60 kPa < s < 100 kPa.
Fig. 12. Graph of peat soil suction value based on wetting and drying process
TABLE4
COMPARISON OF PEAT SOIL SUCTION VALUE BASED ON A CALIBRATION CURVE FOR WHATMAN42 FILTER PAPER
Soil Suction (Ψ, kPa)
Yulindas ari (2018)
ASTM D5298
Chandler, et. al.
Oliveira and Marinho
P 2.2221 1.2787 1.2784 1.2772
W1 2.4219 1.8278 1.9922 1.9036
W2 2.3914 1.8176 1.9336 1.8919
W3 2.3762 1.7951 1,9336 1.8663
W4 2.3261 1.7674 1.8862 1.8346
W5 2.2878 1.7690 1.8888 1.8365
W6 2.2199 1.7366 1.8360 1.7996
W7 2.1544 1.7401 1.8415 1.8035
W8 2.1183 1.7246 1.8170 1.7859
W9 1.9860 1.7250 1.8176 1.7863
Table 4 explains the comparison of soil suction values based on the Whatman42 Filter Paper curve. The value of peat soil suction in the sample P was obtained: 2.2221 kPa (Yulindasari), 1.2787 kPa (ASTM D5298), 1.2784 kPa (Chandler et al.), and 1.2772 kPa (Oliveira and Marinho). Based on this table, it can be concluded that the suction value of the P sample is higher when compared to the others.
4
CONCLUSION
Conclusions that can be taken from the research results on the suction of peat soil as follows:
1. The value of suction (Ψ, kPa) of peat soil due to the influence of wetting and drying is obtained at sample P of 321.860454 kPa, the W1 sample of 46.75611 kPa, the W2 sample of 56.67991 kPa, the W3 sample of 43.48429 kPa, the W4 sample of 65.56742 kPa, the sample W5 37.42705 kPa, a W6 sample of 32.04885 kPa, a W7 sample of 37.86667 kPa, a W8 sample of 35.74133 kPa, and a W9 sample of 28.58823 kPa.
2. The absorption rate of peat soil due to drying is higher when compared with the absorption rate of peat soil due to wetting.
ACKNOWLEDGMENT
This research is part of the Dissertation research from the Civil Engineering Department, Faculty of Engineering, Universitas Sriwijaya.
REFERENCES
[1] Fredlund, et al., Unsaturated Soil Mechanics in Engineering Practice, John Wiley & Sons, Inc. 2012.
[2] ASTM International. ―Standard Test Method for Measurement of Soil Potential (Suction) Using Filter Paper‖, D5298-03. ASTM International. 2003.
79
[4] Leong, E., C., Kizzam, R., and Rahardjo, H., ―Measurement of Soil Suction using Moist Filter Paper‖. E3S W. UNSAT 10012. DOI: 10.1051/ e3sconf/20160910012. 2016.
[5] Bicalho, K. V., Bertolde, A. I., Cupertino, K. F., Fleureau, J. M., and Correia, A. G., ―Single-Function Approach to Calibrating Whatman No. 42 Filter Paper Based on Suction Versus Water Content Relationships‖, Geotech. Test. J., vol. 38, no. 1, 2015, pp. 113-118.
[6] Nuntasarn,R., and Wannakul, ―The Relationship between Soil Suction and the Maximum Unsaturated Undrained Shear Strengths of Compacted Khon Kaen Soil‖, Int. J. of GEOMATE, March, 2012, Vol. 2, No. 1 (Sl. No. 3), pp. 166-170 Geotec., Const. Mat. and Env., ISSN:2186-2982(P), 2186-2990(O), Japan, 2012.
[7] Estabragh, A.R., Parsaei, B., Javadi, A.A., ―Laboratory investigation of the effect of cyclic wetting and drying on the behaviour of an expansive soil‖, The Japanese Geotechnical Society, Soils and Foundations Vol. 5 (2), 20155, pp. 304-314.
[8] Sutejo, Y., Saggaff, A., Rahayu, W., Hanafiah, ―Characteristics of Soil Suction with Filter Paper Test Method‖, Journal on Advanced Science, Engineering and Information Technology (IJASEIT), Vol.8 (2018) No. 5 ISSN: 2088-5334, pp. 2128-2134.
[9] Hamzah M. Beakawi Al-Hashemi, ―Estimation of SWCC for Unsaturated Soils and Its Application to Design of Shallow Foundations‖, Proceedings of the 3rd World Congress on Civil, Structural, and Environmental Engineering (CSEE’18), Budapest, Hungary – April 8 - 10, 2018, Paper No. ICGRE 131.
[10]Camporese, M., Ferraris, S., Putti, M., Salandin, P., and Teatini, P., ―Hydrological Modeling in Swelling/Shrinking Peat Soils‖, Water Resources Research, Vol. 42, 2006.
[11]Sarifuddin, Nasution, Z., Rauf, A., and Mulyanto, B., Effect Of Seawater on Physicochemical Characteristics of Sumatra Lowland Peat International Journal of Scientific & Technology Research Volume 5, Issue 05, ISSN 2277-8616, May 2016.
[12]Bai1, F. Q. and Liu, S. H., ‖Measurement of the Shear Strength of an Expansive Soil by Combining a Filter Paper Method and Direct Shear Tests‖, Geotechnical Testing Journal, Vol. 35, No. 3, Paper ID GTJ103342, 2012. [13]Al-Ani, H., Erwin Oh, and Chai,G., ―Characteristics of