United Kingdom Vol. VI, Issue 5, May 2018
Licensed under Creative Common Page 311
http://ijecm.co.uk/
ISSN 2348 0386
INFLUENCE OF PROJECT MANAGEMENT INFORMATION
SYSTEM USER KNOWLEDGE ON PERFORMANCE OF
CONSTRUCTION PROJECTS IN SOUTH RIFT, KENYA
Kiprotich Elijah Bor
School of Human Resource Management, Jomo Kenyatta University of Science and Technology, Kenya [email protected]
Kibet Erick Chepnoen
School of Human Resource Management, Jomo Kenyatta University of Science and Technology, Kenya
Abstract
This study looked into the influence of Project Management Information System user
Knowledge on performance of construction projects in South Rift, Kenya. The study used
descriptive census design with accessible population of 95 respondents. The study was guided
by Technology Acceptance Model (TAM) and DeLone and McLean Information System Success
Model (ISSM). Reliability and validity of questionnaire was tested. Analysis of data on
hypothesized relationships was done using Multiple Regression Model. The findings of this
study indicated that Project Management Information System user Knowledge had significant
relationship with project performance p=0.000 and R=0.54. The study further concluded Project
Management Information System user Knowledge makes significant contribution to project
performance and should continue to be subject of further research. The study recommends that,
construction companies in South Rift to achieve levels of efficiency and effectiveness in
construction projects, the management of the company must ensure adoption of the use of
integrated project management information system. Secondly management of South Rift
construction companies, to take cognizance of technical training on Project Management
Information System user Knowledge this will ensure up to date proficiency and productive team;
they should also acquire latest information systems infrastructure with web-based utility.
Keywords: Project Management, Project Management Information System, User Knowledge,
Licensed under Creative Common Page 312
INTRODUCTION
Globalization and internationalization of markets have accelerated aggressive pressures on enterprise establishments. This has led organizations to have critical focus on initiatives that are crucial to their overall performance, if not their survival. The evolution of world competitive markets has led to a fact that projects in a regular commercial enterprise together with engineering, records era; production, and many others, want to be enormously controlled, in terms of planning, scheduling, organizing, tracking, and controlling (Liberatore, 2003).
In order to accomplish this, groups must manage projects within decided time, finances, and in excess of performance even as handling risks. Although project management structures help a business enterprise decrease product and service development time to marketplace, exploit constrained resources and enlarge worldwide marketplace competition, task managers nevertheless need to utilize equipment that allows in overcoming diverse demanding situations such as: uncontrollable time and budget regulations; inconsistent mission groups; unpredictability of corporation’s resources; lack of readability in prioritizing tasks; delays in undertaking choice-making; and shortage of clarity in collaboration among task group members (Cavalieri, 2007). Therefore, whilst initiatives managers continue to conflict with these issues, they are obligated on the same time to make choices in one of these manner that chance is managed, uncertainty minimized and in which every selection made by using them will ideally be beneficial to the challenge. This can be accomplished while the organization acquires an Integrated Project Management Information System as a means to offer top managers with the vital tools that are useful for the decision making process on the subject of deciding on making plans, organizing, and controlling projects and portfolios.
The project management systems currently used inside the production enterprise may be divided into two kinds. The first one is off-the-shelf commercial software program, wherein projects are controlled by use of Gantt Charts, the Program Evaluation and Review Technique (PERT) (Kerzner, 2005) and the Critical Path Method (CPM) (Woolf, 2007). These control techniques have speedily unfolded in many private companies. Thus, a variety of the associated business software packages cater for the aforementioned strategies; examples consist of Microsoft Project, Primavera Project Planner and Application Service Provider. The second type of venture management system is custom in-residence software program, when business software program does not meet the precise necessities of an engineering mission or firm; a few companies will develop custom in-house project control software to fulfill their desires. Examples of this encompass Bechtel (Schmitz, 1991, Parsons, 2004, Kajima, 2000).
Licensed under Creative Common Page 313 are becoming ever more complex and time driven, especially as the amount of project information and active project participants increases. Thus, we require more effective project tools for integration, management and communication. The question then arises about multi-dimensional information integration, management, and visualization of engineering projects. It therefore follows that an effective project management system should not only provide sufficient and comprehensive information to facilitate project management, but also provide the various visualization tools to assist with information distribution and communication. Among various IT solutions, the internet-based (or web-based) Project Management Information Systems has been highlighted because of its strong advantages such as low cost compared with traditional communication methods, location-free access, speedy and reliable data transfer and storage, and efficient information sharing among parties (Jung, 2011).
In Korea and Japan web based Project Management Information Systems is one of the most widely used tools that supports and enhances the collaboration and communication between construction project participants. The reason for the swift adoption of web-based Project Management Information Systems in the Korean and Japan construction industry closely relates not only to the above-mentioned advantages, but also to the well-established internet infrastructure and users' familiarity with web-based computing environment (Jung, 2011). Besides these technical reasons, the Korean construction management guidebook specifies the use of Project Management Information System by construction managers hired by government or government agencies for efficient information management has strongly facilitated the adoption of web-based Project Management Information Systems in the Korean construction industry.
In England, there are two types of Project Management Information Systems in the construction field: One is that which is developed and used by individual construction companies. The other is the ASP (Application Service Provider)-based Project Management Information System which is developed for general construction projects but can be customized for specific construction projects. The former can be considered as one of the information systems (e.g. MIS and ERP systems, etc.) used in a company exclusively, while the latter are generally used by various project participants such as client, architect, constructor, sub-contractor and construction manager, and their quality is considerably more dependent on the capability of service providers (Stewart, 2004).
Licensed under Creative Common Page 314 automate many of the company’s business processes such as human resources, financial management, manufacturing, procurement, construction, operations and maintenance.
In Kenya an Act of parliament, 2011 which established The National Construction Authority in order to streamline, overhaul and regulate construction industry achieve quality construction, the construction industry is a crucial sector for growth of the economy. According to the Kenya National Bureau of statistics (KNBS; 2015) the construction industry contributed 4.8%, 5.6 %, 5.8% and 6.1 % towards Gross Domestic Product (GDP) for the years 2012, 2013, 2014 and 2015respectively. This is an average of 5.6 % as compared to 10% for the developed economies (Hillebrandt, 2000).
In South Rift, many construction firms have got computer based material management systems (MMS), which stores, sort, combine and print data files pertaining to materials requisition, purchasing, vendor evaluation and warehouse inventories. The use of these systems not only gives the firms competitive edge against their competitors but also enhances the effectiveness of construction projects throughout their life cycle and across the different construction business functions. According to (Kaiser, 2010), the use of Project Management Information System is based on the belief that their cost will be offset by the benefits that come along with it. They continue to say that the broadening of Project Management Information System scope enables organizations to not only manage individual projects but whole project portfolios. In general, Project Management Information System support most of the project life cycle phases from the idea generation, risk management, stakeholder management to the management of knowledge created long after the project completion.
Statement of the Problem
Licensed under Creative Common Page 315 Projects need to be effectively managed, that is, they need to be planned, staffed, organized, monitored, controlled, and evaluated (Liberatore, 2004). In order to succeed, companies must deliver projects on time, within budget and meet specifications while managing project risks. Peterson, (1992).Identified that project management has long been considered an important characteristic of successful companies and is more than ever necessary to efficiently and effectively manage these projects and to support project managers in their decision-making. Cleland states that project managers necessitate accurate and timely information for the management of a project. Project planning, organizational design, motivation of project stakeholders, and meaningful project reviews simply cannot be carried out without information on the project together with how it relates to the larger organizational context in which the project is found (Cleland, 2004).
However, with Integrated Project Management Information System being increasingly used by project managers in all types of industry, not much is known on the characteristics of these systems that contribute to project performance. Thus the purpose of this study was to explore the influence of Project Management Information System on performance of projects in construction industry in South Rift with regard to the System, Quality of Information, the System user and the System use during the entire project life cycle to increase project performance rate. With the system, performance rate and success in projects will seamlessly be achieved in Bomet, Kericho and Narok counties.
Objectives of the Study
To assess the influence of Project Management Information System user Knowledge on performance of construction projects in South Rift, Kenya.
LITERATURE REVIEW
Review of Theories
DeLone and McLean Information System Success Model (ISSM) (1992)
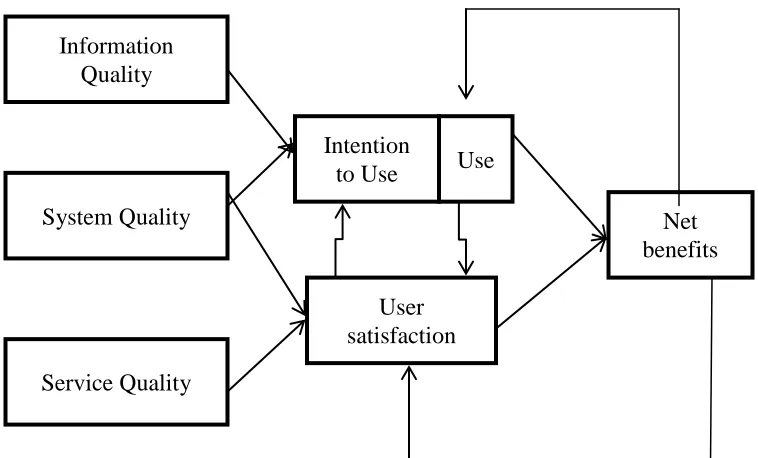
Licensed under Creative Common Page 316 construct the model, DeLone and McLean reviewed 100 papers containing empirical IS success measures published in seven publications during 1981-1987. They distilled the resulting huge range of Information system success measures into an integrated view of IS success, represented by the following the six dimensions: System Quality, Information Quality, Information Use, User Satisfaction, Individual Impact and Organizational Impact.
While the model integrates the comprehensive dependent variables used by IS researchers, it received several criticisms. Ten years later, DeLone and McLean presented an updated model reflecting the criticisms by other researchers and the situation at the time. As the service concept was added to IT with the use of the Internet, they increased the number of information system success factors to seven, including service quality, and analyzed the interdependence and correlation of these seven factors. It is relevant in a way that like actual system use, user satisfaction directly influences the net benefits provided by an information system. Satisfaction refers to the extent to which a user is pleased or contented with the information system, and is posited to be directly affected by system use. The net benefit that an information system is able to deliver is an important facet of the overall value of the system to its users or to the underlying organization by Urbach& Müller, (2011). In the IS success model, net system benefits are affected by system use and by user satisfaction with the system. In their own right, system benefits are posited to influence both user satisfaction and a user’s intentions to use the system.
Figure 1 DeLone and McLean Information System Success Model
Information
Quality
System Quality
Service Quality
Intention
to Use
Use
User
satisfaction
Licensed under Creative Common Page 317
Project Management Information System User Knowledge
User satisfaction is ―the result of the individual taking outcomes that have been received and evaluating them on a pleasant-unpleasant continuum‖ (Seddon &Kiew, 1994). As already mentioned earlier relevance, accuracy, availability, reliability, consistency and timeliness are factors related to information quality. Ali & Money, (2005) found several studies that used these factors to measure the degree of user satisfaction with a given system's performance and concluded that the information quality has the greatest total effect on the use of project management information software. This suggests that project managers are more eager to accept Project Management Information System on the basis of the quality of the information output and that they are more likely to use software that provides them with an appropriate level of details that fits their work needs, is free of complexity, and is easy to understand and communicate with the project team.
Further, user satisfaction is not restricted to individual satisfaction but positively affects the intention of Project Management Information System use, through which I-PMIS use is expanded and sharing of information is facilitated within an organization; user satisfaction acts as a premise for efficient and effective construction management (Wang, Chang, Jiang,& Klein, 2011).
Licensed under Creative Common Page 318 may help senior undertaking management, task directors, challenge managers, and many others., in monitoring and assessing task performance.
Studies on the use of Project Management Information System in unmarried projects display that there are numerous critical factors that force assignment managers to use Project Management Information System. First, whether or not venture managers will use Project Management Information System strongly depends at the quality of the records generated by using the Project Management Information System.
Fugar, (2010), shows that a Project Management Information System does no longer necessarily suggest a cutting-edge generation tool that offers capabilities for every undertaking due to the fact each undertaking has one-of-a-kind records needs both in quality and in quantity. Every venture calls for specific degrees of technology to meet its primary statistics management wishes, a small venture with small wishes will suffice with simple technologies, but massive initiatives with huge facts needs can benefit from greater giant technological solutions (Caldwell, 2004). It could be very high-quality to apply a specialized Project Management Information System for it gives the mission team and manager to apply to correct quantity and for that reason high-quality statistics.
RESEARCH METHOD
Target population
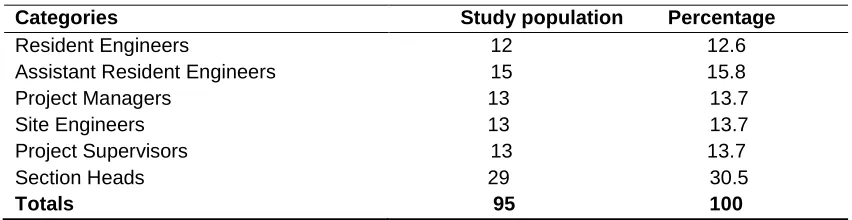
Target population is the specific accessible population about which information is desired. According to Denscombe, (2008) a population is a well-defined or set of people, services, elements, and events, group of things or households that are being investigated. The study targeted a population of 95 respondents, who constitute of Resident engineers 12, Assistant Resident Engineers 15, Project Managers 13, Site Engineers 13, Project Supervisors 13 and Section Heads 29. This covered road construction companies currently in Bomet, Kericho and Narok counties. All construction projects are recorded by KeRRA headquarters, Nairobi.
Table 1 Accessible/ Study Population
Categories Study population Percentage
Resident Engineers 12 12.6 Assistant Resident Engineers 15 15.8 Project Managers 13 13.7 Site Engineers 13 13.7 Project Supervisors 13 13.7 Section Heads 29 30.5
Totals 95 100
Licensed under Creative Common Page 319
Census Inquiry
Churchill and Brown, (2004) noted that the correct sample size in a study is dependent on factors such as the nature of the population to be studied, the purpose of the study, the number of variables in the study, the type of research design, the method of data analysis and the size of the accessible population. Cooper & Schindler, (2003) define census as a procedure of systematically acquiring and recording information about members of a given population. This defined population is referred to as a sampling frame. Under this method data is collected for each and every unit. Thus this study applied census inquiry due the small number of respondents at ninety five.
Data Analysis and Presentation
The Statistical Package for Social Sciences (SPSS) version 24 was used in the data processing. After data collection, the data was coded, organized and edited to remove any inconsistencies, repetitions or errors that may make the analysis difficult. The cleaned data collected, was analyzed using both descriptive and inferential statistics. Descriptive statistics included frequencies, percentages, charts and tables, while for inferential statistics; Multiple Regression Model was used for comparison of variables. Multiple regression model has the following assumptions; Linearity, Normality, autocorrelation and multicolinearity.
Qualitative data was first organized into themes, and then descriptive statistical method is used to explain the frequencies and percentages calculated from the data obtained in the field. The data was analyzed in the most logical and meaningful way and relevant comments made appropriately. Linear Regression model was used in analysis. Quantitative data was analyzed using descriptive statistics which included mean, standard deviation and frequency distribution. Considering the quantitative nature of the data, descriptive statistics which describes the main features of the data collected (frequency, percent, mean and standard deviation) was used. Tables and bar charts were used to summarize responses for further analysis and to facilitate comparison.
RESULTS AND DISCUSSION
Influence of I-PMIS User Knowledge on Project Performance
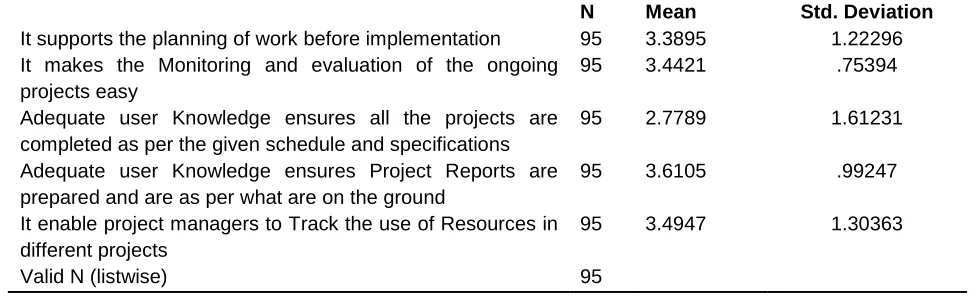
Licensed under Creative Common Page 320 Table 2 Influence of I-PMIS User Knowledge on Project Performance
N Mean Std. Deviation
It supports the planning of work before implementation 95 3.3895 1.22296 It makes the Monitoring and evaluation of the ongoing
projects easy
95 3.4421 .75394
Adequate user Knowledge ensures all the projects are completed as per the given schedule and specifications
95 2.7789 1.61231
Adequate user Knowledge ensures Project Reports are prepared and are as per what are on the ground
95 3.6105 .99247
It enable project managers to Track the use of Resources in different projects
95 3.4947 1.30363
Valid N (listwise) 95
The study established that respondents were in agreement that user knowledge on the I-PMIS influenced performance of project , on it supports the planning of work before implementation with responses with a mean of 3.3895 and a standard deviation of 1.22296 , on whether It makes the Monitoring and evaluation of the ongoing projects easy with responses with a mean of 3.4421 and a standard deviation of 0.75394, on whether adequate user knowledge ensures all the projects are completed as per the given schedule and specifications ,respondents also agreed with a mean of 2.7789 and a standard deviation of 1.61231, on whether Adequate user Knowledge ensures Project Reports are prepared and are as per what are on the ground , respondents also agreed with a mean of 3.6105 and a standard deviation of .99247, on whether it enable project managers to Track the use of Resources in different projects respondents also agreed with a mean of 3.4947 and a standard deviation of 1.30363. This implies that the I-PMIS user knowledge is a critical factor in performance of projects of South Rift construction companies; this is because their responses were between 2.78 to 3.61 implying a strong relationship between variables. Also the standard deviation was between 0.75 and 1.61 which was higher than 0.5 indicating homogeneity of data.
These findings are in consistent to that of Hyojo, (2016) who stated that user knowledge of the I-PMIS both to individual and organizations are guaranteed better project performance. Further, Shaddi Fallah, (2010) who stated that with efficient PMIS organizations and project manager’s crucial roles of planning proper scheduling, regulating and controlling the project relate to ease and swiftness in delivery of project reports thus assurance of project performance.
Licensed under Creative Common Page 321
Results of Regression Analysis Assumptions
The study test for multivariate assumptions which were; linearity, normality, autocorrelation, multicollinearity and homoscedasticity
Linearity Assumption Test
Linearity assumption was evaluated using scatter diagrams and residual plots. Results of scatter diagrams of I-PMIS user knowledge and project performance are shown in Figure 2.
Figure 2 Scatter Plot Project Performance And I-PMIS Efficiency
From the scatter plot (from SPSS) followed a linear pattern above the indicating that there is a linear relationship between I-PMIS user knowledge and project performance.
Homoscedasticity Assumption Test
This was tested by plotting the standardized residuals against the standardized predicted values of the dependent variable using Levene’s test of equality of variances was conducted as shown in Table 3.
Table 3 Levene's Test for Equality of Variances
Levene's Test for Equality of Variances F Sig.
Unstandardized Residual (I-PMIS user knowledge)
Equal variances assumed 5.589 .019
Licensed under Creative Common Page 322
Normality test
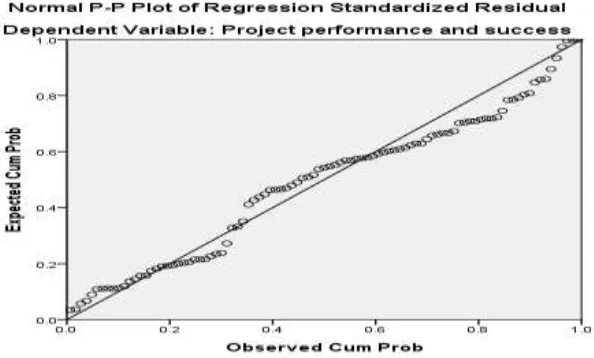
To find out whether residuals follow a normal probability distribution, histograms and normal probability plots were used. The results of graphical analysis are shown in Figure 3.
Figure 3 Histogram of Standardized Residual
The black line superimposed on the histogram represents the bell-shape normal curve. There’s is symmetry of skewness; it is positively skewed distribution with score clustered to the right with the tail extending to the left as shown on Figure 3.
Normal probability plots were also used to test for normality assumption. The relevant results are shown in Figure 4.
Licensed under Creative Common Page 323 The findings indicate that points approximately form a straight line in the above Figure 4 shows how closely two data sets agree which plot the two cumulative distributions /probability evaluate skewers of distribution. Deviations from the straight line suggest departure from normality. They are closely related therefore normality test was therefore met on data.
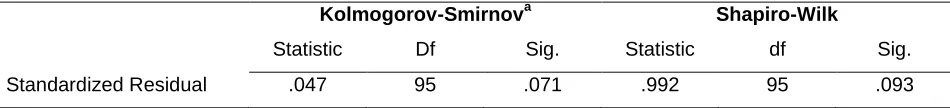
Kolmogorov-Smirnov and Shapiro-Wilk tests were also used. The results are shown in Table 4.
Table 4 Normality tests
Kolmogorov-Smirnova Shapiro-Wilk
Statistic Df Sig. Statistic df Sig.
Standardized Residual .047 95 .071 .992 95 .093
a. Lilliefors Significance Correction
The findings indicate that any Kolmogorov-Smirnov value less than 0.035 is not normal. .071>.035 also value for Shapiro-Wilk less than 0.05 indicate non –normality 0.093>.05 therefore data is not different from normal. Hence, assumption is met.
Multicollinearity Test Assumption
The assumption of multicollinearity was tested using variance inflation factor and tolerance. The results are shown in Table 5.
Table 5 Collinearity Statistics
Model Tolerance VIF
1 (Constant)
I-PMIS user knowledge .756 1.322
The findings indicate that Quality of information output had variance inflation factor of 1.382,I-PMIS user knowledge(1.322). V.I.F < 10, this implies that evaluations of relative strength of predictor variables and their joint effect were reliable. Hence beta weights and R-squares were reliably interpreted.
Autocorrelation Test
Licensed under Creative Common Page 324 to assume independent observation as it is expected that the value of Durbin Watson statistic should be between 1.5 and 2.5 if the multiple regression model is to be correctly fitted to the data. Hence, the study assumed that residuals were independent.
Inferential Analysis
This section presents the results of correlation and multiple regression analysis in line with the specific objectives of this study.
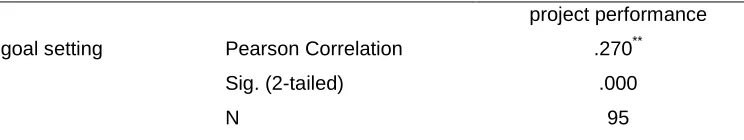
Relationship between I-PMIS user knowledge and project Performance
The study also assessed the relationship between I-PMIS user knowledge and project performance of construction companies in Kericho, Bomet and Narok counties. The correlation analysis results are presented in Table 6.
Table 6 Correlation between I-PMIS User Knowledge and Project Performance project performance Strategic investment goal setting Pearson Correlation .270**
Sig. (2-tailed) .000
N 95
**. Correlation is significant at the 0.01 level (2-tailed).
As shown in Table 6, the relationship between I-PMIS user knowledge and project performance was weak, positive and significant (r = 0.270; p < 0.01). This means that the higher I-PMIS user knowledge level the more their project performance improved and vice versa. This implies that the engineers should set step up user knowledge in order to ensure that project success is enhanced. These findings are in consistent to that of Hyojo, (2016) who stated that user knowledge of the I-PMIS both to individual and organizations are guaranteed better project performance. Further, Shaddi Fallah, (2010) who stated that with user knowledge on I-PMIS provided organizations and project manager’s crucial roles in assurance of project performance. This study is supported by TAM model in this study; theory asserts user satisfaction as major construct in I-PMIS utilization as to satisfaction of users’ needs and project performance.
Test of Hypothesis
Licensed under Creative Common Page 325 on the line of best fit. The decision rule was that if the p-value is less than conventional 0.05 the null hypothesis is rejected and when its above 0.05 we fail to reject the null hypothesis,
H03 I-PMIS user knowledge has no significant effect on performance of construction projects in
South Rift construction companies, Kenya.
A regression model containing the independent variable (I-PMIS user knowledge) was run to find out its causal effect on the dependent variable project performance (Table 7).
Table 7 Model Summary I-PMIS user knowledge and project performance
Model R R Square
Adjusted R
Square Std. Error of the Estimate
1 .204a .042 .031 .67013
a. Predictors: (Constant), PMIS user knowledge
Table 7 illustrates the model summary used in this study, Adjusted R squared is coefficient determination of which tells us the variation in the dependent variables of the study due to changes in the independent variables, from the findings , the value of adjusted R squared was 0.031and indication there was variation of 67 % on project performance due to changes in I-PMIS quality information output, R is correlation coefficient which shows the relationship between the study variables R indicated a reasonable linear relationship between I-PMIS quality information output and project performance.
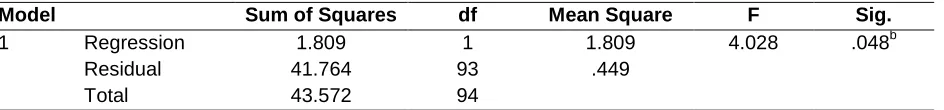
Table 8 ANOVA I-PMIS User Knowledge and Project Performance
Model Sum of Squares df Mean Square F Sig.
1 Regression 1.809 1 1.809 4.028 .048b
Residual 41.764 93 .449
Total 43.572 94
a. Dependent Variable: Project performance and success b. Predictors: (Constant), PMIS user knowledge
Table 8 illustrates the Analysis of Variance (ANOVA) which assesses the overall significance of the model. According to the table P<05, (0.048), indicating that the regression model was useful.
Table 8 Coefficients of I-PMIS User Knowledge and Project Performance
Model
Unstandardized Coefficients Standardized Coefficients
t Sig.
B Std. Error Beta
1 (Constant) 2.109 .663 3.179 .002
PMIS user knowledge .339 .169 .204 2.007 .048
Licensed under Creative Common Page 326 From the data in the above table the established regression equation was Y=2.109+0.339X1.
From the above regression equation it was revealed that I-PMIS user knowledge output is statically significant in influencing the project performance with p- value less than 0.05 (0.002).Null hypothesis was rejected. This concurs with findings of Hyojo, (2016) who stated that user knowledge of the I-PMIS both to individual and organizations are guaranteed better project performance.
CONCLUSION AND RECOMMENDATIONS
The study concluded on the influence of integrated project performance on project performance. One of the objectives was to determine the influence of project management information system software efficiency , establish the influence of quality information output, assess the influence Project Management Information System user Knowledge and lastly establish influence Project Management Information System on project cost, time, and risk control on performance of construction projects in South Rift, Kenya.
Based on the findings of this study, the following recommendations were made: Construction companies in South Rift to achieve levels of efficiency and effectiveness in construction projects, the management of the company must ensure adoption of the use of integrated project management information system. Construction companies’ project management information system must provide relevance, accurate and secure information that will enable the project team to carry out their tasks efficiently and effectively. It is not the complexity of the software that matters but the reliability and comprehensiveness of the information generated by the system and the ability of the user to use the information to manage the development projects. This information helps the users to perform their tasks in a much professional manner. When tasks are best performed project success is achieved. Lastly, it is recommended that project management information system success models should continue to be validated and challenged, the results of this research showed that the user knowledge of project management information system is in fact advantageous to construction projects in South Rift Counties, Kenya.
REFERENCES
Ahlemann, F. (2009).Towards a conceptual reference model for project management information systems. International Journal of Project Management, 27(1), 19-30.
Amami, M., Beghini, G., & La Manna, M. (1993).Use of project-management information system for planning information-systems development projects. International Journal of Project Management, 11(1), 21-28
Licensed under Creative Common Page 327 Bichanga, W. O., & Karani, S. R. (2012). Effects of Total Quality Management implementation on business performance in service institutions: A case of Kenya Wildlife Services. International Journal of Research Studies in Management, 1(1).
Brady, M. (2008). The Good Research Guide: For Small-Scale Social Research Projects Martyn Denscombe The Good Research Guide: For Small-Scale Social Research Projects Open University Press Edition:. Nurse Researcher, 15(2), 88-88.
Cavalieri, S., Terzi, S., & Macchi, M. (2007). A Benchmarking Service for the evaluation and comparison of scheduling techniques. Computers in Industry, 58(7), 656-666.
Cheung, S. O., Suen, H. C., & Cheung, K. K. (2004). PPMS: a Web-based construction Project Performance Monitoring System. Automation in Construction, 13(3), 361-376.
Cleland, D. I., & King, W. R. (n.d.).Project Owner Strategic Management of Projects. Project Management Handbook, 165-188.
Dang, C. N., Le-Hoai, L., & Lee, Y. (2012). Critical Success Factors of Large Design-Build Projects in Vietnam. Journal of Construction Engineering and Project Management, 2(3), 30-39.
Executive Project Management Structure and the Challenges Facing its Adoption in the Nigerian Construction Industry.(2013). International Journal of Architecture, Engineering and Construction, 2(3).
Fugar, F. D., &Agyakwah-Baah, A. B. (2010).Delays in Building Construction Projects in Ghana. Construction Economics and Building, 10(1-2), 103.
Gelbard, R., Pliskin, N., &Spiegler, I. (2002).Integrating system analysis and project management tools. International Journal of Project Management, 20(6), 461-468.
Hair, J. F. (2007). Research Methods for Business. New York, NY: Wiley 2007.
Hall, M., & Tomkins, C. (2001). A cost of quality analysis of a building project: towards a complete methodology for design and build. Construction Management and Economics, 19(7), 727-740.
Han, S. H., Kim, D. Y., Kim, H., & Jang, W. (2008).A web-based integrated system for international project risk management. Automation in Construction, 17(3), 342-356
Havelka, D., & Rajkumar, T. M. (2006).Using the Troubled Project Recovery Framework: Problem Recognition and Decision to Recover. e-Service Journal, 5(1), 43-73.
Herroelen, W. (2009).Project Scheduling-Theory and Practice. Production and Operations Management, 14(4), 413-432
Hillebrandt, P. M. (2000). Economic Theory and the Construction Industry.
Hillman, A. J., & Keim, G. D. (2001). Shareholder value, stakeholder management, and social issues: what's the bottom line? Strategic Management Journal, 22(2), 125-139.
Hjelt, M., &Björk, B. (2007). End-User Attitudes toward EDM Use in Construction Project Work: Case Study. Journal of Computing in Civil Engineering, 21(4), 289-300.
Iyer, K. C., & Banerjee, P. S. (2016). Measuring and benchmarking managerial efficiency of project execution schedule performance. International Journal of Project Management, 34(2), 219-236.
Kahura, M. N. (2013). The Role of Project Management Information Systems towards the Success of a Project: The Case of Construction Projects in Nairobi Kenya. International Journal of Academic Research in Business and Social Sciences, 3(9).
Karani, S. R., &Bichanga, W. O. (2012). Effects of Total Quality Management implementation on business performance in service institutions: A case of Kenya Wildlife Services. International Journal of Research Studies in Management, 1(1).
Khazanchi, D., & Reich, B. H. (2008). Achieving IT project success through control, measurement, managing expectations, and top management support. International Journal of Project Management, 26(7), 699.
Lategan, L., Lues, L., & Friedrich-Nel, H. (2011).Doing Research.
Lee, S., & Yu, J. (2011).Critical Success Factors for Project Management Information System in Construction. Journal of Construction Engineering and Project Management, 1(1), 25-30.
Licensed under Creative Common Page 328 Lind, A.D., Marchal, G.W., &Wathen, A.S. (2012).Statistical techniques in business & economics (15th Ed.). New York, USA: McGraw-Hill/IrwinLocke, E.A., & Latham, G.P (2006). New directions in goal-setting theory. Retrieved October 27, 2016,
Lunenburg, F.C. (2011). Goal-setting theory of motivation.International Journal of Management, Business, and Administration, 15(1), 1-6.
Lunsford, R.T., & Lunsford, R.B. (1995). The research sample, part 1: Sampling. Journal of Prosthetics and Orthotics, 7(3), 105-112.
Lupaşc, A. (2017). Project Management Information System Based on Web Technologies.
Martinelli, R. J., & Milosevic, D. Z. (2015).Project Management Toolbox.
Mönch, L. (2007). Simulation-based benchmarking of production control schemes for complex manufacturing systems. Control Engineering Practice, 15(11), 1381-1393.
Mudzana, T., &Maharaj, M. (2015).Measuring the success of business-intelligence systems in South Africa: An empirical investigation applying the DeLone and McLean Model. SA Journal of Information Management, 17(1).
Nel, D., Van Heerden, G., Chan, A., Ghazisaeedi, M., Halvorson, W., &Steyn, P. (2011). Eleven years of scholarly research in the Journal of Services Marketing. Journal of Services Marketing, 25(1), 4-13.
New Products, New Solutions: Making Portfolio Management More Effective. (2001). Journal of Product Innovation Management, 18(1), 52-53.
Ng, S., Palaneeswaran, E., & Kumaraswamy, M. M. (2002).A dynamic e-Reporting system for contractor's performance appraisal. Advances in Engineering Software, 33(6), 339-349.
Nitithamyong, P., & Skibniewski, M. J. (2004). Web-based construction project management systems: how to make them successful? Automation in Construction, 13(4), 491-506.
Oke, A. E., &Ugoje, O. F. (2013). Assessment of rework cost of selected building projects in Nigeria. International Journal of Quality & Reliability Management, 30(7), 799-810.
Pillai, A., Joshi, A., &Rao, K. (2002). Performance measurement of R&D projects in a multi-project, concurrent engineering environment. International Journal of Project Management, 20(2), 165-177.
Rajapakse, R. (2017). Construction Management. Construction Engineering Design Calculations and Rules of Thumb, 411-428.
Raymond, L., & Bergeron, F. (2008). Project management information systems: An empirical study of their impact on project managers and project success. International Journal of Project Management, 26(2), 213-220.
Riņģis, M., & Bērziša, S. (2016).Efficiency Measurement of Project Management Software Usage at State Social Insurance Agency. Information Technology and Management Science, 19(1).
Saurin, T. A. (2017). Removing Waste While Preserving Slack: The Lean and Complexity Perspectives. 25th Annual Conference of the International Group for Lean Construction.
Sibiya, M., Aigbavboa, C., &Thwala, W. (2015). Construction Projects’ Key Performance Indicators: A Case of the South African Construction Industry. ICCREM 2015.
Software Project Management: Methods and Techniques. (2004). IEEE Transactions on Engineering Management, 51(3), 375-375.
Theory-Generating Methods.(2011). Statistics in Psychology Using R and SPSS, 471-519.
Tsai, C. (2014). Integrating Social Capital Theory, Social Cognitive Theory, and the Technology Acceptance Model to Explore a Behavioral Model of Telehealth Systems. International Journal of Environmental Research and Public Health, 11(5), 4905-4925.
Ugwu, O., & Haupt, T. (2007).Key performance indicators and assessment methods for infrastructure sustainability— a South African construction industry perspective. Building and Environment, 42(2), 665-680.
Urbach, N., & Müller, B. (2011).The Updated DeLone and McLean Model of Information Systems Success. Information Systems Theory, 1-18.
Wang, E. T., Chang, J. Y., Jiang, J. J., & Klein, G. (2011).User advocacy and information system project performance. International Journal of Project Management, 29(2), 146-154.
Licensed under Creative Common Page 329 Ward, R. (n.d.). Engineering management: past, present, and future. Technology Management : the New International Language.
Xiao, H., & Proverbs, D. (2012). An Investigation into Factors Influencing Construction Costs Based on Japanese, UK and US Contractor Practice. Australasian Journal of Construction Economics and Building, 2(2), 27.