A Goal-driven Risk Management Approach for Distributed
Agile Development Projects
Suprika Shrivastava
Department of Information Systems and Business Analytics Deakin Business School
Deakin University Australia
Urvashi Rathod
Symbiosis Centre for Research and Innovation Symbiosis International (Deemed University) Lavale, Mulshi Taluk, Pune
Maharashtra, India
Abstract
Software companies are now using Distributed Agile Development (DAD) in order to create high quality solutions, which aligns with the business priorities of lesser time and cost. Although, DAD is beneficial, there are significant risks involved in such projects. In order to minimize the adverse effect of risks on DAD projects, it is imperative to understand, how the
risks impact the project performance goals including ‘Time’, ‘Cost’ and ‘Quality’. In this paper we present a goal driven approach for managing risks in DAD projects. This approach of risk management will enable project managers to identify the most important risks with respect to the goal to be achieved and focus on managing those risks first. The study shows that if ‘Time’
is a considered goal for a DAD project, the most important risks that would need consideration are related to requirement management, architecture changes and coordination issues
between stakeholders. Similarly, if ‘Quality’ is the primary performance goal in a DAD project,
it would be necessary to first deal with risks related to internal and external communication in the organization, team collaboration and requirement documentation availability. The awareness of top-ranking risk factors that impact a particular project goal will assist the projects managers to control the risks in a way that the desired project goals can be achieved. Keywords: Distributed Agile Development (DAD), Agile project management, Goal driven risk management in Distributed Agile Development, Project Constraints, Time, Cost, Quality, Goal driven risk management
1
Introduction
characterized by spatial distance, temporal distance and cultural difference (Krishna, Sahay & Walshman, 2004) is antithetical to the agility principles of face to face communication, collocated teams, customer involvement, frequent software delivery and self-organized teams (Dyba & Dingsøyr, 2008). This contrast is manifested by the DAD Risk factors found to be emerging from poor communication among the stakeholders, lack of collaboration between the team members, low customer involvement, poor software development practices, differences in development standards among the teams and dependency among teams etc. (Shrivastava & Rathod, 2014; Dorairaj & Noble, 2013; Balasubramanium et al., 2006). The inability to identify and control project risks lead to poor knowledge of requirements and the development of a low value system, which negatively impacts the project performance (Wallace & Keil, 2004).
Performance of a project is generally assessed in terms of the extent to which it could meet the goals such as the project cost, development schedule and the product/outcome quality (Westerveld, 2003; Islam, Mouratidis & Weippl, 2014). Attainment of project goals needs appropriate ways to control the risk factors from obstructing the project activities. While research studies in the past have addressed the management of risks in traditional projects (Islam et al., 2014; Kontio, 2001), there is a lack of related work for DAD projects. Considering the aforesaid conflict between the basic premises of DSD and agile approaches, the risks emerging from their merger in DAD approach are expected to affect the project goals and therefore, it is reasonable to find the most impactful risks experienced in practice. In this study,
we determine the risk factors as perceived by the practitioners to impact project goals, ‘Time’, ‘Cost’ and ‘Quality’ in DAD projects.
For this work, the researchers used the list of the DAD risk factors from the earlier studies (Balasubramaniam et al., 2006; Herbsleb, 2007; Mattsson et al., 2010; Mudumba & Lee, 2010) and asked the practitioners playing different roles in DAD projects, through two-staged survey to rank their impact on the project goals of “Time”, Cost” and “Quality”. The analysis
of survey responses revealed that the risk factors have statistically significant perceived impact on the project goals of Time and Quality. This implies that the DAD risks directly lead to the project delays and poor-quality releases, which in turn, may have an indirect effect on the project cost. The identified DAD risk factors having significant impact on project goals are used as inputs to the goal driven risk management (GSRM) approach for managing risks in DAD projects.
In this research, GSRM, which was implemented by Islam et al. (2014) for managing risks in traditional projects, has been introduced for managing DAD risks effectively for attaining the desired project goals. This will enable the project teams to control specifically those risk factors that impede the achievement of the specific goal that is necessary to be attained for the success of the project. The work also reveals the areas of concern in DAD that influence the project outcomes and it opens up the avenues for further research on devising the solutions and mechanisms for managing DAD risks and deriving the relevant hypotheses, principles and theories for managing the complex phenomenon of DAD.
2
Literature Review
2.1
Distributed Agile Development (DAD)
In the recent years, organizations are becoming globalized and developing software using virtual teams. This type of development where team members are located in remote sites during software development are called Distributed Software Development (DSD) (Jim´enez,
Piattini, & Vizca´ıno, 2009). Companies are applying Agile practices in distributed environments for software development and are able to get benefits like reduce the time to market, less cost and improved quality (Therrien, 2008; Krutchen, 2011). Although, this kind of development, also known as Distributed Agile Development (DAD), has advantages but also involves significant risks (Mattsson et al., 2010; Persson, Mathiassen & Aaen, 2012). The risks in DAD projects occur due to opposing properties of Agile and distributed development. DAD projects are characterized by spatial, temporal and cultural difference between distributed teams which makes effective agile implementation challenging.
2.2
Project Risk and Distributed Agile Development
In the context of projects, risks can be defined as uncertain events or conditions that, if occur, have a positive or negative effect on at least one of the project objectives such as time, cost, scope or quality (Project Management Institute, 2017). Risk management involves, risk identification, risk analysis, developing risk response strategies, monitoring and controlling risks to determine if they have changed (Kerzner, 2017). A risk factor can be defined as a situation that can present a serious threat to the success of a software development project (Schmidt, Lyytinen, Keil & Cule, 2001). Number of risks are involved in DAD projects like poor communication between team members and with the client, lack of trust among team members, unclear requirements and lack of documentation, design changes and consistency in development standards, difficulties in release and deployment management (Mattsson et al., 2010; Shrivastava & Rathod, 2014; Balasubramaniam et al., 2006; Paasivaara M.S. Durasiewicz, S., & Lassenius, D.C. 2008). Although, studies have explored these risks and have suggested appropriate methods to control the risks (Hossain, Babar, Paik & Verner, 2009; Mudumba & Lee, 2010; Shrivastava & Rathod, 2014; Shrivastava & Rathod, 2017) there is still a need to view the risks in light of the goals that define the success of the project.
2.3
Risk and Project Performance
Studies have revealed that software development projects suffer due to the occurrence of risks as they lead to poor software performance, cost overruns, schedule delays, unmet requirements and production of systems giving less value to the business (Wallace, Keil and Rai, 2004; Barki, Rivard, & Talbot, 1993). Success of a system can be measured through various dimensions including, system development process, system use, system quality, individual impact and organizational impacts (Saarinen, 1996). Hence system success can be classified into – business outcomes (impact to individuals and organizations), technical or system performance, efficiency (project operation in terms of cost, time and productivity), user satisfaction, IS personal satisfaction (Saarinen, 1996). Another study by Misra, Kumar &
Project performance is defined as “the degree to which the software project achieved success
in the perspective of process and product” (Nidumolu, 1995). Performance of a software can be measured in terms of key performance indicators including time, cost, scope and quality of software projects (Agarwal & Rathod, 2006; Cullen & Parker, 2015). In the project management
context, ‘Scope’ refers to the functionality of the product or a service that the project aims to
deliver, ‘Time’ refers to the time that will be used for completing the project, ‘Cost’ is the
expected cost to complete the project (Schwalbe, 2016, pp. 7-9). These three criteria are also
presented as constraints on the ‘iron triangle’ and are often competing in nature due to which
they need to be balanced for the project to succeed (Schwalbe, 2016, pp. 7-9). Along with the basic elements of the iron triangle, the fourth key goal in project is to achieve good ‘Quality’ and usually relates to customer satisfaction. Quality in projects refers to ‘development of a
product that has a measurable value for those who produce it and who use it’ (Pressman &
Maxim, 2015).
In this study we have focused on the project performance goals including, time, cost and quality because, agile teams adjust the functionality (scope) of the project in order to deliver faster and with better quality (Coram & Bohner, 2005), (Lee & Yong, 2010). Risks occurring in software projects impact these goals, leading to failed or challenged projects (Parker, Parsons & Isharyanto, 2015). The inability of the project team to identify and manage the important risks that related to the most critical project goal is a major reason for project failure. It is imperative for project teams to get a good understanding of risks when aiming to achieve a particular goal, and hence select the appropriate risk management strategies to achieve project success (Wallace, Keil & Rai, 2004).
2.4
Theoretical Consideration
The purpose of this work is to provide support to the community of practitioners and researchers for identifying and managing DAD risks for the achievement of the success goals of the project. Identification of high impact DAD risks with respect to the project goals is based on the prior research (Kontio, 2001; Mattsson et al., 2010; Islam et al., 2014; Jiang & Klein, 2000)
and the practitioners’ perception. We have used Goal driven Risk Management (GSRM) framework (Islam et al., 2014) in order to study risks in DAD projects while considering the performance goals that are important for project success.
The GSRM framework adopts a goal and obstacle approach from KAOS (Knowledge Acquisition in Automated Specification) goal modelling (Lamsweerde, 2000). KAOS is a methodology for software requirement engineering and the key concept underlying the KAOS
is the ‘Goal’ (Dardenne, Fickas, Lamsweerde, 1991). Goal is an objective that has to be met by the composite system. A goal is nonoperational because it cannot be described exclusively in terms of objects and actions of the composite system. However, goals can be operationalized by being translated into constraints, which when resolved, contributes to the achievement of the goal (Dardenne et al., 1991). An extension of the KAOS goal modelling language has been used to formulate a Goal driven Software Development Risk Management Model (GSRM) (Islam et al., 2014), for performing risk management in traditional software projects. These project goals of Time, Cost and Quality can be operationalized in to the constraints such as
From this perspective, we decided to operationalize the GSRM framework through this study for identification of the DAD risk factors relevant to specific project goal and hence, subsequent management of risk factors for ensuring the success of DAD project.
At a high level, GSRM framework has four layers to support software risk management. Every layer is composed of suitable tasks, methods and techniques to manage risks. The first layer in
the model, the ‘Goal layer’ focuses on the factors or criteria that contribute towards the project success. These goals define what needs to be done in order to achieve success and who will be
responsible to achieve the goals (Dardenne et al., 1991). In our study, the ‘goals’ refer to the
project performance goals including, time, cost and quality that DAD projects aim to achieve. The goals can be fine grained into sub goals, but for this initial study, we will address the GSRM framework considering only high-level performance goals. Further, an ‘Agent’
performs appropriate actions in a way that project goals can be achieved (Dardenne et al.,
1991). In the context of this study we refer to the ‘DAD project team’ or a ‘Project Manager of the team’ may act as an ‘Agent’ to control the project risks.
The second layer is the ‘Obstacle layer’ which refer to the main causes that reduce the ability to achieve single or multiple goals. The DAD risk factors that have been found in this study to have a high impact on a particular performance goal relate to the ‘obstacles’ because they can
pose a threat to the attainment of the specific project goal. The third layer is the ‘Assessment layer’ that quantifies the severity of impact of the risk factors on the goals. In the context of
this study, we have found the perceived impact of the risk factors on each of the considered performance goals separately. After performing analysis on the data, we have been able to identify the top 7-8 statistically significant risk factors that have high impact on each of the considered goal separately.
The GSRM framework, identifies ‘risk events’ as consequence of single or multiple risk factors.
Islam et al., (2014) used risk events in order to reduce the number of raw risk factors being analysed. In the second phase of our study, we reduced the number of risk factors under analysis by considering the risk factors that had statistically significant ranking of their impact on project goals. Hence, it was not required to further reduce the risk factors by considering the risk events in our study. We assessed the reduced number of risk factors to identify the top-ranking factors that impact each of the considered project goals. Further, as per the GSRM framework, one risk factor may have an impact on multiple goals, and we have similar findings in our study as well which are discussed later in section 5 (Data analysis and Results).
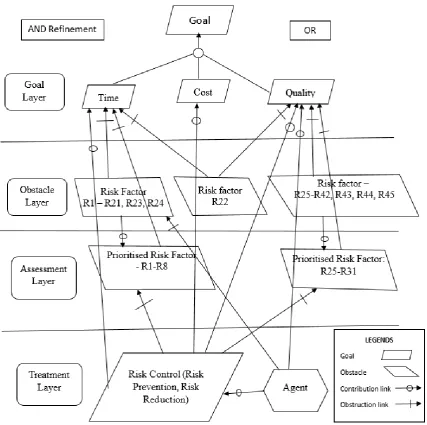
The fourth layer is the ‘Treatment layer’ that focuses on the control action to be taken to reduce
the impact of the risks that impact the project goals. For this study, the appropriate controls identified in an earlier work (Shrivastava & Rathod, 2014) for managing the considered DAD risks have been included. The implementation of GSRM framework using KAOS modelling for risk management in DAD projects is shown in Figure 1. We have used the same notation as used in the GSRM framework for goals (parallelogram) and obstacles (reverse parallelogram) as used in KAOS model. Obstacles (risk factors) are linked to the goals through obstruction links. The treatment layer also has an agent who bears the responsibility to implement the actions to control risks.
2.5
Related Studies
have explored risks occurring in traditional software projects and have also suggested various approaches that can be used to control those risks (Schmidt et al., 2001; Barki et al., 1993; Keil, Cule, Lyytinen & Schmidt, 1998; Junior & Carvalho, 2013). These studies have identified risks like technological newness, lack of expertise, requirement risks, planning and controlling risk, personal and staffing risks, etc. Wallace & Keil (2004) have asserted the importance of risks for ensuring desired project outcome and identified and related risks in software projects to process outcome including project completion time, within budget and product outcome like scope and requirements fulfilment. Further, the relationship of risks with project performance has also been explored in the works of (Han & Hung, 2007; Na, Simpson, Li, Singh & Kim, 2007; Wallace, Keil & Rai, 2004; Jiang & Klein, 2000). Jian and Klein (2000) suggest that there are number of performance criteria like user satisfaction, quality, cost/ benefit analysis, on time completion (time), team effectiveness that define the project success. Chow & Cao (2008) have explored the success factors in agile projects such as team capabilities, agile engineering methods, and agile delivery strategy, which also fall in the success category of time, cost, scope and quality of the project. This is an important area for advancing the knowledge of risk management because different risks impact various dimensions of project success differently (Jian and Klein, 2000). For example – lack of user experience causes less usable system, an aspect of quality. Jian and Klein (2000) say that there is a need to develop a linkage between the risks with various dimension of project success. This study examines the effect of risks on project effectiveness, a dimension of project performance, measured through various aspects such as project budget, schedules, quality of work and operational efficiency. Different risks will have different impact on the aspects of project success and therefore, the approach for managing a risk must be selected carefully (Jian and Klein, 2000).
Research studies that have explored on risk factors in agile development impacting the project success include (Bass, 2016; Sheffield & Lemetayer, 2013; Coram & Bohner, 2005). A number of research studies have also explored the risks occurring in DAD projects (Jalali & Wohlin, 2010; Hossain et al, 2009; Mudumba & Lee, 2010; Mattsson et al., 2010; Paasivaara & Durasiewicz & Lassenius, 2009). Further work in identification of the most important risks in DAD projects and the most frequently used methods to manage those risks have been done by (Shrivastava & Rathod, 2014; Shrivastava & Rathod, 2017). Although, there are studies that have viewed risks from the perspective of project success dimensions or project goals (Islam et al., 2004; Jian and Klein, 2000), there is rare evidence of similar work being done in the area of risk management in DAD projects. This research contributes by developing the linkage between the risk factors in DAD projects and the project performance goals including time, cost and quality. The findings of this study equips project managers managing DAD projects with the most important risks to be considered to be controlled when attainment of one of the project goals is critical for the project.
3
Research Objectives
managers can then use appropriate controls to reduce the impact of those considered risks and hence, increasing the chance of project success. In order to achieve the above-mentioned research objectives, we addressed the following Research Questions:
1. What are the risk factors having a high impact on the performance goal ‘Time’ in DAD projects?
2. What are the risk factors having a high impact on the performance goal, ‘Cost’ in DAD projects?
3. What are the risk factors having a high impact on the performance goal, ‘Quality’ in DAD
projects?
4
Research Methodology
This descriptive study aims to determine the extent to which a risk factor impacts a particular project performance goal in a DAD project with respect to other risk factors (Cooper & Schindler, 2006). DAD practitioners were provided with a list of DAD risk factors found in earlier research and were asked to rank the ones, which are perceived by them to impact each of the project goals of Time, Cost and Quality. Data collection has been done using a two-part survey-based approach. Survey research is a quantitative method, concerned with either relationships between variables, or presenting descriptive findings about a population (Pinsonneault & Kraemer, 1993). As we intended to find out the perceived impact of stated DAD risks on each of the project goals from a set of practitioners involved in DAD projects, we believe that survey-based approach was suitable for this study. We used purposive sampling for this research to ensure that we obtained responses based on the experience of the respondents in DAD projects.
Questionnaire used in Part - I of the study was designed to find out the perceived impact of the DAD risk factors on each of the considered project goals. Questionnaire used in Part - II of the study was based on the analysis of data collected in Part - I of the research and was used to find out the rank of the risk factors in terms of their impact on a particular project goal. The analysis of the data collected through both surveys will enable us to prioritize the risk factors corresponding to each project goals depending upon the amount of impact they have on that project goal.
4.1
Data Collection and Analysis for Survey Part
–
I
The questionnaire used for survey Part - I was pilot tested by sending to 25 experts and we obtained response from 11 experts, giving a response rate of 44%. These experts included nine practitioners and two academics who had significant experience in the field of software engineering. The revised questionnaire was designed to collect the ranking data about the perceived impact of risk on each of the project goals, namely, time, cost and quality. In survey questionnaire for survey Part - I, we enlisted previously identified, 44 risk factors from earlier research (Shrivastava & Rathod, 2014) that occur in DAD projects. For each of the risk factor we obtained a rank (1/2/3) for each of the project goals namely, Time, Cost and Quality depending on the extent to which that risk factor is perceived to impact the project goals. The respondents were required to provide a rank for the perceived impact of each risk factor on
the project goal on a scale of ‘1’,’2’, ‘3’ referring to ‘high impact’, ‘moderate impact’ and ‘low impact’. We contacted 107 practitioners with DAD experience, and obtained 56 responses,
Director/Director (10), Chief Executive Officers (CEO) (2), Team Lead (7), Developers (7), Quality Analyst/Testers (3), Business Analyst (1), Architects (2), and Product Owner(1). The respondents belonged to Australia, India, Japan and the USA. The questionnaire was sent by email to the respondents and the reply was also received by email. We applied Kendall’s test
of Concordance on the ranking data of the project goals for each risk factor in order to find out the level of concordance of the responses on the findings. Kendall’s test also helped us to find out the statistical significance of the average ranks for the project goals for the impact of each risk factor. These average ranks were used to find out the project goals being impacted the most by a risk factor.
We chose only those DAD risk factors for further study, whose perceived impact on individual project goal has been found to be statistically significant and subsequently, the mean ranks were low (high impact) and the concordance were high. We used statistical significance (p = 0.01) to find out the generalisability of the findings. Based on the mentioned criteria we eliminated certain risk factors from each set of the DAD risk factors, which have been perceived to have low impact on a particular project goal of DAD projects. We then used the selected risk factors to formulate the questionnaire for survey part II.
4.2
Data Collection and Analysis for Survey Part
–
II
As mentioned in the previous section, survey Part - II questionnaire was formulated based on the research findings of survey Part - I of the study, which included separate lists of risk factors
impacting ‘Time’ and ‘Quality’ as project goals. As none of the risk factors were perceived to
have a high impact on cost, we could not enlist the factors relating directly to ‘Cost’ as a project
goal. We listed the set of risk factors, found to have statistically significant impact on the project Time, and asked the practitioners to rank them in terms of their perceived impact on the project constraint of completion on Time. The respondents were asked to rank the risk
factors on a scale of 1 to 8 with rank ‘1’ was given to the risk with highest impact on time, rank ‘2’ given to the risk factor with comparatively lesser impact, ‘3’, ‘4’,’5’,’6’,’7’ ranks were given
to risks as their impact goes on reducing and rank ‘8’ given to the risk factor with lowest impact
on time. No two or more risk factors were given same rank.
Same approach was used to obtain the ranks for risk factors impacting quality (7 risk factors). These risks were to be given ranks on a scale of ‘1’ to ‘7’ with ‘1’ signifying highest impact of a risk factor on quality and ‘7’ signifying ‘lowest impact’ of the risk factor on quality. All other ranks from ‘2’ to ‘6’ were given to risk factor in the order of reducing impact on the quality. No two or more risk factors were allocated same ranks. We used Qualtrics platform to make the survey available online.
We contacted 82 practitioners and received response from 65 of them, hence a response rate of 79.2%. We did not get response from 15 people and 2 of them refused to participate. We
applied Kendall’s test of Concordance (W) on the ranking data for risk factors collected
through this survey. The test was applied separately for risk factors related to the time and quality respectively. We then used the average rank and the statistical significance (p-value <= 0.01) to decide about risk factors that have maximum impact on the project Time, and the ones that have high impact on Quality. Statistical significance (p-value <= 0.01) was used to decide
about the generalisability of the research findings. The coefficient of Kendall’s W was used to
4.3
Relevance of questionnaire to research objectives to theoretical
consideration
The survey questionnaires were designed with the aim to analyse risks impacting DAD projects while focusing on the project goals that are important for the project success. In the questionnaire for survey Part - I, we obtained the ranks for risk factors’ impact on all the three project goals separately, ’Time’, ‘Cost, and ‘Quality’. This step helps us to formulate the ‘Obstaclelayer’ of the GSRM framework, which corresponds to risk factors impacting project
goals and form connections with the ‘Goal Layer’ of the framework.
In the questionnaire for survey part II, we obtained the ranks for the risk factors corresponding to each of the project goal depending upon the severity of impact the risk factors on that project goal. The goal driven approach followed in the study enabled us to segregate risk factors that
impact project goal, ‘Time’ and also identifying the factors with comparatively higher ranks in terms of severity of impact on the project schedule. Similar results for risk factors impacting
‘Quality’ was also obtained. Evaluation of risk factors based on the severity of impact on the
project goals helped us to lay out the ‘Assessment layer’ of the GRSM framework which consists of prioritised risk factors depending on the extent to which they impact each of the considered project goals. The risk factors that are forming a part of the Assessment layer are considered for further analysis to implement relevant risk control. This step also aligns with
the formation of the ‘Treatment Layer’ of the GSRM framework. The risk control approaches
suggested in this paper are based on an earlier study in this area (Shrivastava & Rathod, 2014). Hence, the two-part survey questionnaires together, assist us to implement the GSRM framework for performing risk management in DAD.
5
Data Analysis and Results
We provide the analysis of survey part I and survey part II in this section.
5.1
Survey Part I Data analysis
We applied Kendall’s test on the ranking of project outcomes for each risk factor that produced Kendall’s coefficient of Concordance (W), value of observed significance level (p-value) and the mean rank of each of the project outcomes, namely, Time, Cost and Quality corresponding
to each of the risk factors. Kendall’s coefficient ranges from 0 to 1, where 0 reveals perfect
disagreement and 1 reveals perfect agreement (Gibbons, 1993). 5.1.1 Data analysis for Risk Factors impacting Project ‘Time’
We then extracted all the risk factors with the mean ranks for their impact on project outcome,
‘Time’, was less than the mean ranks for the project outcomes ‘Cost’ and ‘Quality. This helped us to identify the risk factors that have a high impact on the ‘Time’ of the project. There were 23 risk factors that were perceived to be having a high impact on project as compared to the other two project performance goals, Quality and Cost as shown in Table 1. The risk factors in Table 1 are listed in the increasing order of mean ranks for the project goal ‘Time’. The average of the mean ranks for the project outcome ‘Time’ for these risk factors (Table 1) was 1.75. There
were 9 risk factors with the p-value of less than 0.01 and hence their ranks for impact on the project goal ‘Time’ can be generalised. These risk factors also have good Kendall’s coefficient
of concordance (above 0.09) as compared to the other factors listed in Table 1, indicating that the responses agree with each other. It can be observed that the risk factors impacting project
Some are related to poor management of requirements and inadequate requirement
prioritization. One of the risk factors, namely, ‘No common Definition of Done between the distributed teams’, had the same rank for the project goal, Time and Quality, indicating that the amount of impact on the two project goals ‘Time’ and ‘Quality’ is the same. Hence this
factor has been listed to be impacting both project time (Table 1) and quality (Table 2). This aligns with the GSRM framework that states that a particular risk factor may more than one goal (Islam et al. 2014).
5.1.2 Data Analysis for Risk factors impacting ‘Quality’ of the project.
We then extracted all the risk factors having the mean rank for their impact on project outcome,
‘Quality’ relatively less than the mean ranks for ‘Time’ and ‘Cost’. This gave us a list of 21 factors, considered to be having a high impact on the ‘Quality’ of the project as shown in Table 2. We now considered the risk factors with p-value less than 0.01 which gave us a list of 7 risk
factors. The average of the mean ranks for the project outcome ‘Quality’ for the selected 7 risk factors was 1.68. The Kendall’s coefficient of concordance for these 8 risk factors is also greater than 0.09, which is higher than the concordance for all other risk factors related to the quality, as shown in Table 2, indicating a reasonable amount of concordance among the respondents. The top 7 risk factors in Table 2 are also related to the lack of communication between the team and the other stakeholders. Risks related to poor software development, testing and design standards are also impacting the software quality.
5.1.3 Data Analysis for Risk factors impacting ‘Cost’ of the project
There were no risk factors with highest value of mean rank for the project outcome ‘Cost’ as compared that of ‘Time’ and ‘Quality’. Hence, we could not categorise any risk factor to be having maximum impact on the project performance goal ‘Cost’. Since these three success criteria, namely, time, cost and quality are not mutually exclusive, the impact of risks on project time or quality will have an impact on the project cost as well (Schwalbe, 2016, pp. 9). So, we anticipate the practitioners do not consider risks highly and directly impacting project cost. Hence, Survey Part - II was focussed on understanding how risks impact ‘Project Time’ and ‘Project Quality’ in DAD project and did not include ‘Project Cost’ for further data collection and analysis.
Risk Factor
No.
Risk Factor
Mean Rank -Time
Mean rank - Cost
Mean rank - Quality
Kendall’s
W
Observed p-value
R1
Inadequate Prioritization of Requirements.
(large project scope; multiple backlogs handled by multiple product owners)
1.71 1.90 2.39 0.187 0.000
R2 Lower Initial Velocity (DAD teams
take time to build trust) 1.72 2.13 2.15 0.108 0.003
R3
Rework caused by Architectural Changes (frequent requirement changes)
1.75 1.87 2.38 0.220 0.000
R4
Poor Coordination between Different sites. (difficult to synchronize and integrate different activities)
Risk Factor No. Risk Factor Mean Rank -Time Mean rank - Cost Mean rank - Quality Kendall’s W Observed p-value R5
Requirement conflicts amongst multiple, geographically dispersed Product Owners
1.75 2.07 2.18 0.093 0.009
R6 Inappropriate User Story Estimates
with Multiple Vendors. 1.77 1.83 2.40 0.228 0.000
R7
Dependency on Third Party for solution development leading to coordination problems between them.
1.75 2.10 2.15 0.094 0.006
R8
Lack of Communication Infrastructure. (connectivity problems and slow network which hampers the scrum meetings)
1.75 2.11 2.14 0.090 0.008
R9
Difficulty in System Release
Management and Deployment (difficult to synchronize different distributed teams)
1.76 2.11 2.12 0.078 0.016
R10
Poor Coordination between Multiple Vendors involved in the solution development.
(especially if they are competing and have work dependencies between them)
1.79 2.21 2.00 0.122 0.003
R11
Losing on Time for End-to-End extensively Interdependent Transaction rich Test Cycle across distributed teams (applicable to transaction rich software application)
1.81 2.20 1.99 0.082 0.027
R12
Growth in Team Size or Development Site (leads to instability and hence reduction in productivity)
1.81 2.15 2.05 0.060 0.038
R13 Requirements Unclear to the Team 1.82 2.10 2.08 0.046 0.078
R14
Poor Collaboration between different sites. (understanding & appreciating the capability differences and reducing the gap by using technology)
1.85 2.27 1.88 0.103 0.004
R15 Ineffective stand up meetings. (culture
and language difference) 1.87 2.20 1.94 0.051 0.057
R16
Higher Interdependency between the teams. (system complexity and lack of communication between the distributed teams)
1.87 2.08 2.05 0.027 0.223
R17 Unavailability of Product Owner
(non-collocation or lack of time) 1.87 2.24 1.90 0.078 0.016
R18 Team Reorganizing in every sprint (due
to changes in market requirements) 1.88 2.05 2.07 0.024 0.286 R19 Unclear Project Objectives 1.88 1.90 2.22 0.067 0.023
R20
Risk in Code Integration with Multiple Vendors. (lack of common
understanding of requirements and interfaces)
1.89 2.13 1.99 0.030 0.236
R21
Unsuitability of Flat Communication Structure to Large Organization. (may expose the client to inexperienced team members)
Risk Factor No. Risk Factor Mean Rank -Time Mean rank - Cost Mean rank - Quality Kendall’s W Observed p-value
R22 No common Definition of Done between
the distributed teams. (to be removed) 1.95 2.09 1.95 0.012 0.518
R23 Underinvestment on Travel by the
Management. 1.96 2.05 1.99 0.005 0.802
R24 Difficult to execute Fixed Price Projects 1.97 1.98 2.06 0.006 0.789
Table 1: Survey Part 1- Analysis of the risk factors that impact the project outcome, ‘Time’ is as above (The scale for ranking used in the survey – High Impact= 1, Moderate Impact =2, Low Impact =3)
Risk Factor No. Risk Factor Mean Rank -Time Mean rank - Cost Mean rank - Quality Kendall’s W Observe d p-value R25
Poor Collaboration between Developers and Quality Assurance Members.
(especially if they belong to different distributed team)
2.05 2.35 1.59 0.271 0.000
R26
Unavailability of requirement documents for testing. (testers depend on their assumptions for testing)
2.09 2.28 1.63 0.187 0.000
R27 Inconsistency in design standards of
distributed teams. 2.07 2.27 1.65 0.167 0.000
R28
Cross Functional Teams insufficient for testing in large projects. (the
‘wholeteam concept’ may not be
sufficient for complex testing)
2.02 2.32 1.66 0.213 0.000
R29
Different software development practices and standards followed by multiple teams. (cultural diversity and lack of stakeholder support)
2.12 2.15 1.74 0.091 0.007
R30 Lack of Communication between the
Team and the Client (Product Owner) 2.03 2.22 1.75 0.111 0.003
R31
Uncommon Language (team members or client may not share a common language)
1.96 2.25 1.78 0.125 0.001
R32
Lack of Documentation since Agile downplay documentation (DAD projects need some minimum level of documentation to compensate for the informal team interaction)
2.01 2.21 1.78 0.083 0.012
R33
Technical Debts in the code. (deferred work which is not directly related to the functionality but is required for the overall quality of the system)
2.06 2.15 1.79 0.056 0.049
R34
Inappropriate Tool Selection
(Especially for practices like automated testing, code integration etc.)
1.99 2.20 1.81 0.079 0.014
R35
Using Component Teams instead of Feature Teams (e.g. GUI team or component X team) is unable to deliver end-to-end feature)
Risk Factor No. Risk Factor Mean Rank -Time Mean rank - Cost Mean rank - Quality Kendall’s W Observe d p-value
R36 Issues with Pair Programming
(distributed developers) 2.10 2.07 1.82 0.043 0.124
R37 Lack of Trust between the Onshore and
Offshore teams. 2.04 2.13 1.83 0.041 0.119
R38 Lack of communication between team
members 1.94 2.23 1.84 0.078 0.014
R39
Code Integration across multiple sites. (lack of common understanding of interface requirements between teams)
2.04 2.14 1.85 0.055 0.058
R40
Test data management involving test extraction from multiple databases is difficult. (small iterations in Agile and lack of test database automation)
1.87 2.26 1.86 0.094 0.008
R41 Lack of Uniformity in multisite Team’s
Capabilities (loss of productivity) 1.95 2.17 1.88 0.050 0.082
R42
Unavailability of Business Analyst (BA). (single BA is assigned to multiple teams)
1.96 2.14 1.90 0.029 0.213
R22 No common Definition of Done
between the distributed teams. 1.95 2.09 1.95 0.012 0.518
R43
Unavailability of Business Analyst (BA). (single BA is assigned to multiple teams)
1.96 2.14 1.90 0.029 0.213
R44
Inadequate communication about End User requirements (social context of end-user not understood)
2.01 2.03 1.96 0.003 0.850
R45
Lack of Trust between the Client and the Offshore team (it is difficult to customer expectations in short iteration)
1.97 2.07 1.96 0.008 0.672
Table 2: Survey Part 1 - Analysis of the risk factors that impact the project outcome, ‘Quality’ is as
below (The scale for ranking used in the survey – High Impact= 1, Moderate Impact =2, Low Impact =3)
5.2
Survey Part II Data Analysis
As stated before, we further eliminated risk factors from the list of factors obtained from survey Part - I results to create a survey questionnaire for survey Part - II. From the list of 23 risk factors impacting project Time in Table 1, we extracted the ones with p-value less than or equal to 0.01, which gave us a list of 9 risk factors. We further considered risk factors with difference in their mean rank for Time and the average of the mean ranks for the project
outcome ‘Time’ for all these 9 risk factors (1.75) was more than or equal to 0.1. This helped us to eliminate one more risk factor from a list of 9 factors and gave us a list of 8 risk factors. For these factors, it was observed that Kendall’s W value is also reasonably good, hence there was
concordance among the responses. These 8 factors were then used for designing the survey Part - II questionnaire.
Same process was applied to reduce the list of factors impacting ‘Quality’ as given in Table 2.
and the average rank of these 10 factors was more than 0.1. This led to a list of 7 risk factors which was included in the survey questionnaire part-II. All the risk factors impacting ‘Time’ and ‘Quality’ have been bold-faced in Table 1 and Table 2 respectively.
Risk Factor
No.
Ranking of Risk Factors based on the perceived impact on project time Mean ranks
R1 Inadequate Prioritization of Requirements.
(large project scope; multiple backlogs handled by multiple product owners) 3.31 R2 Rework caused by Architectural Changes (frequent requirement changes) 3.35 R3 Requirement conflicts amongst multiple, geographically dispersed Product Owners 3.74
R4 Poor Coordination between Different sites. (difficult to synchronize and integrate
different activities) 4.28
R5 Dependency on Third Party for solution development leading to coordination
problems between them. 4.52
R6 Inappropriate User Story Estimates with Multiple Vendors. 5.05 R7 Lower Initial Velocity (DAD teams take time to build trust) 5.59
R8 Lack of Communication Infrastructure. (connectivity problems and slow network
which hampers the scrum meetings) 6.15
Table 3 - Survey Part II - Ranking of Risk Factors impacting Project Time
Kendall’s W: 0.181; Observed p-value: 0.000
Risk factor
No.
Ranking of Risk Factors based on the impact on project quality Mean Rank
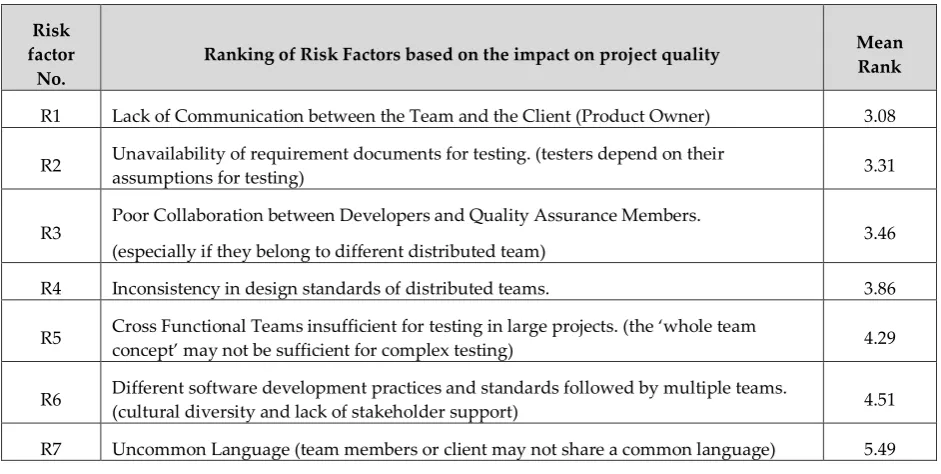
R1 Lack of Communication between the Team and the Client (Product Owner) 3.08
R2 Unavailability of requirement documents for testing. (testers depend on their
assumptions for testing) 3.31
R3 Poor Collaboration between Developers and Quality Assurance Members.
(especially if they belong to different distributed team) 3.46
R4 Inconsistency in design standards of distributed teams. 3.86
R5 Cross Functional Teams insufficient for testing in large projects. (the ‘whole team
concept’ may not be sufficient for complex testing) 4.29
R6 Different software development practices and standards followed by multiple teams.
(cultural diversity and lack of stakeholder support) 4.51
R7 Uncommon Language (team members or client may not share a common language) 5.49
Table 4 - Survey Part II - Ranking of Risk Factors impacting Project Quality
Kendall’s W: 0.150; Observed p-value: 0.000
As discussed in section 4 the questionnaire for Survey Part II was designed based on the results obtained from Survey Part I. We had a list of risk factors (8) that were perceived to be
impacting ‘Time’ the most and another list of 7 risk factors impacting ‘Quality’ the most in
DAD projects. Based on the extent to which the risk factors impact the project outcome, the
respondents were asked to rank the risk factors. Kendall’s test was then applied to the ranking data of risk factors for both the project outcomes, Time and Quality, separately. Kendall’s test
observed p-value for both set of risk factors impacting ‘Time’ and ‘Quality’ respectively. The detailed results of application of Kendall’s test on risk factors impacting project time is given in Table 3 and the results of applying the same test on risk factors impacting project quality is
given in Table 4. The mean ranks obtained for risk factors for the project outcome, ‘Time’ and for ‘Quality’ was statistically significant (p-value <= 0.000) indicating that the findings can be generalised. The risk factors in Table 3 and in Table 4 are listed as per the ranks given to the risks. The risk factors on the top of the list are the ones that have comparatively higher impact on the project outcome as compared to the ones with lower in the list.
6
Research Findings and Discussion
The success of software development project is assessed in terms of meeting the scope, schedule, cost and quality constraints of the projects (Chow & Cao, 2008; Attarzadeh & Ow, 2008; Agarwal & Rathod, 2006). Distributed Agile projects are able to reach project goals suffice the customer needs, but suffer from significant risks caused by the opposing nature of Distributed Development and Agile methods. These risks pose threat to the attainment of the project goals and in this work, we have found the risk factors that have a high impact on the project time and quality. The knowledge of risk factors impacting a specific project goal will be beneficial for the project manager and the team as it will enable them to control the risks effectively. One of our highly experienced participants stated about the significance of this study
“While distributing work can introduce additional risk, I believe those risks are offset by the
iterative and incremental nature of agile delivery. Based on my experience, distributed teams delivering under traditional methods are at the highest level of risk of failure, followed by co-located teams delivering under traditional methods. Whether co-co-located or distributed, agile approaches provide the best mitigations to delivery risk. As to whether I think the result would be useful, I think a 'top ten risks to be aware of' would be a useful tool to have in the kit of any
PM, so yes, I think it would be useful.”
Although the results are statistically significant and verifiable, scrutiny with respect to the relevant theoretical framework is essential to make them sufficiently reliable for real world implementation. In this section we use the GSRM framework and KAOS modelling language to formally present the perception of practitioners about the impact of risks on project goals in DAD projects.
6.1
Impact of Risk Factors on Project Time (schedule) of the project
In the context of the GSRM framework, risk factors identified in our study act as the ‘Obstacles’ to achieving the project goal ‘Timely completion of the project’ (Goal Layer) of the model. In
Figure 1, risk factors, R1 to R21, R23 and R24 are shown to have maximum impact on project
time and are presented in the ‘Obstacle Layer’. When we assessed their impact on the project
time in survey part II, we could identify risk factor R1 to R8, having a statistically significantly high impact on the project time along with reasonable agreement among the respondents for their ranks. These eight risk factors are forming a part of the ‘Assessment Layer’ of the GSRM model and the suggested approaches to manage the risks are a part of ‘Treatment Layer’ as
Distributed Agile projects usually have large scope and involves multiple backlogs where each backlog has large number of user stories.
Figure 1: Application of GSRM Framework for risk management in Distributed Agile Development
The requirements with every team might be even conflicting due to involvement of multiple product owners in different locations, further reducing the clarity about project requirements.
In order to reduce the impact of ‘Inappropriate Prioritization of Requirements’ DAD team need
good communication, backlog grooming and look ahead planning (Cohn, 2010). Further, Agile teams welcome changes in the requirements, which causes changes in the system architecture (Dingsøyr, Moe, Faegri & Seim, 2018), which further causes project delays (Begel & Nagappan, 2007). Architects in Agile teams need to have communication with the development group and make architectural decisions on the right time (Abrahamsson, Babar & Krutchen, 2010). It
is evident in our research findings also that ‘Poor Coordination between Different Sites’ causes
that coordination is the management of dependencies and appropriate coordination mechanisms need to be applied (Strode, Hope, Huff & Link, 2011). In distributed development, multiple teams need to coordinate with each other, synchronize their activities and manage the time zone difference in order to deliver timely output (Hossain et al., 2009). Temporal coordination is specifically important and enables teams to achieve the performance goals (Espinosa, Slaughter, Kraut, & Herbsleb, 2007).
Distributed Agile projects involves multiple vendors which helps them to avoid the single vendor contracting risk (Sakthivel, 2007). High level of coordination is required between the team and the vendors for solution development, which if not considered, leads to delays in the project outcome (‘Dependency on Third Party for solution development leading to coordination problems between them’). The involvement of external vendors and customers in DAD teams may foster conflict between the self-interest and willingness for collaboration with the team members. Organization design theory emphasizes that suitable organization design (mostly, hierarchical) and incentive systems (Burton and Obel, 1980, 1988; Williamson, 1975) help to control the self-interested opportunism on individuals. In distributed teams, the design and the incentive systems are loosely designed, causing lack of control on opportunism leading to miscommunication and lack of trust. The extent of trust and shared social identity that development team must possess, needs strong social interactions and synchronization, failing
which will lead to the team’s failure in meeting project objectives (Olaisen and Revang, 2017). Poor communication and lack of common standards among the vendors in distributed teams
impacts the requirement estimation, causing ‘Inappropriate User Story estimates with Multiple Vendors’. Accurate estimation of development effort in each stage is required in order to determine the schedule of the project. With the standard effort estimation approaches it is not possible to determine the correct estimates as they do not account for the effort involved in communication, coordination and management of multiple teams, external vendors and customers (Sakthivel, 2007). Besides team coordination, ‘Lack of Communication Infrastructure’
for communication also impacts the project time. Multiple communication modes like teleconference, videoconference, email, instant messaging are being used to achieve the project goals (Paasivaara, Durasiewicz, & Lassenius, 2008). There are other risk factors also that lead to schedule delays in Distributed Agile projects related to difficulty in release management and team synchronization, ineffective stand up meetings, team interdependencies, unclear project objectives and requirements. Although, these risks are perceived to be impacting project time, they are not found to be statistically significant and had comparatively low value
of Kendall’s coefficient of concordance, and so, have not been discussed in this paper.
6.2
Impact of Risk Factors on Project Cost
As apparent, the respondents did not directly relate project cost to any risk factors as the project cost supposedly depends on time and quality (Schwalbe, 2016). If there is a delay in the project schedule or rework needs to be done to improve the quality, it will lead to increase in the project cost (Reichelt & Lyneis, 1999). A study by Agarwal & Rathod (2006) have also
mentioned that ‘project cost’ is the least important factor to be considered for evaluation of the
cost than project time and quality. We can see in Figure 1 that none of the risk factors in the
‘Obstacle layer’ has been related to the project goal ‘Cost’ situated in the Goal Layer in the
GSRM model. Hence, the discussion section focuses more on the impact the risk factors have on project time and quality.
6.3
Impact of Risk Factors on Project Quality
Here we consider focusing on the project goal ‘Quality’ in the Goal layer, as in the GSRM
framework and specifically risk factors that act as obstacles to achievement of the project goal
of ‘Quality’. As presented in Table 1, the risk factors numbered as, R25-R42, R43, R44, R45, are having a high impact on the project goal ‘Quality’ and have been presented in the ‘Obstacle Layer’ in the GSRM framework. As in Table 2, the risk factors with numbers, R25-R31 were the ones that had statistically significant risks with high level of respondents’ concordance and were considered for further assessment of their impact on project quality. These factors obtained ranks such that they could be organised in the decreasing order of the amount of impact they had on quality and hence were placed in the ‘Assessment Layer’ in the GSRM
framework. The risks are being controlled by using appropriate risk management methods which can be a part of the treatment layer. The risk control methods have been discussed in (Shrivastava & Rathod, 2014) and has been mentioned in this section also.
The research findings of this study show that ‘Lack of communication between the Team and the Client’ and poor collaboration among the team members significantly impacts the project
quality. Distantly located team members do not have the ease of approaching each other as they have when they are co-located. Their communication is normally on lean electronic channels such as email, telephone, audio-video streaming, which do not have the richness of the content that is naturally embedded in face-to-face communication as propagated by Media Richness Theory (Daft and Lengel, 1986). Agile methods foster team collaboration which becomes difficult to achieve in distributed environments where participants have limited information about each other’s capability (Cohn, 2010). In this situation the projects suffer due
to ‘Poor Collaboration between Developers and Quality Assurance members’ reducing the
quality of the output. Agile methods rely on negotiations between the team members and the client to achieve an acceptable level of quality at various stages of development (Balasubramanium et al., 2006). Agile practices rely more on informal interaction than explicit documentation, and this becomes challenging in distributed environment (Balasubramanium et al., 2006), especially for testing purposes (‘Unavailability of requirements Documents for Testing’), hence impacting project quality (Inayat, Salim, Marczak, Daneva, & Shamshirband,
2014; Heck & Zaidman, 2018). In distributed Agile projects, the absence of independent testers who can focus on the hard parts of the testing work like, system integration testing, investigative testing, formal usability testing may lead to poor quality outcome. Hence in order
to manage the risk, ‘Cross Functional Teams insufficient for testing in large projects’, distributed
teams may need to arrange for an independent team in addition to it cross functional team for complex projects.
It is also observed that ‘Different software development practices and standards followed by multiple teams’ impact the software quality in Distributed Agile projects. Team members with different
backgrounds, regions have different preference for development practices, tools and engineering practices which leads to rework (Cusumano, 2008). Distributed teams also suffer
generated by each team in distributed project aligns to the communication structure of the corresponding organization (Conway, 1968), which ultimately impacts the quality of the project. This risk can be overcome by having good coordination among the developers, a good modular design of the system along with having good documentation (Herbsleb & Grinter, 1999).
One of the cultural differences like ‘Uncommon Language’ among the team members hinders
effective communication which reduces the quality of the output. Studies have proven that language difference leads to a need to use written asynchronous communication, which is more time consuming and difficult to interpret impacting quality negatively (Sosa, Eppinger, Pich, Mckenrick & Stout, 2002; Moe & Smite, 2008).
There were other risks such as lack of documentation, technical debts in the code and difficulty in performing pair programming due to team distribution that affects the project quality.
Other risk factors that need consideration are, ‘No common Definition of Done between distributed
teams’, ‘Inadequate communication about end user requirements, ‘Lack of Uniformity in team capabilities’, and ‘Poor Trust among the team members’. However, as these risk factors had statistically insignificant results (p-value greater than 0.01) and low Kendall’s coefficient of concordance, they have not been discussed in detail. These factors are enlisted in Table 2, but we cannot generalise the results, although their awareness would be useful for project managers.
6.4
Review of the impact on Project Goals
The research findings demonstrate that different types of risks impact different project goals in DAD projects and this understanding about risks would help in implementing effective risk controls. We observed that risks in DAD projects have a high impact on project schedule and quality, which are the primary goals considered by Agile teams. Agile teams iteratively create good quality solution in small time boxes that fulfils the customer needs (Dyba & Dingsøyr, 2008). Surprisingly, the risks that have emerged in our findings are impacting these two most essential project goals of DAD projects. Poor requirements management and changes in the design/architecture are primarily responsible for delays in DAD project. Along with this, we observe that involvement of various stakeholders such as vendors leads to coordination efforts, which if neglected will also cause delays in project completion. The research findings show that that communication among the team and with the client significantly impacts the quality of the output in DAD projects. Further, following standard design approach, appropriate testing methods and software development practices are important areas to be considered for achieving good quality. To some extent cultural difference in DAD projects also impacts quality and needs consideration while the project is being executed.
7
Limitations and threats to validity
generalization of the results and hence, the external validity (Maxwell, 1992). We observed that as the number of risk factors were reduced in questionnaire Part – II and the data was collected using email as well as online platform, more responses could be received. The data was primarily collected from Australia from the city where the principal researcher is located and from other cities within the country also. We tried to improve the external validity by collecting data from other countries including India, Japan, U.K and US.
For ensuring construct validity, we provided a brief explanation about each risk factor and project goal in the questionnaires, which helped in clarifying the meaning of each construct. Since we obtained statistically significant results, it indicates that the understanding of the survey by the practitioners was correct. We could not get responses from certain respondents who had participated previously in first part of the study as they were unwilling to participate in the study multiple times. Due to time and budget constraints we could not use external research services for further data collection.
The quantitative methods (Westen & Rosenthal, 2003) for establishing construct validity could not be used because of the paucity of the time and the limited number of respondents inclined to participate in the study. Lastly, the study of perception of practitioners has limitations associated with surveys.
8
Conclusion
study for effective management of risk factors associated with the project Time and software Quality have been clearly unveiled by this study. Both, the developer as well as research communities are benefitted with the finding of this study.
References
Abrahamsson, P., Babar, M.A., & Kruchten, P. (2010). Agility and Architecture: Can They Coexist?, in IEEE Software, vol. 27, no. 2, pp. 16-22, doi: 10.1109/MS.2010.36
Agarwal, N., & Rathod, U. (2006). Defining ‘success’ for software projects: An exploratory
revelation. International Journal of Project Management, 24, 358–370. https://doi.org/10.1016/j.ijproman.2005.11.009
Attarzadeh, I., & Ow, S.H. (2008). Project Management Practices: The Criteria for Success or Failure. Communications of the IBIMA 1, 234–241
Balasubramaniam, R., Lan, C., Kannan, M., & Peng, Xu. (2006). Can distributed software development be Agile? Commun. ACM 49, 10 (October 2006), 41-46. DOI=http://dx.doi.org/10.1145/1164394.1164418
Barki, H., Rivard, S., & Talbot, J. (1993). Toward an assessment of software development risk. Journal of Management Information Systems, 10(2), 203–225.
Bass, J. M. (2016). Artefacts and Agile method tailoring in large-scale offshore software development programmes. Information and Software Technology, 75, 1-16.
Begel, A., & Nagappan, N. (2007). Usage and Perceptions of Agile Software Development in an Industrial Context: An Exploratory Study First International Symposium on Empirical Software Engineering and Measurement, IEEE.
Black, K. (2009). Business Statistics: For Contemporary Decision Making. John Wiley and Sons (Asia) Pte. Ltd.
Burton, R.M., & Obel, B. (1980). A computer simulation test of the M-form hypothesis. Adm Sci Q 25(3):457–466
Cohn, M. (2010). Succeeding with Agile: Software Development Using Scrum. Pearson Education in South Asia.
Cooper, D.R., & Schindler, P.S. (2006). Business Research Methods Tata McGraw Hill.
Coram, M. and Bohner, S. (2005). The Impact of Agile Methods on Software Project Management. In Proceedings of the 12th IEEE International Conference and Workshops on Engineering of Computer-Based Systems (ECBS '05). IEEE Computer Society, Washington, DC, USA, 363-370. DOI=http://dx.doi.org/10.1109/ECBS.2005.68
Chow, T. & Cao, D.B. (2008). A survey study of critical success factors in agile software projects. Journal of Systems and Software 81.6: 961-971.
Conway, M.E (1968). How do Committees Invent? Datamation, Vol 14, No. 4, Apr. 1968, pp. 28-31
Cusumano, M.A. (2008). Managing software development in globally distributed teams. Communications of the ACM, vol. 51, no. 2, pp. 15–17, 2008.
Daft, R., & Lengel, R.H. (1986). Organization Information requirements, Media Richness and Structural Design. Management Science.v.32 no.5, 554-571
Dardenne,A., Fickas S., and Lamsweerde,A.V. (1991). Goal-directed Concept Acquisition in Requirements Elicitation, Proc. IWSSD-6 . 6th Intl..Worksh. on Software Specification and
Design, IEEE, 1 99 1 , 1 4-2 1 .
Dingsøyr T., Moe, N.B., Faegri, T.E., & Seim, E.A. (2018). Exploring software development at the very large-scale: a revelatory case study and research agenda for agile method adaptation. Empirical Software Engineering, (1), 490. https://doi.org/10.1007/s10664-017-9524-2
Dorairaj, S. and Noble, J. (2013). Agile Software Development with Distributed Teams: Agility, Distribution and Trust inAgile Conference (AGILE), 2013, pp. 1-10.
Dyba, T. & Dingsøyr, T. (2008). Empirical Studies of Agile Software Development: A Systematic Review Information and Software Technology, pp. 833-859, 2008.
Espinosa, J.A., Slaughter,S.A., Kraut,.R.E & Herbsleb,J.D (2007) Team Knowledge and Coordination in Geographically Distributed Software Development, Journal of Management Information Systems, 24:1, 135-169, DOI: 10.2753/MIS0742-1222240104 Gibbons, J.D (1993) Nonparametric Statistics: An Introduction (Quantitative Applications in the
Social Sciences), 90, Sage
Hallgren,H., & Olhager,J. (2009) Lean and agile manufacturing: external and internal drivers and performance outcome. International Journal of Operations & Production Management, Vol. 29 Issue: 10, pp.976-999, https://doi.org/10.1108/01443570910993456
Han, W.M. & Huang, S.J. (2007). An empirical analysis of risk components and performance on software projects. The Journal of Systems and Software, 80, pp. 42-50
Heck, P., & Zaidman, A. (2018). A systematic literature review on quality criteria for agile requirements specifications. Software Quality Journal, (1), 127. https://doi.org/10.1007/s11219-016-9336-4
Herbsleb, J.D. (2007). Global Software Engineering: The Future of Socio-technical Coordination. Future of Software Engineering(FOSE’07). IEEE.
Herbsleb, J.D. & Grinter, R.E. (1999). Splitting the organization and integrating the code: Conway's law revisited. In Proceedings of the 21st international conference on Software engineering (ICSE '99). ACM, New York, NY, USA, 85-95. DOI=http://dx.doi.org/10.1145/302405.302455
Holmström, H., Fitzgerald, B., Ågerfalk, P.J & Conchúir, E.O (2006). Agile Practices Reduce Distance in Global Software Development, Information Systems Management, 23:3, 7-18 Hossain, E., Babar, M.A., Paik, H.Y., & Verner, J. (2009). Risk Identification and Mitigation