Establishment and analysis of the mRNA expression
patterns of ABI3-like and storage protein genes during
soybean seed development
Ruochen Du1, Yonggang Qiao1, Xiao Wang2, Xinyun Lv2, Jinsheng Wang1*
1College of Agriculture, ShanXi Agriculture University, JinZhong 030801, China; 2College of Life Science, ShanXi Agriculture University,
JinZhong 030801, China
*Corresponding author:
Jinsheng Wang, College of Agriculture, Shan Xi Agriculture University, Jin Zhong 030801, China, Fax:+86 354 6287006. Tel: +86 354 6287006, China, Fax: +86 354 6287006. Tel: +86 354 6287006, E-mail: [email protected]
Received: 08 January 2016; Revised: 02 February 2016; Accepted: 02 February 2016; Published Online: 14 February 2016
INTRODUCTION
The abscisic acid insensitive 3 (ABI3) transcription factor is a member of the LAV family in the Arabidopsis B3 superfamily, and has regulatory effects on abscisic acid (ABA) responsive genes, as well as the dormancy, quality, and drought tolerance of developing Arabidopsis seeds (Suzuki et al., 2008; Sugliani et al., 2010; Zeng et al., 2013; Roscoe et al., 2015; Mao et al., 2015). The soybean ABI3-like gene GmABI3-8 is located on chromosome eight (Acc. No.: XM_003532261.2), and GmABI3-18 is located on chromosome eighteen (Acc. No.:XM_006602493.1). Soybean storage proteins are categorized according to their sedimentation coefficients into 11S and 7S types. The genes of the 11S subunit include Gy1, Gy2, Gy3, Gy4, Gy5, and Gy7, and the genes of the 7S subunit mainly include CG-alpha-1 (7sα), CG-alpha’-1 (7sα’), and CG-beta-1 (7sβ)
(Nielsen et al., 1997; Harada et al., 1989; Beilinson et al., 2002; Asakura et al., 2012). The expression level of Gy7 is very low (Beilinson et al., 2002). As a cis-acting element, the RY motif is commonly used as a seed-specific promoter. Most legume storage protein genes contain one or more RY repeating elements, which are the only common regulatory sequences (Nielsen al., 1989; Li et al., 2011). Studies have shown that the binding of the ABI3 transcription factor with the RY motif can regulate the accumulation of storage proteins in Arabidopsis seeds, as well as the physiological processes of dormancy (Romanel et al., 2009; Sakata et al., 2010; Delahaie et al., 2013). Elimination of the RY repeating elements can affect the spatial structures of the associated genes, resulting in a decrease in the binding activity of the transcription factor and the upstream elements of the promoter (Lelievre et al., 1992). In 2015, a study of the ABI3 transcription factor in maize demonstrated that Abscisic acid insensitive 3 (ABI3) has a regulatory effect on the accumulation of storage proteins, as well as on the dormancy, quality, and drought tolerance of Arabidopsis seeds during development. The storage protein genes (SPGs) and relevant proteomics are already well understood; however, the mRNA expression patterns of the ABI3-like gene in soybean remain unknown. In this paper, the expression of ABI3-like and SPGs in soybean seeds was evaluated at the transcriptional level, which can provide a theoretical basis for soybean molecular breeding. Soybeans of the type ‘NC111-1’ were used as the qRT-PCR test material, in order to study the mRNA expression patterns of ABI3-like factors (GmABI3-8 and GmABI3-18), soybean SPGs (Gy1, Gy2, Gy3, Gy4, Gy5, Gy7, 7sα,7sα’, and 7sβ), and their correlation. The results demonstrate that the mRNA expression patterns of GmABI3-8 and GmABI3-18 include bimodal curves, with the two peak periods corresponding to the filling and dehydration stages of soybean, respectively. The mRNA expression patterns of all SPGs exhibited single peak curves. 7sα, Gy1, and 7sβ play major roles, and the expression level of 7sα was significantly higher than that of other SPGs (P<0.05). The expression levels of GmABI3-8 mRNA and each SPG (excluding Gy7) mRNA were significantly linearly correlated (P<0.05, r>0.8) in the filling stage, while GmABI3-18 mRNA was highly expressed during the dehydration stage. These new details about the specific transcription factors and regulatory roles of each storage protein, as well as the specific metabolic pathway of ABI3, show that GmABI3-8 and GmABI3-18 play an important role in the development of soybean seeds. This new data will help facilitate the development of molecular breeding methods for the production of new high-protein soybean varieties.
Keywords: Soybean seed; GmABI3-8; GmABI3-18; Storage protein genes; qRT-PCR
A B S T R A C T
http://www.ejfa.me/
it also plays an important role during the filling period (Grimault et al., 2015). The storage proteins exhibited similar metabolic patterns during soybean proteomics research (Hajduch et al., 2005; Xu et al., 2015). The soybean genome has been sequenced, and the relevant proteomics research is complete; however, there have been no studies investigating the expression patterns of GmABI3-8 and GmABI3-18 mRNA and soybean SPGs mRNA. Data on the mRNA-level regulation of ABI3-like transcription factors in soybean seeds could provide a theoretical basis for soybean molecular breeding. Thus, the sample material used in this study consisted of soybean seeds in different post-flowering growth stages, in order to study the mRNA expression patterns of GmABI3-8, GmABI3-18, Gy1, Gy2, Gy3, Gy4, Gy5, Gy7, 7sα, 7sα’, and 7sβ using qRT-PCR, and further investigated the regulatory effect of ABI3-like transcription factors on storage proteins in soybean seeds during the formation process.
MATERIALS AND METHODS
Plant materialsThe ‘NC111-1’ (G. max ‘NC111-1’) soybeans were provided by the Life Science College of Shanxi Agricultural University. ‘NC111-1’ soybeans that were planted in Dongli Village, Taigu County, Shanxi Province were collected. Soybean flowering was recorded as day 0, and a plate was hung with the marked flowers. No less than 500 marked seeds were collected within the 10d after flowering (DAF), immediately frozen in liquid nitrogen, then stored for long-term preserved at -80˚C. The process was long-terminated when the soybean seeds had matured and reached the standard age for preservation (Fehret et al., 1971). This process was repeated twice from summer to autumn in 2013 and 2014, resulting in ten samplings per year.
Physiological data determination
The length, width, and thickness of the seeds from each sampling period were measured using an ultramicrometer (HANGGONG Inc., Hangzhou, China). The fresh weight of 100 seeds was measured using an electronic balance (Sartorius Inc., Beijing, China), while the dry weight was measured after drying the seeds to a constant weight, in order to calculate their water content. The protein content of the seeds was measured using the Kjeldahl nitrogen determination method (Jung et al., 2003), with a conversion coefficient of 5.71 (F=5.71). The protein quality within a single seed was calculated according to the dry weight and protein content. The test was repeated three times.
RNA isolation and cDNA synthesis
Total RNA was extracted using a Quick RNA Isolation Kit (HUAYUEYANG Bio Co. Ltd., Beijing, China)
according to the manufacturer’s protocol. The total RNA concentration of each sample was quantified using an ND-1000 spectrophotometer (Nano-drop Technologies, Wilmington, DE, USA), after which the samples were stored at -80˚C. The RNA was detected via agarose gel electrophoresis. The cDNA were synthesized using a Transcriptor First Strand cDNA Synthesis Kit (Roche Bio Co. Ltd., Shanghai, China). The reverse transcription product was stored at -20˚C, after standardizing the concentration.
Primer specificity detection
Based on the submitted sequences of soybean GmABI3-8, GmABI3-18, Gy1, Gy2, Gy3, Gy4, Gy5, Gy7, 7sα, 7sα’, and
7sβ mRNA in the NCBI GenBank, the RT-PCR primers
were designed using Primer premier 5.0 (Premier Co. Ltd., Canada) (Table 1). Primers were also designed for the CYP2 gene, which was used as a housekeeping gene (Jian et al., 2008) (Table 1). Then, 50 DAF cDNA was used as a template to detect specific primers, using the following amplification program: 94˚C for 5 min; 35 cycles of 94˚C for 30 s, 57˚C for 30 s, 72˚C for 30 s, and 72˚C for 5 min. The products were examined using 3% agarose gel electrophoresis, then sequenced.
RNA quality and primer specificity detection
The RNA agarose gel electrophoresis results (Fig. 1a) show the RNA to be intact during each sampling period. Conventional RT-PCR detection (Fig. 1b) demonstrated that there are no primer dimers. The sequencing results were checked using BLAST, and the homology was found to be over 95%.
Quantitative real-time PCR
Quantitative real-time PCR (qRT-PCR) was carried out according to the protocol provided with the SYBR Premix Ex TaqTM II Kit (TaKaRa Bio Co. Ltd., Dalian, China). qRT-PCR was carried out using Bio-Rad CFX 3.1 (Bio-Rad Bio Co. Ltd., CA, USA), and water, rather than the template, was used as a negative control. The process was carried out three times per gene, using the following amplification program: 95˚C for 3min; 40 cycles of 95˚C for 10s, 57˚C for 30s, and 72˚C for 20s; 70˚C for 5s; 95˚C for 5s. Then, the CFX Manager 3.1 software program (Bio-Rad Bio Co. Ltd., CA, USA) was used to analyze the melting curve. The ΔΔCt to the housekeeping gene (Pfaffl., 2001) was used for relative quantitation.
Data analysis
were analyzed using SPSS 19.0 (IBM Co. Ltd., NY, USA). The data generated above were converted to graphs using SigmaPlot 12.5 (Systat Software Inc., UK). The results were expressed as the mean ± standard error (X͞ ± SE).
RESULTS
Physiological data analysis and stage division
The physiological indices of the soybean seeds and pods in each period were summarized. The results (Fig. 2) show that pod length varies significantly over time, reaching its maximum at 70 DAF; small changes were observed in the width and the thickness; the trends in seed length, width, and height were similar, changing significantly after 30 DAF, and reaching their maximum at 70 DAF before decreasing; seed fresh weight reached its maximum at 70 DAF and then decreased, while the dry weight continued to increase; the water content of the seeds exhibited an overall downward trend, with a trough centered at 20 DAF; seed protein content varied within 42.31±5.25%, the maximum and minimum values being recorded at 20 DAF and 50 DAF, respectively; the single seed protein mass variation curve formed an “S” shape. According to the changes in the indexes above, the whole development period of the seeds was divided into two main periods: a seed filling stage (0-70 DAF), and a dehydration stage (70-100 DAF).
The mRNA expression profiles of GmABI3-8 and GmABI3-18
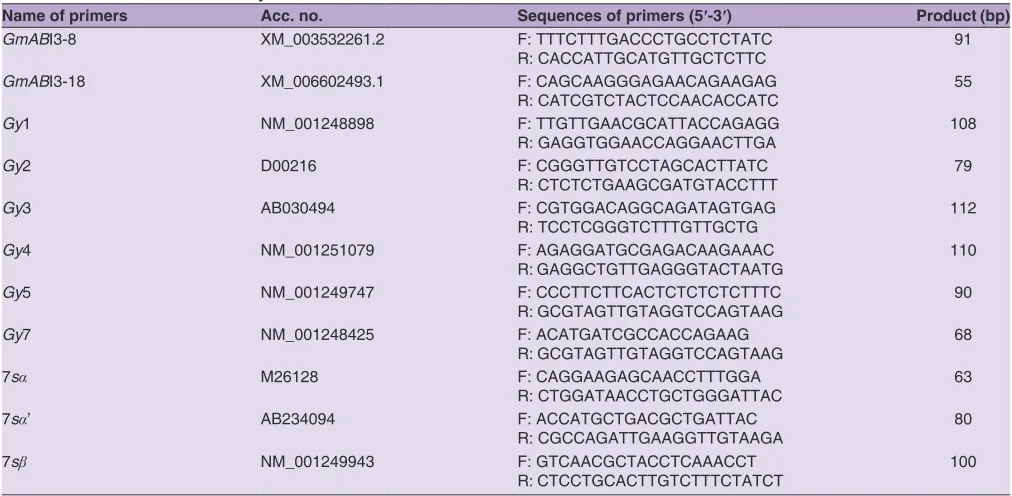
The GmABI3-8 and GmABI3-18 qRT-PCR results (Fig. 3) showed that GmABI3-8 and GmABI3-18 mRNA Table 1: Primers used in this study
Name of primers Acc. no. Sequences of primers (5ʹ‑3ʹ) Product (bp)
GmABI3-8 XM_003532261.2 F: TTTCTTTGACCCTGCCTCTATC
R: CACCATTGCATGTTGCTCTTC 91
GmABI3-18 XM_006602493.1 F: CAGCAAGGGAGAACAGAAGAG
R: CATCGTCTACTCCAACACCATC 55
Gy1 NM_001248898 F: TTGTTGAACGCATTACCAGAGG
R: GAGGTGGAACCAGGAACTTGA 108
Gy2 D00216 F: CGGGTTGTCCTAGCACTTATC
R: CTCTCTGAAGCGATGTACCTTT 79
Gy3 AB030494 F: CGTGGACAGGCAGATAGTGAG
R: TCCTCGGGTCTTTGTTGCTG 112
Gy4 NM_001251079 F: AGAGGATGCGAGACAAGAAAC
R: GAGGCTGTTGAGGGTACTAATG 110
Gy5 NM_001249747 F: CCCTTCTTCACTCTCTCTCTTTC
R: GCGTAGTTGTAGGTCCAGTAAG 90
Gy7 NM_001248425 F: ACATGATCGCCACCAGAAG
R: GCGTAGTTGTAGGTCCAGTAAG 68
7sα M26128 F: CAGGAAGAGCAACCTTTGGA
R: CTGGATAACCTGCTGGGATTAC 63
7sα’ AB234094 F: ACCATGCTGACGCTGATTAC
R: CGCCAGATTGAAGGTTGTAAGA 80
7sβ NM_001249943 F: GTCAACGCTACCTCAAACCT
R: CTCCTGCACTTGTCTTTCTATCT 100
Fig 1. Agarose gel electrophoresis Agarose gel electrophoresis of RNA; lane M contains the 2000 bp DNA marker (Real-Times Biotechnology Co. Ltd., Beijing, China), lanes 1 to 10 contain 10 DAF to 100 DAF. B.) Agarose gel electrophoresis of RT-PCR amplification; lane M contains 5000 bp DNA marker (Real-Times Biotechnology Co. Ltd., Beijing, China), lanes 1 to 12 contain Gy1, Gy2, Gy3, Gy4, Gy5, Gy7,
7sα, 7sα’, 7sβ, GmABI3-8, GmABI3-18, and CYP2 RNA, respectively.
Fig 2. Development of soybean during the experimental period A.) Whole NC111-1 seeds during the ten stages of seed development. B.) Individual pod size characteristics, including length (x), width (y), and thickness (z). Each value is the average of 10 pods. C.) Individual seed size characteristics. Values are the averages of 10 seeds. D.) Fresh weight and dry weight of 100 seeds. E.) Water content of developing seeds. F.) Protein content of dry weight. G.) Protein quality of a single seed. SE is denoted by error bars.
This was followed by second peak at 80DAF, after which the expression level decreased again. The expression level of GmABI3-18 was low at 10DAF, 20DAF, and 30DAF, then increased suddenly, peaking at 50DAF
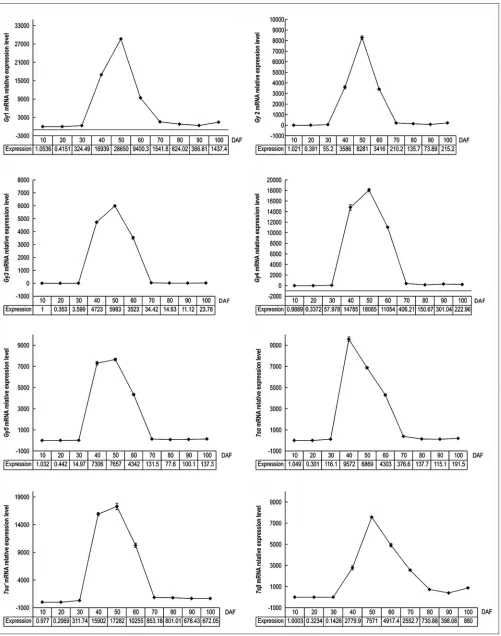
The expression patterns of SPG mRNAs
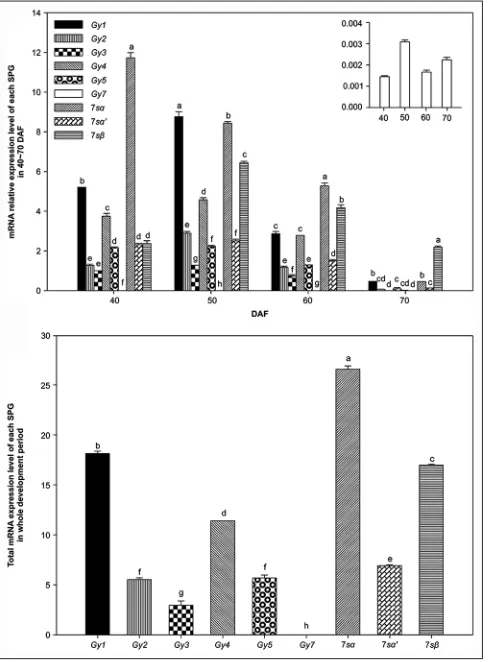
The qRT-PCR results of each SPG (Fig. 4) indicate that the expression of Gy1, Gy2, Gy3, Gy4, Gy5, 7sα, 7sα’, and 7sβ mRNA occurred along unimodal curves. The expression levels of Gy1, Gy2, Gy3, Gy4, Gy5, 7sα, and 7sα’ mRNA were the lowest overall at 20DAF, while that of 7sβ mRNA was the lowest overall at 30DAF. There was a sudden significant increase at 40DAF, and a significant decrease after the period of high expression between 40 and 70DAF. The expression levels of Gy1, Gy2, Gy3, Gy4, Gy5, 7sα’, and 7sβ mRNA peaked at 50DAF, and 7sα mRNA reached its maximum at 40DAF.The qRT-PCR results for Gy7 mRNA (Fig. 5) show that Gy7 expression varies in a manner similar to those of GmABI3-8 and GmABI3-18, with the two peaks appearing at 50DAF and 90DAF, respectively. Each SPG relative expression level from the main expression period (40-70DAF) was aggregated. The results (Fig. 6a) indicate that the most highly expressed mRNA during each period was as follows: 7sα at 40DAF and 60DAF, Gy1 at 50DAF,
and 7sβ at 70DAF.The total expression level of each SPG over the whole development period (10-100DAF) (Fig. 6b) from high to low was, in turn: 7sα, Gy1, 7sβ, Gy4, 7sα’, Gy5, Gy2, Gy3, and Gy7. The expression level of 7sα was significantly higher than that of other SPGs, while that of Gy7 was significantly lower than that of other SPGs (P< 0.05).
Correlation and regression analysis of GmABI3-8, GmABI3-18, and SPGs
A correlation analysis of GmABI3-8, GmABI3-18, and each SPGs mRNA expression level during the seed filling stage (Table 2) showed that GmABI3-8 was significantly linearly correlated with Gy1, Gy2, Gy3, Gy4, Gy5, 7sα, 7sα’, and 7sβ (P<0.05, r>0.8); GmABI3-18 was significantly linearly correlated with Gy7 (P<0.05, r>0.8); ABI3-like was significantly linearly correlated with Gy3, Gy4, Gy5, Gy7, 7sα’, and 7sβ (P<0.05, r>0.8).
Table 2: ABI3‑like and SPGs correlation analysis
GmABI3‑8 GmABI3‑18 ABI3‑like*
CC P value Re CC P value Re CC P value Re
Gy1 0.903 0.005 y=1276.876x-0.819 0.622 0.136 y=722.383x+0.056 0.795 0.033 y=538.058x-0.717
Gy2 0.858 0.014 y=392.350x-0.236 0.607 0.148 y=227.838x+0.013 0.764 0.045 y=167.326x-0.217
Gy3 0.951 0.001 y=224.631x-0.142 0.610 0.146 y=118.309x+0.041 0.811 0.027 y=91.674x-0.106
Gy4 0.957 0.001 y=811.054x-0.493 0.619 0.138 y=430.759x+0.157 0.819 0.024 y=332.220x-0.372
Gy5 0.964 0.000 y=422.676x-0.278 0.603 0.152 y=216.859x+0.087 0.813 0.026 y=170.541x-0.199
Gy7 0.773 0.041 y=0.369x+0.000 0.945 0.001 y=0.370x+0.000 0.921 0.003 y=0.211x+0.000
7sα 0.955 0.001 y=1920.670x-1.256 0.570 0.182 y=940.944x+0.550 0.789 0.035 y=759.834x-0.808
7sα’ 0.969 0.000 y=467.295x-0.276 0.624 0.134 y=246.939x+0.103 0.828 0.022 y=190.987x-0.203
7sβ 0.837 0.019 y=859.882x-0.061 0.797 0.032 y=671.816x-0.097 0.865 0.012 y=425.342x-0.369
*ABI3-like: The sum of GmABI3-8 and GmABI3-18 mRNA relative expression. CC: Correlation coefficient. Re: Regression equation
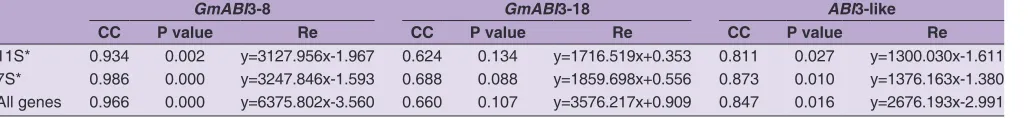
Table 3: ABI3‑like and SPGs correlation analysis
GmABI3‑8 GmABI3‑18 ABI3‑like
CC P value Re CC P value Re CC P value Re
11S* 0.934 0.002 y=3127.956x-1.967 0.624 0.134 y=1716.519x+0.353 0.811 0.027 y=1300.030x-1.611
7S* 0.986 0.000 y=3247.846x-1.593 0.688 0.088 y=1859.698x+0.556 0.873 0.010 y=1376.163x-1.380
All genes 0.966 0.000 y=6375.802x-3.560 0.660 0.107 y=3576.217x+0.909 0.847 0.016 y=2676.193x-2.991
CC: Correlation coefficient. Re: Regression equation
Fig 3.GmABI3-8 and GmABI3-18mRNA relative expression pattern GmABI3-8 mRNA relative expression pattern. B.) GmABI3-18 mRNA relative
Fig 5. Relative expression pattern of Gy7 mRNA relative expression level. Each value is the average of 3 datasets; SE is denoted by error bars.
Fig 6. mRNA relative expression level during 40-70 DAF, and total
mRNA expression level of each SPG A.) Relative expression level of each SPG in 40-70 DAF. B.) The total mRNA expression level of each SPG over the entire development period. Each value is the average of 3 datasets; SE is denoted by error bars. Means followed by the same
letter within an accession are not significantly different (P< 0.05).
correlated with 11S protein genes, 7S protein genes, and all SPGs (P<0.05, r>0.8).
The regression analyses (Fig. 7, Tables 2 and 3) demonstrate that the order of the slopes of regression equations of GmABI3-8 with each SPG from high to low is: 7sα, Gy1, 7sβ, Gy4, 7sα’, Gy5, Gy2, Gy3, and Gy7. The order of the slopes of the regression equations of GmABI3-18 with each SPG from high to low is: 7sα, Gy1, 7sβ, Gy4, 7sα’, Gy2, Gy5, Gy3, and Gy7. The order of the slopes of the regression equations of ABI3-like with each SPG from high to low is: 7sα, Gy1, 7sβ, Gy4, 7sα’, Gy5, Gy2, Gy3, and Gy7.The order of the slopes of the regression equations of GmABI3-8 with 11S protein genes, 7S protein genes, and all SPGs from high to low is: all SPGs, 7S protein genes, and 11S protein genes. The order of the slopes of the regression equations of GmABI3-18 with 11S protein genes, 7S protein genes and all SPGs from high to low is: all SPGs, 7S protein genes, and 11S protein genes. The order of the slopes of the regression equations of ABI3-like with 11S protein genes, 7S protein genes, and all SPGs from high to low is: all SPGs, 7S protein genes, and 11S protein genes.
DISCUSSION
Regularity of soybean growth and metabolism The process of soybean seed growth and development was divided into 4 stages (Meinke et al., 1981), based on changes in pod and seed size: morphogenesis and cell division, cell enlargement, seed maturation, and finally a desiccation and dormancy stage (Meinke et al., 1981). According to the changes in the indexes of our physiological data, the entire process of seed development was divided into two main periods: the seed filling stage (0-70 DAF), and the dehydration stage (70-100 DAF). This division is more suitable for studies investigating the changes in the storage protein. In this study, the seed pods grew more rapidly than the soybean seeds themselves. The dehydration process begins after the seeds completely fill the pod; in addition, the pods dehydrate more slowly than the seeds. These indicate that seed growth of seed is not limited to the interior space of the pod. On the contrary, it is likely that the seeds filling the pod trigger the dehydration process. The transcription factors and signaling pathways involved in this process are currently the subject of a great deal of research (Adams et al., 1983; Belamkar et al., 2014). The proteomics research conducted by Hajduch et al. (2005) on soybean seeds in the seed filling stage discovered that the storage protein content increased continuously; however, there is no available data about the dehydration phase. In this study, the total protein content did not exhibit any expected gradual upward trends. On the contrary, it peaked at 20DAF, while the protein content per seed continued to increase. This indicates that during the Correlation analyses of GmABI3-8, GmABI3-18, and 11S
Fig 7. Equations of regression analyses of SPGs and ABI3-like A.) Regression equations of GmABI3-8 and each SPG; B.) Regression equations
of GmABI3-18 and each SPG; C.) Regression equations of ABI3-like and each SPG; D.) Regression equations of GmABI3-8 and 11S protein
genes, 7S protein genes, and all SPGs; E.) Regression equations of GmABI3-18 with 11S protein genes, 7S protein genes, and all SPGs; F.)
Regression equations of ABI3-like and 11S protein genes, 7S protein genes, and all SPGs. Each value is the average of 3 datasets; SE is
denoted by error bars.
first stage of the seed development process, the expressed proteins were primarily those associated with growth and development. Although the protein percentage did not change significantly throughout the development period, the type and content of the proteins changed significantly. The seed fresh weight reached its maximum at 70DAF, after which the dry weight did not change significantly. Meanwhile the water content decreased, resulting in a significant decrease in seed weight. Therefore, using seeds at 70DAF (the end of the filling stage) for animal feed and other production applications is a more efficient use of resources.
SPGs expression patterns
The expression of the global soybean gene was detected by Asakura et al. (2012). Using a DNA microarray analysis
this is a period of peak storage protein synthesis in soybean seeds. This confirms the results of proteomics studies that used analyses of mRNA to elucidate the changes in storage protein content that occur during soybean seed development; that is, the changes in the storage protein content are consistent with the changes in SPGs mRNA expression levels (Hajduch et al., 2005). During this period of development, the most highly expressed mRNA was 7sα at 40DAF and 60DAF, Gy1 at 50DAF, and 7sβ at 70DAF, indicating that identity of the dominant expressed SPG changed overtime. Over the entire development period, the total expression level of 7sα mRNA was significantly higher than that of the other SPGs, indicating that 7sα was the most active SPG. In addition, Gy1 and 7sβ mRNAs were also highly expressed. Therefore, 7sα, Gy1, and 7sβ were the three most highly expressed SPGs. The study showed that synthesis of soybean seed storage substances decreased significantly during the dehydration stage(Jun et al., 2014). In this study, the expression of SPGs decreased significantly after 70DAF, followed by small changes at relatively low levels, indicating that storage protein synthesis was mostly completed prior to the start of the dehydration stage. This indicates that little protein synthesis and accumulation took place during the dehydration stage. In the study carried out by Beilinson V et al. (2012), Gy7 was detected midway through soybean seed development. This study describes the expression of Gy7 throughout seed development: the expression of Gy7 was significantly lower than that of other SPGs, and its expression levels varied differently from those of the other SPGs. However, Gy7 displayed a metabolic pattern similar to that of ABI3-like, both in its expression level and in its expression trend. It has been proposed to have more complex functions, as it seems to act as a storage protein, but differs significantly from the storage protein gene and seems similar to ABI3 transcription factors; however, more research is required to fully elucidate its true function. In summary, the expression of SPGs is time-specific, with metabolic patterns differing among development stages, with clear differences in the expression levels.
Effect of GmABI3-8 and GmABI3-18 on SPGs
The expression of GmABI3-8 and GmABI3-18 mRNA
exhibits double-peaked curves. During the seed filling stage, the early peak of GmABI3-8 mRNA occurred earlier than that of GmABI3-18.This suggests that the impact of the GmABI3-8 transcription factor on SPGs took effect earlier than that of GmABI3-18, indicating that after soybeans had experienced polyploidization during evolution, the metabolic patterns of the related genes featured certain differences in timing, but the overall trend was unchanged. The correlation analysis of mRNA expression during seed filling showed that the expression of GmABI3-8 and GmABI3-18 has a strong linear correlation with the
mRNA expression of the SPGs. This indicates that the GmABI3-8 and GmABI3-18 transcription factors influence and regulate storage protein synthesis. The expression of GmABI3-8 was more significantly linearly correlated with the expression of SPGs than that of GmABI3-18. This indicates that GmABI3-8 had a more significant regulatory effect on SPGs. The results of the regression analysis show that GmABI3-8 and GmABI3-18 had positive regulatory effects on SPGs, and that their effects differed. Therefore, by further studying the mechanisms of GmABI3-8 and SPGs expression, the protein content of soybean seeds can be increased using molecular biology techniques, improving germplasm resources. The study conducted by Gagete et al. (2009),focusing on a functional analysis of the isoforms of an ABI3-like factor of Pisum sativum that is generated by alternative splicing, suggests that the common RY repeating elements of legume seed SPGs are very likely to be the target of ABI3-like type transcription factors. The regulatory network of ABI3 transcription factors has been established in research on Arabidopsis (Reidt et al., 2000; Ruuska., 2002; Mönke et al., 2004).The results of this study can preliminarily prove the relationship between ABI3-like and SPGs at the mRNA level; however, whether GmABI3-8 and GmABI3-18 transcription factors are related to RY repeating elements, and whether they can regulate the expression of related genes must still be determined using techniques such as yeast hybridization.
CONCLUSION
Over the course of soybean seed development, GmABI3-8 and GmABI3-18 play an important role in the accumulation of storage protein and the process of dehydration. These specific biological pathways still require further study.
ACKNOWLEDGEMENTS
This study was financially supported by the National 948 Project of China (2012-Z35).
Author contribution
Study concepts and design: R. D.; Material preparation: R. D. Y. Q. X. L. Literature research: R. D. X. W.; Date analysis/ interpretation, Manuscript Preparation and definition of intellectual content: R. D. Y. Q.; Manuscript editing R. D. J.W.; Manuscript revision/review J. W.; Manuscript final version approval R. D. Y. Q. X. W. X. L. J. W.; All authors read and approved the manuscript.
REFERENCES
Adams, C. A., M. C. Fjerstad and R. W. Rinne. 1983. Characteristics of soybean seed maturation: necessity for slow dehydration. Crop Sci. 23: 265-267.
Asakura, T., T. Tamura, K. Terauchi, T. Narikawa, K. Yagasaki, Y. Ishimaru and K. Abe. 2012. Global gene expression profiles in developing soybean seeds. Plant Physiol. Biochem. 52: 147-153.
Beilinson, V., Z. Chen, R. Shoemaker, R. Fischer, R. Goldberg and N. Nielsen. 2002. Genomic organization of glycinin genes in soybean. Theor. Appl. Genet. 104: 1132-1140.
Belamkar, V., N. T. Weeks, A. K. Bharti, A. D. Farmer, M. A. Graham, S. B. Cannon. 2014. Comprehensive characterization and RNA-Seq profiling of the HD-Zip transcription factor family in soybean (Glycine max) during dehydration and salt stress. BMC Genom. 15: 950.
Delahaie, J., M. Hundertmark, J. Bove, O. Leprince, H. Rogniaux and J. Buitink. 2013. LEA polypeptide profiling of recalcitrant and orthodox legume seeds reveals ABI3-regulated LEA protein abundance linked to desiccation tolerance. J. Exp. Bot. 64: 4559-4573.
Fehr, W. R., C. E. Caviness, D. T. Burmood and J. S. Pennington. 1971. Stage of development descriptions for soybeans, Glycine max (L.) Merrill. Crop Sci. 11: 929-931.
Gagete, A. P., M. Riera, L. Franco and M. I. Rodrigo. 2009.Functional analysis of the isoforms of an ABI3-like factor of Pisum sativum generated by alternative splicing. J. Exp. Bot. 60: 1703-1714. Grimault, A., G. Gendrot, S. Chaignon, F. Gilard, G. Tcherkez,
J. Thévenin and P. M. Rogowsky. 2015. Role of B3 domain transcription factors of the AFL family in maize kernel filling. Plant Sci. 236: 116-125.
Hajduch, M., A. Ganapathy, J. W. Stein and J. J. Thelen. 2005. A systematic proteomic study of seed filling in soybean. Establishment of high-resolution two-dimensional reference maps, expression profiles, and an interactive proteome database. Plant Physiol. 137: 1397-1419.
Harada, J. J., S. J. Barker and R. B. Goldberg. 1989. Soybean beta-conglycinin genes are clustered in several DNA regions and are regulated by transcriptional and posttranscriptional processes. Plant Cell. 1: 415-425.
Jian, B., B. Liu, Y. Bi, W. Hou, C. Wu and T. Han. 2008. Validation of internal control for gene expression study in soybean by quantitative real-time PCR. BMC Mol. Biol. 9: 59.
Jun, W. A. N., L. I. U. Lin, G. U. O. Yong, Y. H. Wang, L. Zhang, L. G. Jin and L. J. Qiu. 2014. A dominant locus, qBSC-1, controls β subunit content of seed storage protein in soybean (Glycine max (L.)Merri. J. Integr. Agric. 13: 1854-1864.
Jung, S., D. A. Rickert, N. A. Deak, E. D. Aldin, J. Recknor, L. A. Johnson and P. A. Murphy. 2003. Comparison of kjeldahl and dumas methods for determining protein contents of soybean products. J. Am. Oil Chem. Soc. 80: 1169-1173.
Lelievre, J. M., L. O. Oliveira, N. C. Nielsen. 1992. 5ʹ CATGCAT-3ʹ elements modulate the expression of glycinin genes. Plant Physiol. 98: 387-391.
Li, C. and Y. M. Zhang. 2011. Molecular evolution of glycinin and β-conglycinin gene families in soybean (Glycine max L. Merr.). Heredity. 106: 633-641.
Mao, Z. and W. Sun. 2015. Arabidopsis seed-specific vacuolar aquaporins are involved in maintaining seed longevity under the control of ABSCISIC ACID INSENSITIVE 3. J. Exp. Bot. pii: 244. Meinke, D. W., J. Chen and R. N. Beachy. 1981. Expression of
storage-protein genes during soybean seed development. Planta. 153: 130-139.
Mönke, G., L. Altschmied, A. Tewes, W. Reidt, H. P. Mock, H. Bäumlein and U. Conrad. 2004. Seed-specific transcription factors ABI3 and FUS3: Molecular interaction with DNA. Planta. 219: 158-166. Nielsen, N. C., R. Bassüner and T. Beaman. 1997. The biochemistry
and cell biology of embryo storage proteins. In: Brian, A. L. and K. V. Indra (Eds.), Cellular and Molecular Biology of Plant Seed Development. Kluwer Academic Publishers, Dordrecht, The Netherlands, Pp. 151-220.
Nielsen, N. C., C. D. Dickinson, T. J. Cho, V. H. Thanh, B. J. Scallon, R. L. Fischer and R. B. Goldberg. 1989. Characterization of the glycinin gene family in soybean. Plant Cell. 1: 313-328. Reidt, W., T. Wohlfarth, M. Ellerström, A. Czihal, A. Tewes,
I. Ezcurra and H. Bäumlein. 2000. Gene regulation during late embryogenesis: The RY motif of maturation specific gene promoters is a direct target of the FUS3 gene product. Plant J. 21: 401-408.
Romanel, E. A., C. G. Schrago, R. M. Couñago, C. A. Russo and M. Alves-Ferreira. 2009. Evolution of the B3 DNA binding superfamily: new insights into REM family gene diversification. PLoS One. 4: e5791.
Roscoe, T., J. Guilleminot, J. J. Bessoule, F. Berger and M. Devic. 2015. Complementation of seed maturation phenotypes by ectopic expression of abscissic acid nsensitive3, fusca3 and leafy cotyledon2 in Arabidopsis. Plant Cell Physiol. 56(6): 1215-1228. doi: 10.1093/pcp/pcv049.
Ruuska, S. A., T. Girke, C. Benning and J. B. Ohlrogge. 2002. Contrapuntal networks of gene expression during Arabidopsis
seed filling. Plant Cell. 14: 1191-1206.
Sakata, Y., I. Nakamura, T. Taji, S. Tanaka and R. S. Quatrano. 2010. Regulation of the ABA-responsive em promoter by ABI3 in the moss Physcomitrella patens: Role of the ABA response element and the RY element. Plant Signal. 5: 1061-1066.
Plant Cell. 22: 1936-1946.
Suzuki, M. and D. R. McCarty. (2008). Functional symmetry of the B3 network controlling seed development. Curr. Opin. Plant Biol. 11: 548-553.
Xu, X. P., H. Liu, L. Tian, X. B. Dong, S. H. Shen and L. Q. Qu. 2015.
Integrated and comparative proteomics of oil and high-protein soybean seeds. Food Chem. 172: 105-116.