* To whom all correspondence should be addressed. E-mail: [email protected]
Optimization of Guava Milk Chocolate
Using Response Surface Methodology
Diwakar Mishra1*, Anil Kumar Chauhan2,
Rashmi Bhardwaj1, Pramod kumar3 and Devbrat Yadav3
1Ph.D. Scholar, Dairy technology Section, ICAR- NDRI (SRS), Bangaluru-560030, India. 2Professor, Centre of Food Science and Technology, IAS, BHU, Varanasi -221005, India.
3Ph.D. Scholar,Dairy Chemistry Section, ICAR-NDRI, Karnal-132001, India. http://dx.doi.org/10.13005/bbra/2322
(Received: 22 July 2016; accepted: 01 September 2016)
Chocolate is a luxury food. It is not only popular among children, but also consumed by youth and old age persons. The present project was taken up to develop vitamin-C enriched guava milk chocolate. The purpose of addition of guava powder was to enhance nutritional and sensory qualities of chocolate. Guava is a very rich source of soluble dietary fiber and vitamin-C (an excellent antioxidant). The effect of various ingredients like guava powder, milk powder and cocoa powder on sensory characteristics of the prepared chocolate was studied and their levels were optimized using Response Surface Methodology (RSM) using regression equation model. Optimization of the product was done by maximising the score for sensory characteristics while keeping the hardness of the chocolate in range. The optimised guava milk chocolate constituted 14.13 percent guava power, 15 percent milk powder, 15 percent cocoa powder, 30 percent sugar and 30 percent cocoa butter.
Keywords: Guava milk chocolate, food, RSM.
Chocolate is a luxury food that evokes a range of stimuli that activate pleasure during consumption. Primary chocolate categories are dark, milk and white that differs in content of cocoa solid, milk fat and cocoa butter. It is a semi-solid suspension of fine solid particles of sugar and cocoa, about 70%. It is solid at ambient (20-25°C) and melts in mouth (37°C) during consumption giving a smooth suspension of particulate solids in cocoa butter and milk fat (Beckett et al., 1999). It has a characteristic lipid phase composition that influences mouth feel and melting properties.
is rich in ascorbic acid (vitamin C), which is 4 to 10 times greater than citrus fruits (Manay et al., 2014). The fruit, in particular the pink flesh cultivar, has a fair amount of vitamin A (beta-carotene). Some vitamin B such as thiamin (B1), riboflavin (B2), niacin and pantothenic acid are also found in the fruit. In addition, it also contains a fair amount of phosphorous, calcium, iron, potassium and sodium (Lim and Khoo, 1990). Guava is also rich in antioxidants that help to reduce the incidence of degenerative diseases such as arthritis, arteriosclerosis, cancer, heart disease and inflammation and brain dysfunction. In addition, antioxidants were reported to retard ageing (Feskanich et al., 2000). Among the most abundant antioxidants in fruits are polyphenols and ascorbic acid. Considering the health benefits of guava and the popularity of chocolate among the population, the present project has been taken to optimise the ingredients for the development of guava milk chocolate using RSM.
MATERIALS AND METHODS
Raw material and chemicals
Cocoa powder (Cadbury), skim milk powder (SMP) and sugar were procured from local market of Varanasi, Uttar Pradesh (India). Guava powder was taken from Centre of Food Science and Technology laboratory, IAS, BHU. All the chemicals were procured from Sigma-Aldrich (USA), Merck and Himedia (Mumbai, India).
Experimental design and data analysis
Basically, RSM helps to create a product using regression equations that describe interrelations between input parameters and product properties (Colona et al.,1984). The Central Composite Design (CCD) for three independent variables was performed using Design-Expert DX 8.0.7.1 version. The independent variables were guava powder, milk powder and cocoa powder. The independent variables and variation levels are shown in Table-1. The range of each variable was established according to preliminary trials. The outline of experimental design with the actual levels is presented in Table-2. Dependent variables were color, body & texture, flavor, graininess, mouth feel and hardness of the guava milk chocolate as product responses. RSM was applied for experimental data using a commercial statistical
package, Design-Expert version 8.0.7.1 for the generation of response surface plots. The same software was used for statistical analysis of experimental data. The experiments were conducted and responses were fitted in the design. After that each individual experiment, responses were analyzed to assess the effect of independent variables on them. Numerical optimization technique of the Design-Expert software was used for simultaneous optimization of the multiple responses. As an approach to the numerical optimisation of multiple responses, the simultaneous optimisation technique popularized by Derringer and Suich, (1980) was used. The desired goals for each factor and response were chosen. The goals may be applicable to either factors or responses. The possible goals or constraints are: maximize, minimize, target, within range, none (for response only) and set to an exact value (for factors only). In order to search a solution maximizing multiple responses, the goals were combined into an overall composite function, called the desirability function. Desirability is an objective function that ranges from zero outside of the limits to one at the goal. The program of the software (design expert) seeks to maximize the function. The goal seeking begins at a random starting point and proceeds up the steepest slope to a maximum. By starting from several points in the design space, chances improve for finding the “best” local maximum.
The second order polynomial equation of the following form was fitted to the responses:
Y =
Where,
Y = Response variable
ij ii i
,
&
,
o
β
β
β
β
= Regression coefficient Xi, Xj & Xij = Coded independent variables ε = Residual errorPreparation of chocolate
Table 1. Process variables used in the central composite design for three independent variables
Independent Factor Units Coded Variables
Variables -2 -1 0 +1 +2
Guava Powder A % 8.30 10.00 12.50 15.00 16.70 Milk Powder B % 13.30 15.00 17.50 20.00 21.70 Cocoa Powder C % 8.30 10.00 12.50 15.00 16.70
Table 2. Experimental design with
actual variable levels
Run A: Guava B: Milk C: Cocoa
Powder(%) Powder (%) Powder(%)
1 10 20 15
2 8.29 17.5 12.5
3 12.5 17.5 12.5
4 12.5 13.29 12.5
5 15 20 15
6 12.5 17.5 12.5
7 12.5 17.5 12.5
8 12.5 17.5 12.5
9 15 15 15
10 12.5 21.70 12.5
11 12.5 17.5 8.29
12 10 20 10
13 16.70 17.5 12.5
14 15 15 10
15 12.5 17.5 16.70
16 10 15 10
17 12.5 17.5 12.5
18 15 20 10
19 12.5 17.5 12.5
20 10 15 15
shapes and kept for crystallization in refrigerator at 3°C. The prepared guava chocolate was then packaged properly in aluminium foil and stored at refrigeration temperature.
Sensory evaluation
Chocolate samples were evaluated for sensory characteristics like color, body & texture, flavor, graininess and mouth feel using 9-point Hedonic scale (Lawless and Heymann, 2010). Sensory evaluation of the chocolate was performed by a panel of 7 semi trained judges from the Centre of Food Science and Technology at Banaras Hindu University, Varanasi, India.
Texture analyses (Bourne et al., 1978)
Hardness of chocolate samples were analyzed using Texture Analyzer (TA.XT plus
texture profile analyzer, Stable Micro Systems, UK).
Analytical methods
Moisture, protein, fat and ash content in guava milk chocolate were estimated by AOAC (2000) methods. Ascorbic acid content in guava milk chocolate was estimated by AOAC (1990) method.
RESULT AND DISCUSSION
Effect on Graininess
The average graininess score of guava milk chocolate varied from 5.5 to 7.84 (Table-3).The quadratic model for graininess was found significant (p<0.0001) and the data were fitted in
quadratic model as given below.
Graininess = + 6.76 + 0.60 × A 7.322E – 004 × B -5.658E - 003 × C + 1.250E – 003 × A × B + 0.061 × A × C - 0.02 × B × C - 0.037 × A2 + 2.271E -003× B2 + 0.027 × C2
Where A is guava powder, B is milk powder & C is cocoa powder.
Fig.1 and 2 show the response surface plot for graininess as influenced by milk powder, guava powder and cocoa powder levels. It indicated that with increasing levels of guava powder, sensory score of graininess in guava milk chocolate increased. However, there was no or very low effect on the graininess due to addition of milk powder in guava milk chocolate. Fig. 2 shows that addition of cocoa powder in the chocolate did not impart any effect on the graininess.
Effect on body and texture
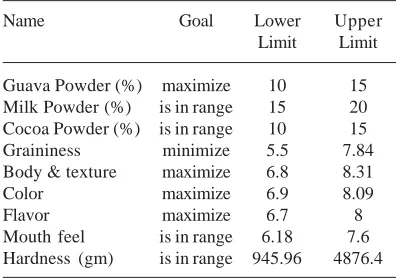
-Table 3. Central composite rotatable design for the optimization of the guava milk chocolate
Run Guava Milk Cocoa Grain Body & Color Flavour Mouth Hardness
Powder Powder Powder iness texture feel (gm)
(%) (%) (%)
1 10 20 15 6.1 7.67 7.6 7.1 7.5 3823.89
2 8.2 17.5 12.5 5.5 7.4 7.39 6.7 7.1 2287.95
3 12.5 17.5 12.5 6.76 7.49 7.42 7.66 7.17 2680.56
4 12.5 13.29 12.5 6.78 7.32 7.39 7.39 6.18 2980.82
5 15 20 15 7.32 7.82 7.74 7.65 7.42 3969.74
6 12.5 17.5 12.5 6.79 7.43 7.38 7.41 7.39 2856.08
7 12.5 17.5 12.5 6.7 7.4 7.4 7.39 7.45 2955.64
8 12.5 17.5 12.5 6.67 7.47 7.36 7.43 7.41 2875.59
9 15 15 15 7.33 7.91 7.71 7.9 6.8 3780.05
10 12.5 21.70 12.5 6.78 7.38 7.39 7.49 7.6 2383.49
11 12.5 17.5 8.29 6.87 6.8 6.9 7.45 7.2 945.96
12 10 20 10 6.31 7.17 7.2 7.21 7.45 1798.57
13 16.70 17.5 12.5 7.84 7.45 7.29 8 7.1 2564.74
14 15 15 10 7.2 7.1 7.12 7.63 6.58 1965.8
15 12.5 17.5 16.70 6.83 8.31 8.09 7.49 7.1 4876.4
16 10 15 10 6.23 7.19 7.19 7.04 6.7 1932.97
17 12.5 17.5 12.5 6.85 7.27 7.46 7.52 7.1 2427.86
18 15 20 10 7.21 6.97 7.17 7.69 7.4 1463.59
19 12.5 17.5 12.5 6.76 7.24 7.23 7.43 7.16 2865.94
20 10 15 15 6.19 7.86 7.78 7.09 6.97 3623.8
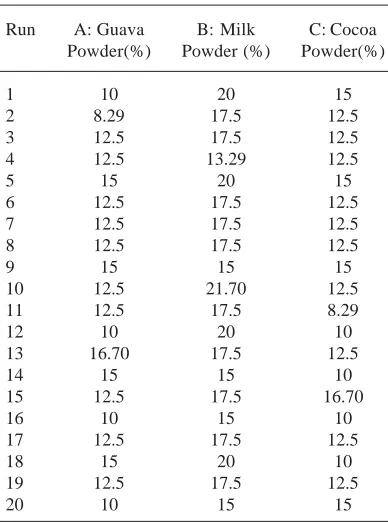
Table 4. Levels of responses fixed for optimization of guava milk chocolate
Name Goal Lower Upper
Limit Limit
Guava Powder (%) maximize 10 15
Milk Powder (%) is in range 15 20
Cocoa Powder (%) is in range 10 15
Graininess minimize 5.5 7.84
Body & texture maximize 6.8 8.31
Color maximize 6.9 8.09
Flavor maximize 6.7 8
Mouth feel is in range 6.18 7.6
Hardness (gm) is in range 945.96 4876.4 0.016 × B × C + 0.018 × A2 -8.772E– 003 × B2 + 0.064 × C2
There was a slight effect of milk powder on the body and texture of guava milk chocolate (Fig.3). The increasing levels of guava powder showed a slight decrease in sensory score of body and texture of guava milk chocolate. Increasing the level of cocoa powder significantly increased sensory score for body and texture (Fig. 4).
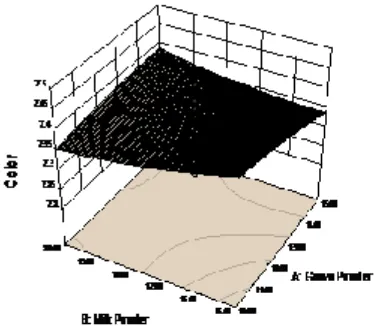
Effect on color
The model for color of the chocolate was significant with average color score varying from 6.9 to 8.09 (Table-3). The following equation describes the quadratic model for color.
Color = +7.37-0.015×A-6.590E-003 × B+0.30 × C+0.031 × A × B+0.021 × A × C-0.026 ×B × C-6.382E-003 × A2+0.011× B2+0.048 × C2
There was a negative effect of both guava powder and milk powder on color of guava milk chocolate and the increasing levels of both
ingredients decreased sensory score for color (Fig 5). Increasing level of cocoa powder improved the color of the chocolate (Fig. 6).
Effect on flavor
The average graininess score of guava milk chocolate varied from (Table-3). The quadratic model for flavor was found significant (p<0.0001) with sensory score ranging from 6.7 to 8.0: and data recorded during experimental were fitted in quadratic model as given below.
Flavor = +7.47+0.34× A+0.012 × B+0.017 × C-0.046 × A × B+0.036× A ×C-0.059× B × C -0.044 × A2-0.012 × B2-1.815E-003 × C2
T
able 5.
Predicted score of suggested optimized formulation of Guava Chocolate
Fig. 1. Response surface of graininess as influenced by levels of milk powder and guava powder in guava milk chocolate
Fig. 2. Response surface of graininess as influenced by levels of cocoa powder and guava powder in guava milk chocolate
Fig. 3. Response surface of body and texture as
influenced by levels of milk powder and guava powder in guava milk chocolate
Fig. 4. Response surface of body and texture as
influenced by levels of cocoa powder and guava powder in guava milk chocolate
Fig. 5. Response surface of color as influenced by levels of milk powder . and guava powder in guava milk chocolate
Fig. 7. Response surface of flavour as influenced by levels of milk powder and guava powder in guava milk chocolate
Fig. 8. Response surface of flavour as influenced by
levels of cocoa powder and guava powder in guava milk chocolate
Fig. 10. Response surface of mouthfeel as influenced
by levels of cocoa powder and guava powder in guava milk chocolate
Fig. 9. Response surface of mouthfeel as influenced by
levels of milk powder and guava powder in guava milk chocolate
Fig. 11. Response surface of hardness as influenced by
levels of milk powder and guava powder in guava milk chocolate
Fig. 12. Response surface of hardness as influenced by
powder significantly enhanced the flavour of the guava milk chocolate (Fig. 7 and 8 respectively).
Effect on Mouth feel
The average mouth feel score of guava milk chocolate varied from 6.18 to 7.6 (Table-3). The quadratic model for mouth feel was found significant (p<0.0002); and the data were fitted in quadratic model as mentioned below.
Mouth feel = +7.28-0.031 × A+0.37 × B+0.029 × C+0.020 × A ×B-1.000E-002 × A × 0.052× B × C-0.049 × A2-0.12 × B2-0.031 × C2
Fig. 9 and 10 shows the response surface plot for mouth feel as influenced by milk powder, guava powder and cocoa powder levels. From Fig. 9 It is obvious that with an increase in levels of guava powder, there was decrease in sensory score for mouth feel. Contrary to this, the increasing levels of milk powder emphatically increased the mouth feel. Fig. 10 shows that with increasing levels of cocoa powder, mouth feel increased considerably.
Effect on hardness
The average hardness score of guava milk chocolate varied from 9.45 to 3823 gm (Table-3). The quadratic model for hardness was found significant (p<0.0001); and the data were fitted in quadratic model as mentioned below.
Hardness = +2772.82+34.08 × A-91.63×B+1072.48 47.28 × A×B+75.53× A ×C +128.30× B ×C-96.97×A2-6.53× B2+74.44×C2
It can be seen from Fig.11 that with increasing levels of guava powder, the hardness of guava milk chocolate increased, while addition of milk powder in the development of chocolate decreased the hardness. Fig.12 represents that addition of cocoa powder exhibited the great importance on the hardness of chocolate.
Optimized product
Levels of different responses were fixed (Table: - 4) to obtain 26 suggested solutions (Table:-5). Out of 26 suggested solutions, solution which had highest desirability (0.626) compared to all other solutions was opted for formulation.The solution was obtained for optimized guava milk chocolate condition having value as 14.13 % guava powder, 15 % milk powder and 15 % cocoa powder and at this level the score of graininess, body & texture, color, flavor, mouth feel & hardness were as 7.21, 7.91, 7.75, 7.77, 6.77 and 3937 gm, respectively.
Proximate composition of optimized guava milk chocolate
Optimized guava milk chocolate showed 02.81 % moisture, 01.87 % Protein, 30.04 % fat and 04.10 % ash. Ascorbic acid was 122 mg/100 gm of guava milk chocolate.
CONCLUSIONS
Guava powder was successfully added to chocolate, though some degree of graininess persisted. The sensory characteristics viz.,, color, flavor, body & texture, mouth feel and textural property i.e. hardness were comparable to traditional milk chocolate.
ACKNOWLEDGEMENTS
We gratefully acknowledge Department of Biotechnology, Government of India, for funding this research in Centre of Food Science and Technology, Banaras Hindu University (Varanasi), India.
REFERENCES
1. AOAC. Official Methods of Analysis. Association of Official Analytical Chemists, Washington D.C. 15th edition 1990.
2. AOAC.2000. Methods of analysis, 17th edn. Association of official analytical chemistry Washington, USA.
3. Beckett, S. T. 1999. Industrial chocolate manufacture and use. Oxford: Blackwell science.3, 153-181,201-230,405-428,460-465 4. Bourne, M.C. Texture profile analysis. Food
Technol., 1978; 32: 62- 6.
5. Chin, H. F., & Yong, H. S. 1980. Malaysian fruits in colour. Kuala Lumpur: Tropical Press, Malaysia
6. Colona, P., Doublier, J.L., Melcion, J.P., Monfredon, F.D. and Mercier, C. Extrusion cooking and drum drying of wheat starch. I. Physical and macromolecular modifications. Cereal Chemistry, 1984; 61: 538-543. 7. Derringer, G. and Suich, R. Simultaneous
Optimization of Several Response Variables. Journal of Quality Technology, 1980; 12(4): 214-219.
among men and women. Journal of the National Cancer Institute, 2000; 92:1812–1823. 9. Lawless, H.T. and Heymann, H. Sensory
evaluation of food: principles and practices. Springer, New York., 2010; 326.
10. Lim, T. K., Khoo, K.C. Guava in Malaysia:
Production, pests and diseases. Kuala Lumpur 1990.
11. Manay, N.S. Fruits. Foods facts and principles. third edition. New age international (P) limited publicatishers.,2014; 166.