iWatch: A Fall and Activity Recognition System Using
Smart Devices
Sittichai Sukreep
1*, Khalid Elgazzar
2, Henry Chu
2, Pornchai Mongkolnam
1, Chakarida
Nukoolkit
11 School of Information Technology, King Mongkut’s University of Technology Thonburi, Bangkok, Thailand. 2School of Computing & Informatics, University of Louisiana at Lafayette, Louisiana, USA.
* Corresponding author.Email: [email protected]
Manuscript submittedAugust 15, 2018; accepted November 5, 2018. doi: 10.17706/ijcce.2019.8.1.18-31
Abstract: Recent reports show that the average life expectancy is increasing worldwide, posing significant
overhead on healthcare systems and increasing demands on long-term care facilities. One of the grand challenges directly related to growing ageing societies is the implications of falling. Many elderly people live alone, especially those in Western countries who cannot afford living in a senior house or retirement facility. In such cases, not only falling is a major concern, but also daily activities must be continuously monitored and analyzed to provide immediate support when needed. Vital signs and environment context are also crucial conditions for pre- and post-event assessments. Thanks to technology advancements and widespread adoption of the Internet of Things which enables us to provide smart and ubiquitous healthcare services. In this paper, we propose iWatch, a smart and flexible system for fall detection and activity recognition using common smart devices, a smartwatch and a smartphone. Machine learning techniques are used to build efficient and highly accurate activity recognition classifiers. iWatch also provides health risk analysis using threshold-based models and leverages visualization tools to better communicate with the user. iWatch is a promising technology that provides a small step in a giant leap to revolutionize healthcare services, especially for those who needs extra care.
Key words: Health monitoring, smartwatch, IoT, daily activity, fall.
1.
Introduction
The average life expectancy is increasing worldwide due to improved healthcare. This not only creates overhead on the healthcare system, but also poses many challenges associated with growing ageing societies [1], especially for those who live alone. Falling is one of the primary risks associated with aging that causes significant health problems, severe injuries and possibly deaths [2]. Slip and falling injuries could be fatal without getting immediate medical assistance [3]. It is necessary to ensure the safety of our loved ones and be able to receive immediate notifications if something goes wrong.
iWatch, a robust and comprehensive activity recognition system to support remote healthcare monitoring. iWatch leverages machine learning techniques to detect falling and recognize a number of important activities to assist elderly to live a healthier and more independent life. iWatch is an affordable, unobtrusive, user-friendly, and highly accurate system that fits both indoor and outdoor.
The major contributions in this paper are summarized as follows.
A holistic cost-efficient health monitoring system for indoor and outdoor settings.
A highly accurate daily activity and fall detection algorithm.
An easy to understand timeline tracking of the user activity using visualization techniques.
2.
Related Worked
Many researchers have addressed the challenges of activities recognition and fall detection using different devices, techniques and visualizations tools. In the following, we highlight some of the previous research efforts on different aspects.
2.1.
Fall and Activity Recognition
There are several techniques, algorithms and positions of devices for falls and activities recognitions. Leu et al. [5] implemented a fall detection system using a tri-axial accelerometer and gyroscope installed in a mobile phone. Shibuya et al. [6] proposed a lightweight and wearable device to detect falls and six other types of activities using a threshold-based algorithm. Kwon et al. [7] proposed an unsupervised self-learning method for activity recognition with the sensor data collected from a smartphone. A similar research was proposed in [8] presenting a method to recognize a person’s activities from the smartphone’s sensors using a mixture-of-experts (ME) model with both labeled and unlabeled data. Shawen et al. [9] implemented a classifier for a lower limb amputation where the mobile phone was carried across multiple locations with no predetermined orientation.
2.2.
Devices and Wearables
The most recent research for falls and activities has been categorized into three main approaches based on visual analysis, ambient context or wearable technology [10].
Vision-based techniques: Vision or camera-based systems provide very rich personal and environmental data for falls detection and activity recognition systems [11]. Ambient-based techniques: Sensors that can capture ambient conditions used for identifying falls through infrared technology, sound detection using microphones, vibration data or a pressure sensor [12]. Wearable-based techniques: A variety of wearable devices are widely popular and commercially available on the market. These devices can provide a wide range of sensor data that can be used to recognize various activities. Moreover, they can be used in various locations both indoor and outdoor but the duration of monitoring is limited by the battery life [13].
2.3.
Health Monitoring Systems
The proposed research in this paper leverages several good ideas from previous research efforts, but takes mobile health monitoring into the next level of convenience, accuracy and cost-efficiency. We basically use a smartwatch and a number of environment sensors for fall detection and daily activity recognition. This makes it easier and affordable for patients. Our classifier utilizes a number of algorithms to recognize falls and activities to achieve high accuracy. We also provide health risk measures/thresholds in order to alert or warn patients/healthcare providers in case of unfolding abnormal events or high-risk activities. Lastly, several easy-to-understand visualizations are presented to assist patients to better understand their current health conditions and risk levels in real-time.
3.
System Architecture
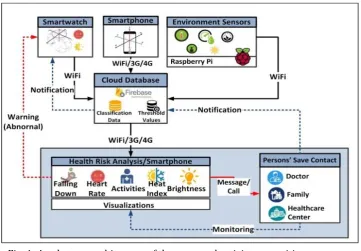
Fig. 1. An abstract architecture of the proposed activity recognition system.
Fig. 1 shows an abstract overview of the proposed activity recognition system. The system supports three core functions: (1) fall detection and activity recognition using machine learning algorithms; (2) health risk analysis and environment data analysis based on personal and environment context; (3) visualization of various activities, surrounding context, and vital signs.
The system reads sensor data from the user’s smartwatch (on the wrist) and smartphone. The primary sensor readings are the accelerometer and gyroscope data. iWatch also reads the vital signs available from the smartwatch, depending on the model capabilities. Environment context is captured by a number of sensors that can measure ambient light, temperate, pressure, and humidity. These sensors typically use a gateway to connect to the Internet (e.g., a Raspberry Pi). Our system is flexible and extendable and can automatically discover nearby sensors and integrate their functionality/services using discovery protocols such as CoAP, UPnP and MQTT. Data gathered from all sensors are sent to a cloud-based server for processing and storage. The user interface displays the various activity detected as well as surrounding conditions. The user dashboard is divided into three main sections: current and past personal activities, real-time vital signs (e.g., heart rate), and environment conditions surrounding the user.
captured by data collected from the smartphone including holding, moving, calling and lying down. The data gathered from both the smartwatch and phone can be correlated to improve the overall accuracy. The activity recognition is performed in two phases: training phase and real-time recognition phase.
3.1.
Model Training Phase
A number of machine learning models have been tested to evaluate their performance with our target application and data set. We train the selected model with our real-time data that we collected from many subjects performing guided activities. The objective of the training phase is to improve the model accuracy specifically to our case. The sequence of activity recognition performed in this phase is shown in Fig. 2.
Fig. 2. Integrated steps of the proposed activity recognition system.
Data Collection: The system gathers accelerometer, heart rate, and light sensor data from the smartwatch, and only accelerometer data from the smartphone. The tri-axial accelerometer consists of X, Y and Z coordinates as shown in Fig. 3. The smartwatch sensor data were obtained from 30 subjects performing 10 activities while wearing the smartwatch on either left and right wrist. We noticed no difference on either case. The data were continuously collected for 10 seconds at a 0.2-sec sampling rate. The procedure was repeated three times for both the smartwatch and the smartphone data collection to ensure statistical significance.
(a) (b)
Data Pre-Processing: In machine learning, data pre-processing is an important step for data validation, outlier detection, and interpolation of any missing data. The Min-Max normalization standard technique [16] is selected to transform the original data into a range of [-1,1] to adjust the scale and calculate the Euclidean distance for a rate of velocity change as shown in Equation 1.
2
2
2
Difference( , )
i j
(
Xj Xi
)
(
Yj Yi
)
(
Zj Zi
)
(1)where Difference (i, j) represents the accelerometer data from the ith and jth records, and X, Y, and Z
represent the three axes.
Model Evaluation: We selected four algorithms to train the data using a 10-fold cross validation, namely, Random Forest, Decision Tree (J48), Naïve Bayes, and k-Nearest Neighbors. The training data set was collected from 20 subjects performing ten activities.
Table 1. Results of the Activities Testing
Algorithm/
Activity
Random Forest
Decision
Tree (J48) KNN (k=3) KNN (k=5) KNN (k=7) Naïve Bayes Smartwatch’ Activity 99.51* 99.08 99.20 99.13 99.03 87.71
Smartphone’s Activity 99.91* 99.84 99.87 99.85 99.83 99.3
Table 1 shows the performance of the four algorithms. The results show that the Random Forest algorithm outperforms the other three algorithms. Thus, Random Forest will be used for real-time activity recognition for both devices.
3.2.
Real
-
Time Recognition Process
Fig. 4. (a) Real-time classification process.
Data Gathering: The real-time tri-axial accelerometer sensor data were obtained from 10 human subjects for 10 seconds for each target activities and repeated three times for statistical significance. The total
number of obtained data point was 30,000 (5x10x3x2x10x10) form the smartwatch, and 6,000 (5x10x3x4x10)from the smartphone. We set a window size of 3 seconds buffer time (15 points)to last for
one complete data collection cycle.
Runtime Data Pre-processing: Similar to the training phase, data pre-processing was performed at runtime during the recognition phase to ensure high quality of collected data and recognition process.
4.
Experiment Results and Discussion
In this section, we describe our experimental testbed and setup. We also discuss the findings and provide
insights on the overall performance of the proposed system.
4.1.
Experiment Setup
(a) (b)
Fig. 5. (a)Smartwatch on left wrist (b) Smartwatch on the right wrist.
A Moto 360 first generation smartwatch was used for our experiment. The smartwatch ran Android Wear
operating system [17]. A Samsung S5 smartphone was connected to the smartwatch to track subject activity.
The subjects tried the smartwatch whether on right and left wrist as shown in Fig. 5 and no significant difference was noticed in the measurements. The smartwatch reported accelerometer readings, heart rate,
and ambient light. The smartphone was used to gather the accelerometer sensor data only.
A set of sensors was used to measure the environment parameters including temperature, humidity, pressure [18], light [19], ultrasonic [20], and motion sensors as shown in Fig. 6. In real-life deployments,
such sensors can be placed around the areas where the user is mostly expected to occupy such as living room, bedroom, kitchen, garage, etc.
4.2.
Real
-
Time Classification
Table2. Evaluation Results of Real-Time Smartwatch’s Activities.
Activities/ Evaluation Si tt in g Sta ndi ng Ly ing
Down Hold
in g / R ead in g Ty pi ng Loo ki ng at a w at ch W alki ng Jogg in g W av ing Fall ing Av er ag e
Accuracy (%) 100.0 100.0 96.32 100.0 96.32 100.0 100.0 100.0 99.30 100.0 99.19
Precision 1.000 1.000 0.963 1.000 0.963 1.000 1.00 1.000 0.930 1.000 0.985
Recall 1.000 1.000 0.963 1.000 0.963 1.000 1.000 0.935 1.000 1.000 0.986 Table3. Evaluation Results of Real-Time Smartphone’s Activities.
Activities/
Evaluation Holding Putting Calling Moving Average Accuracy (%) 100.00 100.00 100.00 100.00 100.00
Precision 1.000 1.000 1.000 1.000 1.000
Recall 1.000 1.000 1.000 1.000 1.000
The Random Forest classification algorithm achieved an average of 99.19 percent accuracy, precision at 0.985 and recall at 0.986 for smartwatch-based activity recognition as shown in Table 2, and 100 percent for smartphone-based activity recognition as shown in Table 3.
4.3.
Fall and Activity Visualizations
The mobile application provides a rich interactive graphical interface that uses simple representative symbols to display to the user the current activities and vital signs including, heart rate, the most recent three activities detected by the system. The dashboard also provides a communication platform that connects users with their healthcare providers.
4.3.1. User dashboard
Fig. 7. Dashboard of activity and environment monitoring.
Fig. 8. The current and previous activities from smartwatch and smart phone.
Fig. 8 shows the current activity, elapsed time during the activity and visual representation of the associated health risks. The system also provides the brightness level surrounding the user, measured by the smartwatch to help user adjust the brightness level for current activity (e.g., reading) to maintain healthy eyesight [21].
Fig. 9. Environment monitoring and warning system.
The bottom part of the dashboard displays the environment context around the user such as light, temperature, humidity and pressure in order to help the user to avoid uncomfortable area. The system provides the functionality to identify the level of health risk based on pre-specified thresholds for temperature and humidity. The normal level is represented by the green color; caution level is yellow, and dangerous level is red [22] as shown in Fig. 9.
4.3.2. Health risk analysis
The system performs background analytics based on the raw sensor data gathered from personal and environment sensors to provide warnings and recommendations related to the user’s health conditions. Four thresholds refer to risk level: normal, low risk, moderate risk, and high risk, and health risk analysis is shown in Fig. 10.
4.3.3. Activity reporting
The system provides visualized activity report based on historical data using various visualization techniques including pie chart, graphs, bars, etc. These reports provide an interaction visual understanding of the user’s past activities including health risk level and percentage.
Fig. 11 shows two sample reports, one for the activity summary (Fig. 11.a) and another for heart rate (Fig. 11.b). Fig. 11.b shows a pie chart at the bottom that represents the summary heart rate risk level. The heart rate status is indicated by different colors [23]: green means healthy, yellow represents a caution level, orange color indicates unhealthy level, and red means risky level.
(a) (b)
Fig. 11. (a) Summary activity report by date (b) Summary of heart rate.
Fig. 12. Heart rate monitoring during activities.
4.3.4. Min
-
max activity recommendation
It is always beneficial for users to know their limits for various activities. The system offers radar graphs with healthy borderlines to monitor and track health risk levels for each of the seven activities (sitting, standing, lying down, walking, jogging, typing, and holding/reading) not including three activities (fall, wave and look at the watch) because the duration of these activities is too short which makes it difficult to measure using the same units.
(a) (b)
Fig. 13. Radar graphs of recommended daily activities (minimum and maximum values): (a) Healthy, (b)
The Min-Max activity threshold values will be determined by caregivers and will be configured in the system. These values will be set as the base line for each activity which are processed in the background.
Fig. 13 shows the recommended minimum and maximum values of the total daily minutes (blue border) for each activity and the color of the radar graph represents the risk level. Green means healthy, and red means unhealthy as shown in Fig. 13.b. Threshold values are typically personal and must be set for individuals by healthcare providers based on health status, habits, and personal fitness level.
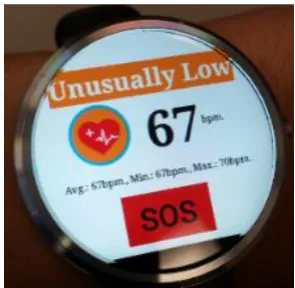
In the event of falling down, the SOS will be shown immediately on the smartwatch screen, and the user can hit the button in order to request an emergency assistance as shown in Fig. 14. In neither cases, the system automatically places an emergency call within 10 seconds of the user falling and provides the user’s current location.
Fig. 14. SOS button on the smartwatch.
5.
Conclusion and Future Work
In this paper, we present iWatch, a practical and affordable fall and daily activities recognition system using a smartwatch and a smartphone for indoor and outdoor settings. Real-time sensor data are collected from the user’s smartwatch and smartphone as well as from sensors deployed in the surrounding environment. A number of machine learning techniques have been implemented and tested to build an accurate and lightweight classifier model for fall detection and activity recognition. iWatch demonstrates good performance with an overall 99.19% accuracy, 0.985 precision, and 0.986 recall using smartwatch sensor data. The trained classifier shows a perfect 100% accuracy, and 1.00 on both precision and recall for smartphone sensor data.
iWatch dashboard presents recognized activities and vital signs to the user using simple visualizations. It also provides warnings when health risk levels or vital signs exceed pre-specified limits. Environment context is also presented for guided assistance and better assessments in post-event evaluation.
Acknowledgment
References
[1] Stepler, R. (2016). Smaller share of women ages 65 and older are living alone:More are living with
spouse or children. Pew Research Center. Retrieved from
http://www.pewsocialtrends.org/2016/02/18/smaller-share-of-women-ages-65-and-older-are-living -alone/
[2] Centers for Disease Control and Prevention. (2012). Web-based injury statistics query and reporting
system (wisqars). Atlanta, GA: National Center for Injury Prevention and Control. Retrieved from http://www.cdc.gov/homeandre -creational safety/ falls/adultfalls.html
[3] National Safety Council. (2017). Top Causes of Unintentional Injury and Death in Homes and
Communities. Retrieved from http://www.nsc.org/learn/safety-knowledge/Pages/ safety-at-home.aspx
[4] Barlow, J., Singh, D., Bayer, S., & Curry, R. (2007).A systematic review of the benefits of home telecare
for frail elderly people and those with long-term conditions. Journal of Telemedicine and Telecare, 13(4),
172-179.
[5] Leu, F. Y., Ko, C. Y., Lin, Y. C., Susanto, H., & Yu, H. C. (2017).Fall detection and motion classification by
using decision tree on mobile phone. Smart Sensors Networks (pp. 205-237).
[6] Shibuya, N., Nukala, B. T., Rodriguez, A. I., Tsay, J., Nguyen, T. Q., Zupancic, S., & Lie, D. Y. (2015,
January). A real-time fall detection system using a wearable gait analysis sensor and a support vector
machine (svm)classifier. Proceedings of 2015 Eighth International Conference on Mobile Computing and
Ubiquitous Networking (ICMU) (pp. 66-67).
[7] Kwon, Y., Kang, K., & Bae, C. (2014). Unsupervised learning for human activity recognition using
smartphone sensors. Expert Systems with Applications, 41(14), 6067-6074.
[8] Lee, Y. S., & Cho, S. B. (2014). Activity recognition with android phone using mixture-of-experts
co-trained with labeled and unlabeled data. Neurocomputing, 126, 106-115.
[9] Shawen, N., Lonini, L., Mummidisetty, C. K., Shparii, I., Albert, M. V., Kording, K., & Jayaraman, A. (2017).
Fall detection in individuals with lower limb amputations using mobile phones: Machine learning
enhances robustness for real-world applications. JMIR mHealth and uHealth, 5(10).
[10] Mubashir, M., Shao, L., & Seed, L. (2013). A survey on fall detection: Principles and approache.
Neurocomputing, 100, 144-152.
[11] Ozcan, K., & Velipasalar, S. (2016). Wearable camera-and accelerometer-based fall detection on
portable devices. IEEE Embedded Systems Letters, 8(1), 6-9.
[12] Droghini, D., Ferretti, D., Principi, E., Squartini, S., & Piazza, F. (2017).A combined one-class SVM and
template-matching approach for user-aided human fall detection by means of floor acoustic features.
Computational Intelligence and Neuroscience.
[13] Martín, H., Bernardos, A. M., Iglesias, J., & Casar, J. R. (2013). Activity logging using lightweight
classification techniques in mobile devices. Personal and ubiquitous computing, 17(4), 675-695.
[14] Fajingbesi, F. E., Olanrewaju, R. F., Pampori, B. R., Khan, S., & Yacoob, M. (2017).Real time telemedical
health care systems with wearable sensors.Asian Journal of Pharmaceutical Research and Health Care,
9(3), 138-144.
[15] Helbostad, J. L., Vereijken, B., Becker, C., Todd, C., Taraldsen, K., Pijnappels, M., & Mellone, S. (2017).
Mobile health applications to promote active and healthy ageing. Sensors, 17(3), 622.
[16] Han, J., Pei, J., & Kamber, M. (2011). Data Mining: Concepts and Techniques. Elsevier.
[17] Motorola Mobility Company. Moto 360 (1st Gen). Retrieved from
[18] Adafruit. Adafruit BME280 I2C or SPI Temperature Humidity Pressure Sensor. Retrieved from
https://www.adafruit.com/product/2652
[19] Adafruit. RGB Color Sensor with IR Filter and White LED - TCS34725. Retrieved from
https://www.adafruit.com/ product/1334
[20] Canada Robotix. US-020 Ultrasonic Ranging Sensor. Retrieved from
http://www.canadarobotix.com/sound-microphone/us020-ultrasonic-ranging-sensor
[21] Harvard Health Publishing. Safeguarding Your Sight. Retrieved from
https://www.health.harvard.edu/healthbeat/safeguarding-your-sight
[22] Opitz-Stapleton, S., Sabbag, L., Hawley, K., Tran, P., Hoang, L., & Nguyen, P. H. (2016).Heat index trends
and climate change implications for occupational heat exposure in Da Nang, Vietnam. Climate Services,
2, 41-51.
[23] American Heart Association. Target Heart Rates. Retrieved from
http://www.heart.org/HEARTORG/HealthyLiving/PhysicalActivity/Target-HeartRates_UCM_434341_Ar
ticle.jsp#. WpDuMKjwZdh
Sittichai Sukreep received his B.S. in computer science from Mahasarakham University,
Thailand in 2005 and received his M.S. in software engineering from School of
Information Technology (SIT), King Mongkut’s University of Technology Thonburi,
Thailand in 2013. He is currently a Ph.D. candidate in computer science at SIT. His
research interests includedata mining, machine learning, and Internet of Things (IoT).
Khalid Elgazzarreceived a Ph.D. from Queen's University in 2013. He has over 8 years of industrial experience in software development and networking desgin, and over 9 years of interdisciplinary academic teaching and research. His research interests span the areas of mobile and ubiquitous computing, distributed systems, context-aware cyber-physical systems, and elastic networking paradigms to cope with dynamic applications. His current research focus is on novel ubiquitous cloud paradigms and Internet of Things (IoT)
Henry Chu received a Ph.D. in electrical and computer engineering from Purdue University in 1988. He is a professor and executive director of Informatics Research Institute at University of Louisiana at Lafayette, USA. His research interests includesignal and image processing, pattern recognition, machine vision, and internet technologies.
Pornchai Mongkolnam received a Ph.D. degree incomputer science from Arizona State
University, USA in 2003 and currently works at School ofInformation Technology (SIT) at
King Mongkut’s University of Technology Thonburi, Thailand. He is the head of Data