http://www.ijcmph.com pISSN 2394-6032 | eISSN 2394-6040
Original Research Article
Environmental awareness in university students and
the affecting factors
Cigdem Tekin, Gulsen Gunes*
INTRODUCTION
The environment has been defined as everything other than humans. This definition has emerged as a result of the interaction between human health, environment and genetic pattern. The concept of environment covers everything other than us, and the social, physico-geo-chemical and biological environment, which are in constant interaction with each other. All environmental factors that have the possibility of interacting with human beings are influential on the health of human beings and the society.1,2
The rising life standards and the fast increase in the population of the world have increased the pressure on natural resources. Feeding, clothing and accommodating the increasing population increased the use of the resources and brought many environmental problems with them. Today, the environmental problems are threatening the whole world.3-5 In studies conducted so far, it was reported that humans are pessimistic about the future of the environment depending on these problems, and the quality of the environment will decrease in coming years.6
ABSTRACT
Background: The disruption of the ecological system and the environmental destructions require that we review our relations with the outer world and therefore increase our awareness on environmental problems as individuals. This study has been conducted to determine the environmental awareness levels of the first and fourth grade university students studying at different academic fields, and investigate the factors that affect the awareness levels of them.
Methods: The study was designed in the descriptive style and was applied to first and fourth grade 384 students studying at various faculties of Inonu University in 2015-2016 academic years. The “Environmental Attitude Scale” was used in data collection.
Results: The environmental attitude points of the first grade students were found to be 101.33±12.28, and those of the fourth graders were found to be 98.30±14.54 (p<0.05). The average point of the students who studied at Faculty of Economics and Administrative Sciences was 111.10±11.61, and those who studied at Engineering Faculty was 104.73±12.81, and was found to be higher than the other faculties(p<0.05).
Conclusions: The environmental attitudes of the first grade students and the students who studied at Faculty of Economics and Administrative Sciences and Engineering Faculty were found to be higher; and the attitudes of the students who studied at Faculty of Dentistry were found to be lower. The educational status of the parents of the students, their living area in which they lived most of the time and their status of having hobbies are the other factors that influence the average points.
Keywords: Environmental health, Attitude, Students
Department ofPublic Health, Inonu University, Faculty of Medicine, Malatya, Turkey
Received: 05 June 2017
Accepted: 04 July 2018
*Correspondence:
Dr. Gulsen Gunes,
E-mail: [email protected]
Copyright: © the author(s), publisher and licensee Medip Academy. This is an open-access article distributed under the terms of the Creative Commons Attribution Non-Commercial License, which permits unrestricted non-commercial use, distribution, and reproduction in any medium, provided the original work is properly cited.
Major environmental changes have reached life-threatening dimensions for human life in today’s world. The disruption of the ecological system and obvious environmental destructions require that we review our relations with our outer world.7
Environmental pollution and the disruption of the environment have many influences on life. Each year, millions of people have respiratory system diseases due to environmental pollution in open air or in closed areas.8 In addition, environmental pollution also causes disruption in the chromosomes, cell lysis, death in intrauterine, negative influences on growth, anomalies in the fetus, death after birth, inadequacy in learning functions and early ageing.9 Local and global measures have been taken for environmental problems, and national and international meetings are held on this topic. These efforts have been influential on the planning and the acceptance of administrative, legal, economic and technological measures. However, there are inadequate points in social level and in the “awareness” of the individuals about environmental problems.10 In order to arouse this awareness, the education on environment is extremely important. The purpose of this study is to determine the environmental awareness levels of the first and fourth grade university students studying at different academic fields, investigate their opinions and behaviors on environmental problems, and determine the factors that influence the awareness levels of the students.
METHODS
The type of the study
The study was conducted in 2016 April-June period in the descriptive design.
The universe and the sampling
The universe of the study consists of first and fourth grade students studying at eleven undergraduate level programs at Inonu University, Central Campus in 2015-2016 academic year. The N.t2.p.q/d2(N-1)+t2.p.q formula, which is used in case the number of the participants in the target audience is known in selecting the sampling, was used. According to this formula, the minimum sampling size was found to be 384. The size of the sampling was determined as 400 by considering that there might be questionnaires that would be eliminated from the study because of not being fully completed. The stratified random sampling method was used in the selection of the sampling, and the students were selected randomly according to the proportioned of each faculty and class.
Data collection tools
The questionnaires, which were created as the data collection tool, consisted of two forms. The first form was the “Demographic Data Form”, which was developed by the author of the study to determine the
demographic characteristics of the students; and the second one was the “Environmental Attitude Scale” (EAS), which was developed by Uzun and Saglam (2006).11 The scale consists of two sub-scales, which are the “Secondary Environmental Behavior Scale” and the “Secondary Environmental Attitude Scale”. The “Secondary Environmental Behavior Scale” consists of 13 items, and the “Secondary Environmental Attitude Scale” consists of 14 items; in total 27 items, and is in 5 points Likert style. The Cronbach Alpha reliability coefficient of the “Secondary environmental attitude scale” was found to be α=0.80; and the Cronbach Alpha reliability coefficient of the “Secondary environmental behavior scale” was found to be α=0.88; and the Cronbach Alpha reliability coefficient of the “Environmental attitude scale” in general was found to be α=0.80. The “Environmental attitude scale” was evaluated by giving points from 5 (Always/I totally agree) and 1 (Never/I do not agree at all) according to the answers given; and in reverse sentences, the points were given from 1 to 5 to obtain the environmental attitude point of each student. While the points that could be received from the Behavioral Sub-scale varied between 13 and 65, the points varied between 14 and 70 in the Secondary Environmental Attitude Scale. The minimum point that can be received from the general of the scale is 27, and the highest one is 135.11
Ethical aspect of the study
Written permission was received from Inonu University, Ethics Board in order to conduct the study (Ethical no: 2016\ 5-9).
The analysis of the data
In statistical analyses, the Kolmogorov-Smirnov test (K-S) and the Student t and one way Anova tests were used for the data that fit normal distribution; and the Mann-Whitney U and Kruskal Wallis tests were used for the data that did not fit normal distribution; and the p<0.05 level was taken as being significant in all evaluations.
RESULTS
33.7% of the students, who participated in the study, had a family income of 1301-2300 Turkish lira (TL) per month. 65.5% of the students did not have any hobbies related with the nature, and 34.5% of them had at least one hobby related with the nature (Table 1).
Table 1: Socio-demographic characteristics of the participants.
Socio-demographic characteristics
Number
(n) %
Gender
Women 204 55
Men 167 45
Age
17-19 112 30.2
20-22 151 40.7
≥ 23 108 29.1
Grade
First 214 57.7
Fourth 157 42.3
Faculties
Faculty of Dentistry 22 5.9 Faculty of Pharmacy 11 3.0 Faculty of Economics and
Administrative Sciences 20 5.4 Faculty of Theology 18 4.9 Faculty of Arts and Sciences 59 15.9 Faculty of Sport Sciences 12 3.2 Faculty of Medicine 18 4.9 Faculty of Education 76 20.5 Faculty of Engineering 61 16.4 Faculty of Health Sciences 41 11.1 Faculty of Law 33 8.9
Father's Educational Status
Illiterate 9 2.4
Literate 19 5.1
Primary School 79 21.3 Middle School 61 16.4 Secondary School 114 30.7 Undergraduate or Postgraduate 89 24.0
Mother's educational status
Illiterate 40 10.8
Literate 25 6.7
Primary school 131 35.3 Middle school 46 12.4 Secondary school 96 25.9 Undergraduate or postgraduate 33 8.9
Income status
≤1300 TL 75 20.2
1301-2300 TL 125 33.7 2301-3300 TL 107 28.8
≥3301 TL 64 17.3
Ownership of hobby related with
nature 40 10.8
Yes 128 34.5
No 243 65.5
Although the average points of the female students were higher in the comparison between the mean points received in the environmental attitude scale according to socio-demographic characteristics, the difference between the female and male students were not found to be significant. In the comparison of the students in terms of their grades and their attitude scale points, it was determined that the students who were at the first grade had higher points than those who studied at the fourth grade at a significant level. In comparison between the faculty of the students and the environmental attitude scale and environmental behaviors scale average points, it was observed that the students who were studying at Faculty of Economics and Administrative Sciences and Engineering Faculty had higher points than the other students at a significant level. The difference between the average points of the students and the educational status of their fathers were found to be statistically significant, and it was determined that this difference stemmed from the students whose fathers were high school graduates and had undergraduate/postgraduate degrees. In comparison between the educational status of the mothers of the students and the secondary environmental behavior scale average points, it was observed that the points received by the students whose mothers were high school graduates were significantly higher than the other students. In the comparison between average points of environmental attitude scale, it was observed that the students whose mothers were not literate received lower points than the other students at a significant level. The average points of the students whose families had 1300 TL and below monthly income were found to be lower than the other groups at a significant level. The environmental attitude scale average points of the students who lived in the same city for most of the time were found to be higher than the other students who lived in counties or villages at a significant level (Table 2).
Table 2: The Comparison of the mean score that they received from the environmental attitude scale according to socio-demographical characteristics of participants.
Secondary
environmental behavior scale (X±SS)
P value
Secondary
environmental attitude scale (X±SS)
P value
Gender
Women 38.92±9.15 0.740* 100.37±12.51
0.602*
Men 38.57±10.85 99.65±14.33
Age
17-19 38.31±9.38 100.97±11.65
0.123**
20-22 40.05±9.79 0.097** 100.96±12.99
≥ 23 37.43±10.57 97.82±15.22
Grade
First 39.42±9.37 0.131* 101.33±12.28 0.034*
Fourth 37.86±10.64 98.30±14.54
Faculties
Faculty of Dentistry 33.22±9.00 0.001** 92.27±15.10
0.001** Faculty of Pharmacy 37.90±10.43 97.81±14.67
Faculty of Economics and
Administrative Sciences 47.60±9.19
a 111.10±11.61a
Faculty of Theology 37.55±11.26 97.00±12.30 Faculty of Arts and
Sciences 37.50±8.41 98.15±12.97
Faculty of Sport Sciences 37.41±7.24 93.16±11.99 Faculty of Medicine 38.05±7.47 95.88±12.66 Faculty of Education 38.52±10.52 100.15±11.96 Faculty of Engineering 41.70±8.97a 104.73±12.81a Faculty of Health Sciences 36.80±9.65 97.17±12.15 Faculty of Law 38.72±11.79 103.78±13.78
Father's educational status
Illiterate 29.77±12.00 86.66±12.84
Literate 40.00±10.47 98.78±15.13
Primary school 37.07±9.20 98.30±12.66
Middle school 36.88±10.27 97.86±13.14
Secondary school 40.28±9.58a 0.005** 102.10±14.18a 0.004** Undergraduate or Postgraduate 40.25±9.81a 102.08±11.62a
Mother's educational status
Illiterate 92.17±13.64 34.12±10.01a
Literate 96.28±10.48 37.60±8.47
Primary school 98.92±12.76 0.001** 36.96±9.59 0.001**
Middle school 103.23±13.80 41.39±9.32
Secondary school 103.60±12.72a 41.83±9.10 Undergraduate or
Postgraduate 102.15±13.82 39.81±12.04
Income status
≤ 1300 TL 95.81±12.33a 36.18±8.91a
1301-2300 TL 99.17±12.66 0.002** 37.66±9.74 0.004**
2301-3300 TL 102.95±13.99 40.59±9.93
≥3301 TL 101.87±13.52 40.87±10.66
Living place
Village 36.41±9.30 0.258** 96.62±14.09 0.040**
Counties 39.15±9.47 98.09±13.28
Citya 39.04±10.16 101.22±13.12
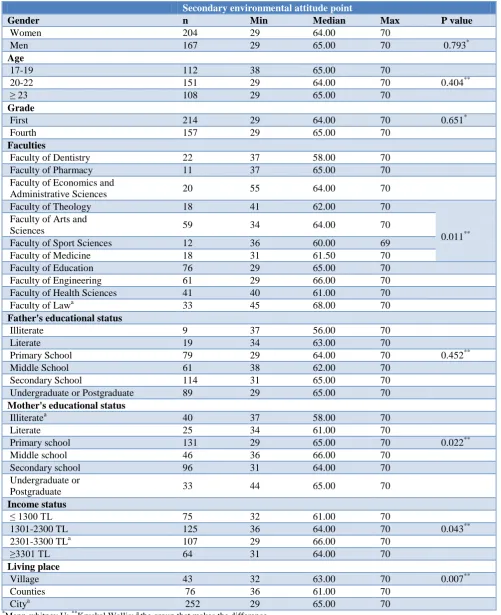
Table 3: The comparison of the point score that they received from the secondary environmental attitude scale according to socio-demographical characteristics of students
Secondary environmental attitude point
Gender n Min Median Max P value
Women 204 29 64.00 70
Men 167 29 65.00 70 0.793*
Age
17-19 112 38 65.00 70
20-22 151 29 64.00 70 0.404**
≥ 23 108 29 65.00 70
Grade
First 214 29 64.00 70 0.651*
Fourth 157 29 65.00 70
Faculties
Faculty of Dentistry 22 37 58.00 70
Faculty of Pharmacy 11 37 65.00 70
Faculty of Economics and
Administrative Sciences 20 55 64.00 70
Faculty of Theology 18 41 62.00 70
0.011** Faculty of Arts and
Sciences 59 34 64.00 70
Faculty of Sport Sciences 12 36 60.00 69
Faculty of Medicine 18 31 61.50 70
Faculty of Education 76 29 65.00 70
Faculty of Engineering 61 29 66.00 70 Faculty of Health Sciences 41 40 61.00 70
Faculty of Lawa 33 45 68.00 70
Father's educational status
Illiterate 9 37 56.00 70
Literate 19 34 63.00 70
Primary School 79 29 64.00 70 0.452**
Middle School 61 38 62.00 70
Secondary School 114 31 65.00 70
Undergraduate or Postgraduate 89 29 65.00 70
Mother's educational status
Illiteratea 40 37 58.00 70
Literate 25 34 61.00 70
Primary school 131 29 65.00 70 0.022**
Middle school 46 36 66.00 70
Secondary school 96 31 64.00 70
Undergraduate or
Postgraduate 33 44 65.00 70
Income status
≤ 1300 TL 75 32 61.00 70
1301-2300 TL 125 36 64.00 70 0.043**
2301-3300 TLa 107 29 66.00 70
≥3301 TL 64 31 64.00 70
Living place
Village 43 32 63.00 70 0.007**
Counties 76 36 61.00 70
Citya 252 29 65.00 70
*
Table 4: The comparison of the mean score that they received from the environmental attitude scale according to several behavioral characteristics of participants.
Characteristics Secondary
environmental behavior Scale (X±SS)
P value
Secondary environmental attitude scale
(X±SS)
P value
Play sports status
Yes 41.15±9.10 0.006 99.97±14.79
0.955
No 37.94±10.10 100.07±12.84
Ownership of hobby related with nature
Yes 41.78±9.37 104.10±13.07
0.001
No 37.17±9.88 0.001 97.91±13.02
When the average points of the students were examined in terms of various characteristics, it was observed that the average secondary environmental behavior scale points of the students who did sports were found to be higher than those who did not do sports. The Environmental Attitude Scale points of the students who had at least one hobby related with the nature were found to be 104.10± 13.07; and the points of those who did not have any hobbies were found to be 97.91±13.02 (Table 4).
DISCUSSION
In the comparison of the average points of the students received from the environmental attitude scale according to their socio-demographic characteristics, it was determined that the average points of the female students were higher than those of the male students; however, the difference was not found to be statistically significant. In a study conducted at Adnan Menderes University, it was determined that the average points of the female students were higher than those of the male students at a statistically significant level.12 Kaya et al conducted a study on high school students and determined that the female students had more positive attitudes than the male students.13 Kayali conducted a study on teacher candidates about environmental problems and reported that female students had more positive attitudes than the male students.14 The points received by the female students being higher than the male students in our study show similarity with the results of the previous studies. Another study supporting the findings of this study was conducted by Eagles and Demare and they reported that there were no differences between the ecological attitudes and the gender variable, and added that the female students had higher moral attitudes, which is consistent with our results.15
When the grades of the students and their average points received in the scale were compared in our study, it was observed that the first grade students received higher points than the fourth grade students at a significant level; and no differences were determined between the grades in terms of secondary environmental attitude scale. Ek et al conducted a study on university students by using the environmental attitude scale and reported that the average
points of the students who were studying at the last grades were higher than those who studied at the first grades.12 The difference between may be interpreted as not providing classes on environmental issues at universities at an adequate quality or the awareness on the subject decreasing in time.
When the average points received in the environmental attitude scale and the secondary environmental behavior scale were compared with the faculties of the students, it was observed that the students who were studying at Faculty of Economics and Administrative Sciences and Engineering Faculty had higher points than the other students at a significant level, and the students of Engineering Faculty and Faculty of Law received higher points in secondary environmental attitude scale. In a study conducted by Ozmen et al, it was reported that although there were differences between the departments of the students in terms of environmental attitude scale points, these differences were in favor of the Faculty of Medicine students.16 Sama et al conducted a study at Foreign Languages Department of Gazi University, and reported that the students had higher points in Environmental Attitude Scale than the other departments.17 It is possible to claim that this difference between the departments or faculties stem from the departments being close or far to the Natural Sciences and Social Sciences, or according to the students’ profiles.
parents increased, there were improvements in the attitudes towards the environment.18 When the studies conducted so far are examined it is observed that there is a positive relation between the educational status of the parents and the environmental attitudes. These findings show parallelism with the findings of our study, and it may be concluded that the students who are raised in a family medium of higher educational status have more positive attitudes towards the environment and environmental problems, and educational factor influences not only the individuals and the next generations in a positive manner.
In our study, the average points of the students whose monthly income levels were 1300 TL and below in secondary environmental attitude scale were found to be lower than the other groups at a significant level. Eser conducted a study to examine the environmental attitudes of the students according to the income levels of their families, and reported that the environmental attitude points of the children of the families of middle-level income were higher than the children coming from low-level incomes.19
The environmental attitude scale average points of the students who lived in the city for most of the time were found to be higher than those who lived in the counties or villages at a significant level. In a study investigating the relation between the living place of the students and the average of the total points received from the environmental attitude scale, it was determined that the average points of those who were living in the city center for most of the time were higher than those who were living in villages at a statistically significant level.12 In a similar study, the environmental attitude scale average points of the students who lived in the city center for most of the time in their life cycles were found to be higher than the other students at a statistically significant level.16 Kose conducted a study to measure the attitude and knowledge elements of environmental literacy and reported that there was significant differences in terms of the place where the individuals lived for most of the time.18 All the findings support our study, and the environmental problems being experienced at a concretely intense manner in cities makes us consider that students develop more positive attitudes towards environmental problems.
In our study, when the points received by the students in environmental behaviors and secondary environmental attitude scale were compared, no significant differences were determined. A study conducted by Gedik supports the findings of our study.20 In another study, no statistically significant differences were reported between the ages of the students and their Environmental Attitude Scale points.10 In several other studies in the literature, statistically significant differences were reported between the total points and the age variable.16-21
When the average points of the students received in the scale and their various characteristics were evaluated it was observed that the secondary environmental behavior scale average points of the students who did sports were higher than those who did not do sports at a significant level. The secondary environmental behavior scale and the environmental attitude scale average points of the students who had at least one hobby related with the nature were determined to be higher than those students who did not have any hobbies related with the nature at a significant level.
In the study, the environmental attitudes of the students who were studying at the first grade were found to be higher than those who studied at the fourth grade. While the environmental attitudes of the students who studied at Faculty of Economics and Administrative Sciences and Engineering Faculty were found to be higher, the points of the students who studied at Faculty of Dentistry were found to be at the lowest level. When the educational status of the parents was considered, it was determined that the students whose mothers were not literate had low-level sensitivity towards the environment. It has been observed that the educational factor is influential not only on students but also on the parents and therefore on the next generations. It was also determined that the students who lived in cities and the students who had at least one hobby were more sensitive towards the environment than those who lived in counties and villages and who did not have hobbies. In the light of these results, activities may be organized to increase sensitivity and attitudes towards the environment by cooperating with voluntary environmental institutions at universities. For this purpose, student clubs may be created and panels and conferences may be organized. The students may be influenced to be more sensitive towards the environment by environmental-friendly regulations at university campuses.
ACKNOWLEDGEMENTS
We owe thanks to the First Grade Students at the Faculty of Medicine due to their assistance and contribution in applying the questionnaire in the data collection stage of the study.
Funding: No funding sources Conflict of interest: None declared
Ethical approval: The study was approved by the Institutional Ethics Committee
REFERENCES
1. Güler Ç, Benli D. Halk Sağlığı, Temel Bilgiler. 1th ed. Hacettepe University Press. Ankara, Turkey; 2006.
3. Doğan M. Ulusal çevre eylem planı: Eğitim ve katılım. T.C. Başbakanlık Devlet Planlama Teşkilatı. Ankara, Turkey; 1997.
4. Sisli N. Çevre Bilim. Gazi Kitapevi, Ankara, Turkey; 1997.
5. Oweini A, Houri A. Factors Affecting Environmental Knowledge and Attitudes among Lebanese College Students. Applied Environ Edu Communication. 2006;5(1):95-105.
6. Wong KK. The environmental awareness of university students in Beijing, China. J Contemporary China. 2003;12:519-36.
7. Vitousek PM, Mooney HA, Lubchenco J, Melillo JM. Human domination of Earth's ecosystems. Science. 1997;277:494-9.
8. Güler Ç. Çevre sağlığı. Palme Yayıncılık. Ankara, Turkey; 2012.
9. Frank M. Impact of the environment on reproductive health. Prog Hum Reprod Res 1991;(20):1-11.
10. Özdemir O, Yıldız A, Ocaktan E, Sarışen Ö. Tıp fakültesi öğrencilerinin çevre sorunları konusundaki farkındalık ve duyarlılıkları. Ankara Üniversitesi Tıp Fakültesi Mecmuası. 2004;57(3):117-27. 11. Uzun N, Sağlam N. Development and Validation of
an Environmental Attitudes Scale For High School Students. Hacettepe Univ J Edu. 2006;30:240-50. 12. Ek HN, Kılıç N, Öğdüm P, Düzgün G, Şeker S.
First and Senior Class Adnan Menderes University Student’s Attitudes, Towards Environmental Problems. Kastamonu Edu J. 2009;17:125-36. 13. Kaya E, Akıllı M, Sezek F. An Investigation of
High School Students’ Environmental Attitudes In Terms of Gender. Mehmet Akif Ersoy Univ J Education Faculty. 2010;18:43-54.
14. Kayalı H. Social Studies, Turkish And Classroom Teacher Candidates Attitudes Towards
Environmental Issues. Marmara Geographical Rev. 2010;21(13):258-68.
15. Eagles PF, Demare R. Factors influencing children's environmental attitudes. J Environ Edu. 1999;30(4):33-7.
16. Özmen D, Çetinkaya AÇ, Nehir S. University Students’ Attitudes Towards Environmental Problems. TAF Prevent Med Bulletin. 2005;4(6):330-44.
17. Erdoğan Ş. Teacher Candidates’ Attitudes Toward Environmental Problems. Gazi Univ J Gazi Edu Faculty. 2003;23(2):99-110.
18. Köse EO. The Factors That Affect Attitudes towards Environment of Secondary School Students. J Turksh Sci Edu. 2010;7(3):198-231.
19. Eser A. This research has been done in order to analyze the relationship between the levels of loneliness and shyness of elementary school students. Social Sciences Institute, Yeditepe Universty, Turkey; 2012.
20. Gedik K. The Analysis of the students environmental attitudes in vocational training high schools. Institute of Education Sciences, Yeditepe Universty, Turkey; 2015.
21. Görümlü T. Important of enviromental education forming sensitiviti to enviroment at high schools. Institute of Education Sciences, Gazi Universty, Turkey; 2003.