Original Research Article
Prevalence of generalized and abdominal obesity: India’s big problem
Vamsi Krishna Undavalli
1*, Satyanarayana Chowdary Ponnaganti
1, Hanumanth Narni
2INTRODUCTION
Worldwide, overweight and obesity cause more deaths than underweight. The combined burden of these diet-related risks and physical inactivity in low and middle income countries is similar to that caused by HIV/AIDS and tuberculosis. Obesity is generally classified as generalized obesity (GO) and abdominal obesity (AO). Obese have higher rates of mortality and morbidity compared to non obese individuals.1
In India, obesity is emerging as an important health problem particularly in urban areas, replacing the more
traditional public health concerns including
undernutrition. Overweight or obesity is seen in 30-65% of adult urban population.2 ICMR-INDIAB Study (Phase-I) study showed the prevalence of generalized and abdominal obesity was higher in India now compared to earlier studies. Prevalence of abdominal obesity was higher than the generalized obesity. However both forms of obesity is high in urban residents than the rural residents. This study is of significance because it shows large increases in prevalence of obesity not only in urban areas but also in rural areas in India.3
The rising prevalence has a direct correlation with
obesity-related co-morbidities; hypertension, the
metabolic syndrome, dyslipidemia, type 2 diabetes
ABSTRACT
Background: The rising prevalence overweight and obesity in India has a direct correlation with the increasing prevalence of obesity-related co-morbidities; hypertension, the metabolic syndrome, dyslipidemia, type 2 diabetes mellitus, and cardiovascular disease. The risk for these disorders appears to start from a body mass index (BMI) of about 21 kg/m2. The objective of the study was to know the prevalence of generalized and abdominal obesity in the field practice area.
Methods: A community based cross-sectional study conducted among 309 people in the rural field practice area of medical college from January to March, 2017.
Results: In the present study prevalence of generalized, abdominal and combined obesity was 56%, 71.2% and 51.3% respectively.
Conclusions: Prevention of obesity should begin in early childhood. Obesity is harder to treat in adults than it is in children. The control of obesity centers on the weight reduction. Information Education and Communication (IEC), Behaviour change communication (BCC) is used to encourage individuals of the society to adopt healthy behaviours like dietary modifications, increased physical activity and a combination of both.
Keywords: Overweight, Body mass index, Waist circumference, Generalized obesity, Abdominal obesity, Systematic random sampling
Department of Community Medicine, 1Dr. Pinnamaneni Siddhartha Institute of Medical Sciences and Research Foundation, Chinna Avutapalli, 2Gayatri Vidya Parishad Institute of Health Care and Medical Technology, Visakhapatnam, Andhra Pradesh, India
Received: 19 February 2018
Revised: 06 March 2018
Accepted: 07 March 2018
*Correspondence:
Dr. Vamsi Krishna Undavalli, E-mail: [email protected]
Copyright: © the author(s), publisher and licensee Medip Academy. This is an open-access article distributed under the terms of the Creative Commons Attribution Non-Commercial License, which permits unrestricted non-commercial use, distribution, and reproduction in any medium, provided the original work is properly cited.
mellitus (T2DM), and cardiovascular disease (CVD).4 As it was evident based on 33 cohort studies carried out within the Asia-Pacific region found that that adult BMIs of >21 kg/m2 were associated with the development of type II diabetes (diabetes mellitus), ischaemic heart disease, stroke, hypertensive heart disease, osteoarthritis, and cancers of the postmenopausal breast, colon, endometrium and kidney.5 Present study was conducted to know the prevalence of generalized and abdominal obesity in the field practice area.
METHODS
Study design
It was a community based cross-sectional study conducted in rural field practice area under the Department of Community Medicine, Dr. Pinnamaneni SIMS&RF, A.P. Study has been done or a period of 3 months from January to March, 2017.
Study population
Study population was constituted by people >20 years of age residing in field practice area.
Inclusion criteria
Purpose of the study was explained and those who showed interest to participate after giving consent were included in the study.
Exclusion criteria
Exclusion criteria were those who are not willing to participate in the study.
Sample size and samplings
Rural health and training center caters services to 9 villages with a population of 31,420. According National Family Health Survey 2015-16 (NFHS-4) 28% of men and 27.6% of women in rural areas of Andhra Pradesh are overweight or obese.6 Taking prevalence of 28% and 95% confidence interval, the required sample size for 31,420 population was 309 with the assumption of 20% non response rate. From nine villages one village with population 4579 was selected randomly and systematic random sampling was used for selecting the households. Fortunately non response rate is zero and continued the study till the sample size reaches 309.
Formula used for sample size calculation7
n= [Zα/22 × P × (1-p)] / d2
Systematic random sampling8
Suppose the N units in the population are numbered 1 to N in some order. Suppose further that N is expressible as a product of two integers n and k, so that N= nk.
To draw a sample of size n,
Select a random number between 1 and k.
Suppose it is i.
Select the first unit whose serial number is i.
Select every kth unit after ith unit.
Sample will contain i, i+ k, i+2k,...,i+(n-1)k serial number units.
Here N= 4579 & n = 309.
k= Number of units in population/Number of sample units required.
= 4579/309
= 14.81 rounded to 15
First selected random numberi (1 to 15) = 2.
Second unit (i+k)th= 2+15= 17.
Third unit (i+2k)th= 2+34= 36 and so on..
Selected households in the study are 2nd, 17th, 34th ……..till the required sample.
Study instruments and data collection
Data regarding Socio-demographic variables, behavioural risk factors was collected and physical measurements were recorded. The data was collected by personally interviewing the study participants.
Recording of anthropometric measurements3,9
Height (in centimeters) was measured using a stadiometer. The individual was asked to stand upright without shoes with his/her back against the vertical back board, heels together and eyes directed forward.
Weight (in kilograms) was measured with an electronic weighing scale that was kept on a firm horizontal flat surface. Subjects were asked to wear light clothing, and weight was recorded to the nearest 0.5 kg.
Body mass index (BMI) was calculated using the formula weight (kg)/height (m2)
Waist circumference (in centimeters) was measured using a non-stretchable measuring tape. Waistcircumference was measured at the smallest horizontal girth between the costal margins and the iliac crestat the end of expiration.
Definitions3,9
Generalized obesity (GO) was defined as a BMI≥25 kg/m2 for both genders (based on the World Health Organization Asia Pacific guidelines) with or without abdominal obesity (AO).
Abdominal obesity (AO) was defined as a waist circumference (WC) ≥90 cm for men and ≥80 cm for women with or without GO.
Isolated generalized obesity (IGO) was defined as a BMI ≥25 kg/m2
with waist circumference of <90 cm in men and <80 cm in women.
Isolated abdominal obesity (IAO) was defined as a waist circumference of ≥90 cm in men or ≥80 cm in women with a BMI <25 kg/m2.
Combined obesity (CO): Individuals with both GO and AO.
Non obese subjects: Individuals without either GO or AO.
Ethical issues
Ethical clearance was obtained from the institutional ethical committee prior to the start of study. Written informed consent was obtained after explaining the importance of the study in detail. Questionnaire does not
contain any identification details of the participant and confidentiality was maintained throughout the study.
Statistical analysis
Data entry and statistical analysis was done using SPSS v 16. The results were explained in simple proportions. Difference between groups was assessed using chi squaretest for their statistical significance. P value less than 0.05 was considered significant.
RESULTS
In the present study prevalence of generalized, abdominal and combined obesity was 56%, 71.2% and 51.3% respectively.
Table 1 shows the socio-demographic characteristics such as age, sex, and religion of non obese (n=136) and
generalized obesity (n=173) groups. The GO was
significantly higher in individuals between 41-50 years. There was significant difference in the two groups with respect to age. There were predominantly Hindus in the study.
Out of these 173 GO subjects, previous history of hypertension was given by 26 (15.1%) subjects and 38 (22.0%) subjects reported history of diabetes. There was significant difference in GO prevalence among those with history of hypertension, diabetes and alcoholism.
Table 1: Generalized obesity based on BMI.
Variable Categories
BMI
Chi-square value
P value
<25 non obese ≥25 generalized obesity
Count % Count %
Age
≤ 30 45 33.1 21 12.1
36.67 <0.001
31-40 24 17.6 46 26.6
41-50 20 14.7 59 34.1
51-60 24 17.6 34 19.7
61-70 17 12.5 10 5.8
71-80 4 2.9 3 1.7
81-90 2 1.5 0 0.0
Total 136 100.0 173 100.0
Gender
Female 85 62.5 101 58.4
0.54 0.46
Male 51 37.5 72 41.6
Total 136 100.0 173 100.0
Religion
Hindu 99 90.0 117 83.0
4.47 0.11
Christian 8 7.3 22 15.6
Muslim 3 2.7 2 1.4
Total 110 100.0 141 100.0
Education
Primary 30 36.1 48 39.0
7.66 0.11
Secondary 19 22.9 35 28.5
Intermediate 11 13.3 15 12.2
UG 20 24.1 14 11.4
PG and above 3 3.6 11 8.9
Total 83 100.0 123 100.0
Marital Status
Unmarried 11 8.1 4 2.3
5.5
0.02
Married 125 91.9 169 97.7
Variable Categories
BMI
Chi-square value
P value
<25 non obese ≥25 generalized obesity
Count % Count %
Smoking
No 121 89.0 145 83.8
1.69 0.19
Yes 15 11.0 28 16.2
Total 136 100.0 173 100.0
Consume Alcohol
No 123 91.1 137 82.0
5.14 0.02
Yes 12 8.9 30 18.0
Total 135 100.0 167 100.0
HTN
Non HTN 128 94.1 146 84.9
6.59 0.01
HTN 8 5.9 26 15.1
Total 136 100.0 172 100.0
Diabetes
No 127 93.4 135 78.0
13.91 <0.001
Yes 9 6.6 38 22.0
Total 136 100.0 173 100.0
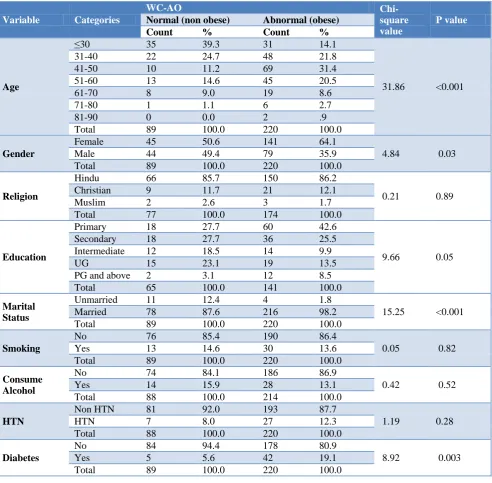
Table 2: Abdominal obesity.
Variable Categories
WC-AO
Chi-square value
P value
Normal (non obese) Abnormal (obese)
Count % Count %
Age
≤30 35 39.3 31 14.1
31.86 <0.001
31-40 22 24.7 48 21.8
41-50 10 11.2 69 31.4
51-60 13 14.6 45 20.5
61-70 8 9.0 19 8.6
71-80 1 1.1 6 2.7
81-90 0 0.0 2 .9
Total 89 100.0 220 100.0
Gender
Female 45 50.6 141 64.1
4.84 0.03
Male 44 49.4 79 35.9
Total 89 100.0 220 100.0
Religion
Hindu 66 85.7 150 86.2
0.21 0.89
Christian 9 11.7 21 12.1
Muslim 2 2.6 3 1.7
Total 77 100.0 174 100.0
Education
Primary 18 27.7 60 42.6
9.66 0.05
Secondary 18 27.7 36 25.5
Intermediate 12 18.5 14 9.9
UG 15 23.1 19 13.5
PG and above 2 3.1 12 8.5
Total 65 100.0 141 100.0
Marital Status
Unmarried 11 12.4 4 1.8
15.25 <0.001
Married 78 87.6 216 98.2
Total 89 100.0 220 100.0
Smoking
No 76 85.4 190 86.4
0.05 0.82
Yes 13 14.6 30 13.6
Total 89 100.0 220 100.0
Consume Alcohol
No 74 84.1 186 86.9
0.42 0.52
Yes 14 15.9 28 13.1
Total 88 100.0 214 100.0
HTN
Non HTN 81 92.0 193 87.7
1.19 0.28
HTN 7 8.0 27 12.3
Total 88 100.0 220 100.0
Diabetes
No 84 94.4 178 80.9
8.92 0.003
Yes 5 5.6 42 19.1
Table 3: Combined obesity: Individuals with both GO and AO.
Variable Categories
BMI and WC- CO
Chi-square value
P value
Non obese Obese
Count % Count %
Age
≤30 49 32.5 17 10.8
36.54 <0.001
31-40 30 19.9 40 25.3
41-50 22 14.6 57 36.1
51-60 27 17.9 31 19.6
61-70 17 11.3 10 6.3
71-80 4 2.6 3 1.9
81-90 2 1.3 0 0.0
Total 151 100.0 158 100.0
Gender
Female 90 59.6 96 60.8
0.04 0.84
Male 61 40.4 62 39.2
Total 151 100.0 158 100.0
Religion
Hindu 112 89.6 104 82.5
3.83 0.15
Christian 10 8.0 20 15.9
Muslim 3 2.4 2 1.6
Total 125 100.0 126 100.0
Education
Primary 32 33.0 46 42.2
9.59 0.05
Secondary 26 26.8 28 25.7
Intermediate 14 14.4 12 11.0
UG 22 22.7 12 11.0
PG and above 3 3.1 11 10.1
Total 97 100.0 109 100.0
Marital Status
Unmarried 12 7.9 3 1.9
6.12 0.01
Married 139 92.1 155 98.1
Total 151 100.0 158 100.0
Smoking
No 131 86.8 135 85.4
0.11 0.74
Yes 20 13.2 23 14.6
Total 151 100.0 158 100.0
Consume Alcohol)
No 131 87.9 129 84.3
0.82 0.37
Yes 18 12.1 24 15.7
Total 149 100.0 153 100.0
HTN
Non HTN 141 94.0 133 84.2
7.56 0.006
HTN 9 6.0 25 15.8
Total 150 100.0 158 100.0
Diabetes
No 141 93.4 121 76.6
16.89 <0.001
Yes 10 6.6 37 23.4
Total 151 100.0 158 100.0
Table 2 shows the sociodemographic characteristics of non obese (n=89) and abdominal obesity (n=220) groups. It can be seen that there was no significant difference in
religion, smoking, history of alcohol, known
hypertensives in the two groups. The abdominal obesity was significantly higher in women, married and those who are known diabetics (p=0.003).
Table 3 shows the sociodemographic characteristics of non obese (n=151) Individuals with both GO and AO i.e. combined obesity (158) groups.
There was significant difference in CO prevalence among those with history of hypertension (p=0.006), diabetes (p≤0.001), age (41-50 yrs) (p≤0.001) and marital status (p=0.001).
DISCUSSION
urban women in the state were obese against the 27.6 per cent women in rural Andhra Pradesh.8
In a study conducted in urban north India (New Delhi), the overall prevalence of generalized obesity was 50.1 per cent, while that of abdominal obesity was 68.9 per cent.10
Study conducted by Pradeepa et al, reported that prevalence of GO, AO and CO were significantly higher among urban residents compared to rural residents in all the four regions studied.3
The Chennai urban rural epidemiology study (CURES) conducted in Chennai city in Tamil Nadu reported age standardized prevalence of generalized obesity to be 45.9 per cent, while that of abdominal obesity was 46.6 per cent.11
The present study showed that the prevalence of generalized, abdominal and combined obesity was significantly higher in women and individuals in the age group of 41-50 years. Pandey et al, in their study reported higher prevalence of obesity among women.12
CONCLUSION
It appears clear to us that the problems of overweight and obesity are no longer limited to the urban rich. The strong association of obesity with cardiovascular disease, diabetes, high blood pressure and some cancers necessitates the importance of prevention and control of obesity. Prevention of obesity should begin in early childhood. Obesity is harder to treat in adults than it is in children. The control of obesity centers around the weight reduction. Information education and communication (IEC), Behaviour change communication (BCC) is used to encourage individuals of the society to adopt healthy behaviours like dietary modifications, increased physical activity and a combination of both.
Funding: No funding sources Conflict of interest: None declared
Ethical approval: The study was approved by the Institutional Ethics Committee
REFERENCES
1. Geneva: Switzerland, WHO; 2009. World Health
Organization (WHO). Global health risks: mortality and burden of disease attributable to selected major risks.
2. Misra A, Khurana L. Obesity and the metabolic
syndrome in developing countries. J Clin
Endocrinol Metab. 2008;93(11):9-30.
3. Pradeepa R, Anjana RM, Joshi SR, Bhansali A,
Deepa M, Joshi PP, et al. Prevalence of generalized
& abdominal obesity in urban & rural India- the ICMR - INDIAB Study (Phase-I) [ICMR- INDIAB-3]. Indian J Med Res. 2015;142:139-50.
4. Gupta R, Gupta VP, Sarna M, Bhatnagar S, Thanvi
J, Sharma V, et al. Prevalence of coronary heart disease and risk factors in an urban Indian population: Jaipur Heart Watch-2. Indian Heart J. 2002;54(1):59-66.
5. James WPT, Jackson-Leach R, Ni Mhurchu C,
Kalamara E, Shayeghi M, Rigby NJ, et al. Overweight and obesity (high body mass index) In: Ezzati M, Lopez AD, Rodgers A, Murray CJL, editors. Comparative quantification of health risks: global. 2004: 1-1200.
6. India’s obesity doubled in 10 years: NFHS-4.
Downtoearth.org.in. 2017. Available at:
http://www.downtoearth.org.in/news/nfhs-4- highlights-india-has-become-obese-more-than-doubled-in-one-decade-only-52527. Accessed on 2 August 2017.
7. Charan J, Biswas T. How to Calculate Sample Size
for Different Study Designs in Medical Research? Indian J Psychological Med. 2013;35(2):121-6.
8. Sampling Theory/Chapter 11/Systematic Sampling.
2017. Available at: http://home.iitk.ac.in/
~shalab/sampling/chapter11-sampling-systematic-sampling.pdf. Accessed on 1 March 2017.
9. The Asia Pacific perspective: redefining obesity and
its treatment. Regional Office for the
WesternPacific (WPRO), World Health
Organization. International Association for the Study of Obesity and the International Obesity Task
Force. St Leonards, Australia: Health
Communications Australia Pty Ltd; 2000: 22–29. 10. Bhardwaj S, Misra A, Misra R, Goel K, Bhatt SP,
Rastogi KV, et al. High prevalence of abdominal, intra-abdominal and subcutaneous adiposity and clustering of risk factors among urban Asian Indians in North India. PLoS One. 2011;6:e24362.
11. Deepa M, Farooq S, Deepa R, Manjula D, Mohan V. Prevalence and significance of generalized and central body obesity in an urban Asian Indian population in Chennai, India (CURES: 47) Eur J Clin Nutr. 2009;63:259–67.
12. Pandey RM, Gupta R, Misra A, Misra P, Singh V, Agrawal A, et al. Determinants of urban-rural differences in cardiovascular risk factors in middle-aged women in India: a cross-sectional study. Int J Cardiol. 2013;163:157–62.