COMPARISON BETWEEN HEURISTICS
AND METHODOLOGIES TO SOLVE
THE NSLP
R. MONTOYA-ZAMORA
Faculty of Engineering, University of Querétaro, Río Moctezuma 249, San Juan del Río, Querétaro 76800, México
J. A. ROMERO
Faculty of Engineering, University of Querétaro, Río Moctezuma 249, San Juan del Río, Querétaro 76800, México
R. GUZMAN-CRUZ
Faculty of Engineering, University of Querétaro, Cerro de las Campanas sin número, Querétaro, Querétaro 76010, México
Abstract:
For transportation planners update Origin-Destination matrices from traffic counts constantly is very common and very important and sometimes they need to evaluate networks such as the importance of a network or those links which get most information, or place geographically where sensor should be located to update an OD matrix. The importance of decide where a sensor should be placed appears in terms of how many of them and where they should be placed according to the network characteristics. Many techniques have been applied to solve this common problem called: Network Sensor Location Problem but which one present better results or which one takes less computing time. In this paper a comparison between different methodologies to solve the NSLP and the relation with the minimum spanning tree, is presented.
Keywords: sensor location; minimum spanning tree; heuristic; optimization; traffic assignment.
1. Introduction
Traffic planning requires a set of activities to determine user demands according to their desires of movement so interviews are the main source for taking a decision. Different circumstances to carry out these studies could consider vial reorder or construction of new infrastructure such as bypass or highways. In this context these changes require an important monetary inversion so traffic studies should be realize with information of good quality.
But interviews result to be expensive so planners have been updating trips from traffic counts but the question now is where this counts should be placed in a network to get as much as possible information? And man researches around the world have been working and developing different methodologies to solve a common problem known as the Network Sensor Location Problem (NSLP) in order to keep their OD matrices updated.
In the bibliography there have been a set of techniques and methodologies that attend all the necessary aspects to minimize those efforts to get the information, maximizing the potencial utility of information. By this way, for example, with the minimum of stations, it is gotten the major quantity of significant information.
On this article there have been analyzed four of those methodologies searched in the bibliography to give an idea of what are the advantages and disadvantages of using each one of them and of course identifying some necessities of research into the development of new methodologies. This is the case of methodologies that take account levels of traffic over the network.
Finally and supposing that many OD pairs follow the shortest paths then those links which have less time are going to be attractive by users and probably they will have many trips passing through them so sensors should be placed on them. Using the Minimum Spanning Tree solution, it is analyzed with sensor location.
2. Theoretical considerations
In this chapter four techniques were applied to solve the NSLP in order to give an idea to the reader which tool is more useful at the moment of solving the NSLP. Moreover a brief description of each technique used to solve the NSLP is presented. Some advantages and disadvantages area presented to.
2.1. Heuristics
Some algorithms require exponential time to solve a problem while others cannot find an efficient solution in short time that’s the case of the salesman problem where the most efficient algorithms require exponencial time. In these cases heuristics are applied to find a solution that approximates to the optimal [3]. The word heuristic comes from the Greek word heuriskein that means “to find” but [16] define heuristic as a technique that find good solutions (almost the optimal) at a reasonable time but there is no guarantee that the result is the optimal solution and in some cases it is not measurable how far the solution is from the factible solution.
2.2. Classical optimization techniques
There are different techniques to solve an optimization problem for example, integer, linear or non linear functions. When the optimizacion problem has these characteristics, it is not necessary to use heuristics [3]. Coello propose that classic techniques (Simplex method) should be used first to solve an optimization problem instead of a heuristic.
2.3. Evolutionary computation
3. Materials and methods
Four methods were chosen to be compared between them in order to get advantages and disadvantages from each one. Searching in the literature it is found that there have been applied a lot of methodologies to solve the NSLP but few of these methodologies were applied on real networks, such as [17], [4], [2], [21], [18], [6], and [7] an that’s why the greedy heuristic applied by [10] but used with links and Ignizio’s heuristic, described by [4], were choosen to be evaluated in this paper while the others were not chosen because they use simulation, or links are applied on nodes instead of links.
Another methodology to be evaluated is the classical Simplex method to solve an optimization problem. In this paper, Solver from Microsoft Excel was used to solve the NSLP.
The rest of the literature found focus on sensors placed on nodes and methodologies that were applied on hypothetical networks. From these methodologies, stochastic methodologies such as [9], [19], [1], [14], and [13] were removed because the Simplex method is considered a deterministic model and the methodologies should seem to be similar so from the rest of the methodologies, [11] was chosen because it is the only one that considers network topology as a parameter to place sensors while some of the others follow some rules established by [20].
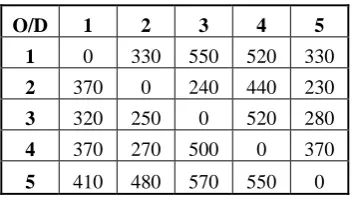
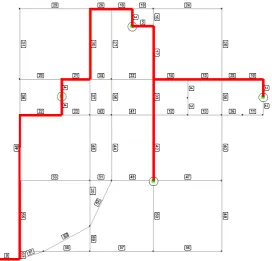
Once the methodologies were chosen, a network and an origin destination matrix were elected to. Figure 1 shows the proposed network, developed by [15], to be evaluated while table 1 shows the OD matrix between the five centroids selected.
Table 1. OD matrix used to represent trips between centroids.
O/D 1 2 3 4 5
1 0 330 550 520 330
2 370 0 240 440 230
3 320 250 0 520 280
4 370 270 500 0 370
5 410 480 570 550 0
3.1. Hodgson’s methodology
[10] used the Flow Covering Location Allocation Model (FCLM). The FCLM is considered as a special case of the maximal covering location problem and it is defined as an optimization problem. To solve the NSLP, he used two heuristics:
Multiple Coverage Greedy Heuristic chooses the p nodes, with the greatest flows, passing through them. Flows that pass through a node and were selected in one step may be counted again in a subsequent step.
Non-Multiple Coverage Greedy Heuristic chooses the p nodes, with the greatest flows, passing through them but when a node is selected all flows that pass through a node are removed.
This second heuristic (Non-Multiple Coverage Greedy Heuristic) used by Hodgson and applied on nodes was changed to be applied on links. This heuristic follows these steps:
Choose the link with the greatest flow
Select all OD pairs that pass through this link
Removed this OD pair from the OD matrix.
Taking advantage of its capabilities this heuristic was programmed as an Add-In in TransCAD. TransCAD is a Geographic Information System (GIS) designed to analyze transportation data.
3.2. Ignizio’s heuristic
This heuristic was developed by Ignizio and it tries to eliminate disadvantages of using a greedy heuristic. This follows these steps [4]:
Get the information that would be caught on each link. It is chosen as the first sensor the link that caught the most information as possible.
The information that has not been caught is getting by the links that have been chosen. It is chosen as a station the link that caught the most information as possible.
On each link it is get the difference between the total information caught and the information that would be caught if it is discarded that link.
If the number of chosen sensors is less than k, go to the step 2, in other case finish the algorithm.
3.3. Linear programming
Solver is the tool selected to solve the NSLP with Simplex method used in Microsoft Excel. This model was formulated as follows:
n i i ix
a
Z
Max
1 (1.1) Subject to:
n i i rsi
x
r
s
1
,
1
(1.1a)
n i ik
x
11 (1.1b)
i
x
i
1
(1.1c)i
x
i
0
(1.1d)Where:
ai is the count on link i,
xi is the integer variable that is equal to 1 if link i is chosen as a sensor or 0 if not,
k1 is the number of desired sensors, and
rs i
are the elements that have a value equal to 1 if the OD pair is caught by a sensor placed on link i. The OD pair rs follows the shortest path between origin and destination.3.4. Network topology analysis
[11] solved the NSLP using the concept of basis links. To do this problem they create an incidence matrix (formed by all the paths in the network placed as rows and the links on the network placed as columns). This incidence matrix is filled with 1 when the link is part of a path and 0 when it is not. In this paper this matrix space is also considered as a vector space so it has a rank. To solve the problem the concept of reduced row echelon form is introduced to identify the basis links of the link-path incidence matrix. They establish that any column vector can be represented by a linear combination of a set of r unit column vectors whose linear combination coefficients α are the column elements corresponding to the nonzero rows. The information of this basis links is used to completely describe the network structure. On those basis links sensors are placed
4. Results and discussion
Network data
(GIS/GPS)
Network data
(GIS/GPS)
Network data
(GIS/GPS)
Network data
(GIS/GPS)
Add‐In using
TransCADto create the link‐
path matrix
Add‐In used in TransCADthat applies the greedy
heuristic
Add‐In developed in TransCAD
which applies Ignizio’s Heuristic
Add‐In
programmed in TransCADthat makes the link‐
path matrix Creating network,
verifying connectivity
Creating network,
verifying connectivity
Creating network,
verifying connectivity
Creating network,
verifying connectivity
Constraints are
stablished in MS Excelto solve the
problem
Matlabsolves the link‐path matrix
using Gauss‐
Jordan methos
Results are
interpreted graphically
Results are
interpreted graphically on the
map
Results are
interpreted graphically on the
map
Results are
interpreted graphically Integer Linear
programming Greedy heuristic Ignizio’s heuristic Huet al.method
Fig. 2. Process followed by each methodology used to solve the NSLP in Liu’s network.
The first methodology used was linear programming, these data were introduced in MS Excel as a link-path matrix. An Add-In was developed to process data followed by each pair through the shortest path. This link-path matrix is established placing the possible routes to travel from a origin to a destination on each row and in the columns the total of links of the network. The matrix is filled with 1 those links that are part of the shortest routes between the OD pairs, and with 0 those that are not part of the shortest route. The Add-In developed creates this matrix in a text file separated by spaces. The objective function formulated in MS Excel has 63 variables (equal to the number of links), with 1722 constraints and 63 constraints of non negativity for each variable (link). Results are shown in figure 3 which shows that the maximum number of sensors to be placed is 4.
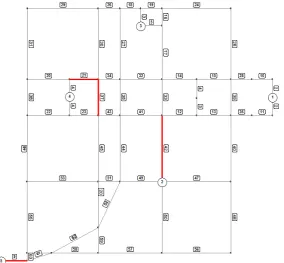
Applying the greedy heuristic, the maximum number of sensors is 4 again. This heuristic was applied using the traffic assignment technique named “All or Nothing” (AON) getting 4 sensors on the network. The AON is a technique that does not take into account congestion effect when the users follow their shortest routes. Figure 4 shows graphical location of sensors using the greedy heuristic. Time compsumption is very short. In this heuristic, that link with a high volume of vehicles is selected as a sensor, then all the OD pair that pass through that link are removed the traffic assignment technique is done to find the next link with the highest flow passing through it, and so on.
Figure 4. Location of sensors on Liu’s network using the greedy heuristic.
Ignizio’s heuristic shows the same results for sensor locations as it can be seen in figure 5. The difference between this two heuristic is time consumption, Ignizio’s takes much time tan the greedy heuristic.
Finally the methodology developed by [11] was applied, this is the unique methodology that analyses the network topology and the distribution of the OD pairs inside the network. Using this technique, there was an inconvenient because it takes into account all the possible paths between each OD pair which makes harder the application of this methodology to the Liu’s network because of the high quantity of possible routes that can be found. For example, if the Liu’s adyacency matrix, that has 42 columns an 42 rows, is raised to the second power the resultant matrix will contain the total amount of trip formed by two links, if it is raised to the third power the resultant matrix will contain the total amount of trips formed by three links, and so on [12] and the question is how many powers should be risen the adjacency matrix? So it was decided to find only the shortest path between each OD pair.
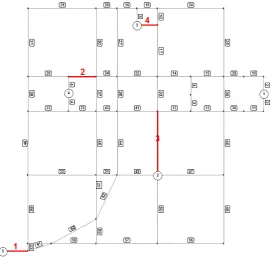
As can be seen in figure 6, in Hu’s methodology the number of basis links, which are candidates to be sensors, is bigger than the number of sensors to be found in the heuristics or integer linear programming and this methodology does not prioritize links and does not evaluate a certain number of sensors, solution does not depend on a number of desired sensors. To solve the NSLP an Add-In was developed in TransCAD which makes the adjacency matrix which is read by Matlab that solves the matrix to the reduced row echelon form using Gauss-Jordan technique [8].
Figure 6 Basis links over Liu’s network, using Hu’s methodology.
Results are summarized on table 2, 3, 4 and 5. All the runnings were made in a laptop with a Centrino Duo processor that Works at 2 GHz stepping, 2GB of RAM memory and Windows Vista of 32 bits. Table 2 shows the approximately time employed on each technique to prepare network data. Table 3 shows time consumed by each technique to solve the NSLP. Table 4 shows the time consumed in interpreting final results over the network and finally table 5 shows the total time that consumed the laptop to solve the NSLP (from the previous operations, the solution to the NSLP and post operations to locate sensors geographically) on each methodology.
Table 2. Time of the pre process employed before solving the NSLP in each methodology.
Methodology Preprocess Time (min)
Solver
Verifying the continuity of the network. Generating the OD matrices. Running the Add-In developed in TransCAD, which creates the link-path matrix (with ones and ceros)
15
Hodgson Verifying the continuity of the network. Generating the OD matrices. 10 Ignizio Verifying the continuity of the network. Generating the OD matrices. 10
Hu
Verifying the continuity of the network. Generating the OD matrices. Running the Add-In developed in TransCAD, which creates the link-path matrix (with ones and ceros)
Table 3. Time of the process that solves the NSLP in each methodology used.
Methodology Process to solve the NSLP Time (min)
Solver
Read the text file in MS Excel. Establishing non negativity constrains. Establishing the objective function. Establishing constraints. Solving the model using Solver.
25
Hodgson Running the Add-In developed in TransCAD 5 Ignizio Running the Add-In developed in TransCAD 12
Hu Introducing the link-path matrix in Matlab that solves it using
Gauss-Jordan. 2
Table 4. Time of pos processes after solving the NSLP on each applied technique.
Methodology Posprocess Time (min)
Solver Getting selected links as sensors and they are located graphically in
TransCAD 5
Hodgson Add-In in TransCAD does 0
Ignizio Add-In in TransCAD does 0
Hu Getting the basis links to locate them graphically in TransCAD 10
Table 5. Total time of each process used to solve the NSLP.
Methodology Total time (min) Final Result
Solver 45 Local optimum
Hodgson 15 Local optimum
Ignizio 22 Local optimum
Hu 19 Factible region to place sensors
It is known that using the All or nothing or the user equilibrium assignment technique, follows the shortest path for each OD pair. The difference is that the second technique takes into account link congestion but most of the flow follows the shortest path so links that have less time could be possible candidates to be sensors because its time results part of some shortest paths. If this is true and remembering that when the minimum spanning tree (MST) is formed by those links that have the smaller costs (in this case time), then sensors should be part of the MST. Figure 7 shows the MST in the Liu’s network taking those links that connect centroids.
As it can be seen from figure 7 and observing figure 3, 4, 5 and 6, sensors are placed inside the MST. This does not happened with Hu’s methodology because basis links does not are inside totally in the MST. Figure 8 shows the traffic assignment technique named “All or nothing” and it can be seen that most of the flow are placed on those links that have less time and it is appreciated to in figure 9 where an User Equilibrium technique is applied to the Liu’s network.
Figura 8. Representation of trips over Liu’s network using All or nothing assignment technique.
This analysis was tested in other networks and results were the same, sensors are placed inside the MST so the following procedure is developed to find sensors on a network:
Find the MST just between centroids.
Select links with the lower time values.
Finally there are some conclusions about this comparison
The network topology developed by Hu et al is original but it is not practice at the time of evaluate a non directed network or a big or real network.
Heuristics showed to be a very good option taking into account only the time they required to solve the NSLP.
The classical Simplex method using Solver in MS Excel does not show benefits because it consume a lot of time at the moment of preparing data and constraints.
The MST catch all sensors because of the procedure includes those links that have the smallest trip times.
These evaluated methodologies are static and they do not take into account time variation.
Taking time as a main variable should give a quick approximation to sensor location.
The evaluated methodologies are limited to input traffic assignment techniques data, they does not evaluate road characteristics such as: altitude, curvature, fuel consumption; or drive style, acceleration, aggressive style of driving, desired speed between others.
There should be necessary according to de complexity of the NSLP to be evaluated using methodology that finds a global, not local, solution as linear, integer or non linear programming does.
According to Coello, a classic technique should be used first instead of a heuristic, but in this case it is not practice to solve with Solver and both heuristics present a solution close to the optimum.
References
[1] Berman O, Krass D, Xu CW (1995): Locating discretionary service facilities based on probabilistic customer. Transportation Science. 29, pp. 276-290.
[2] Berman O, Larson RC, Fouska N (1992): Optimal location of discretionary service facilities. Transportation Science. 26, pp. 201-211. [3] Coello, Coello Carlos A. 2007. Introducción a la Computación Evolutiva (Notas de Curso). Departamento de Computación,
CINVESTAV-IPN.
[4] De la Llata R (1990): Estrategias para la realización de Estudios Origen-Destino. Instituto Mexicano del Transporte. Publicación Técnica 48.
[5] Eiben AE; Smith JE (2003). Introduction to evolutionary computing. Springer, Berlin.
[6] Eisenman SM, Fei X, Zhou X. and Mahmassani HS. (2006): Number and Location of Sensors for Real-Time Network Traffic Estimation and Prediction. Sensitivity Analysis. Transportation Research Record, 1964, pp. 253-259.
[7] Fei X, Mahmassani HS and Eisenman SM. (2007): Sensor coverage and Location for Real-Time Traffic Prediction in Large-Scale Networks. In Transportation Research Record: Journal of the Transportation Research Board, No. 2039, Transportation Research Board of the National Academies, Washingtong, D.C., pp 1-15.
[8] Friedberg, SH, Insel, AJ, Spence, LE, (2003). Linear Algebra. Pearson Education, Upper Saddle River, NJ.
[9] Han AF, Sullivan EC (1983): Trip table synthesis for CBD networks: Evaluation of the LINKOD model. Transportation Research Record 944, TRB, National Research Council, Washington, D.C. pp. 106-112.
[10] Hodgson MJ (1990): A flow-capturing location-allocation model. Geographical Analysis, Annals of Operations Research. 22, pp. 271-279.
[11] Hu SR, Peeta S, Chu CH (2009): Identification of Vehicle sensor locations for link-based network traffic applications. Transportation Research Part B. 43, pp. 873-894.
[12] Johnsonbaugh, Richard (2005): Matemáticas Discretas, 6ta Edición. De Paul University, Chicago. Prentice Hall.
[13] Kim HJ, Chung IH, and Chung SY (2003): Selection of the Optimal Traffic Counting Locations for Estimating Origin-Destination Trip Matrix. Journal of the Eastern Asia Society for Transportation Studies. 5, pp. 1353-1365.
[14] Lotz C (2002): Ermittlung von Detekotrstandorten für den Straßenverkehr innerorts. Disseration an der Technischen Universität Darmstadt. Fachbereich Bauingenieurwesen und Geodäsie, Darmstadt.
[15] Liu Y, Lai X, and Chang GL (2004) Optimal Detector Locations for OD Matrix Estimation. Applications of Advanced Technologies in Transportation Engineering (Proceedings of the Eighth International Conference), May 26-28, 2004, Beijing, China, 50-55, 2004. 51 Highways and Roads(CE).
[16] Reeves, C. B. 1993. Modern Heuristic Techniques for Combinatorial Problems, John Wiley & sons, Great Britain. [17] Spiess H (1990): Conical Volume-Delay Functions. Transportation Science. 24(2), pp. 153-158.
[18] Tomás AP (2001): Modelling Optimal Location of Traffic Counting Points at Urban Intersections in CLP (FD). Technical Report Series DCC-2001-4. Departamento de Ciência de Computadores – Faculdade de Ciências & Laboratorio de Inteligencia Artificial e Ciência de Computadores Universidade do Porto, Portugal.
[19] Yang H, Iida Y, Sasaki T (1991): An Analysis of the Reliability of Origin-Destination Trip Matrix Estimated from Traffic Counts. Transportation Research Part B. 25(5), pp. 351-363.
[20] Yang H, Zhou J (1998): Optimal traffic counting locations for origin-destination matrix estimation. Transportation Research Part B. 32, pp. 109-126.
![Fig. 1. Network used by Liu [15] to locate sensors.](https://thumb-us.123doks.com/thumbv2/123dok_us/9660502.1493913/3.595.134.469.376.691/fig-network-used-liu-locate-sensors.webp)