Comparison of Continuity in a Resident Versus Private Practice
Paul M. Darden, MD*‡; Walton Ector, MD*; Colleen Moran, MD*; and Thomas G. Quattlebaum, MD§
ABSTRACT. Background. There is widespread agree-ment among pediatric educators that continuity (follow-ing a panel of patients on a first contact basis for all their health care) is an important part of the education of pediatricians.
Objective. To measure continuity in a pediatric resi-dency practice and to compare this continuity with 2 nearby private general pediatric group practices. We also examined measures of continuity suggested in the liter-ature.
Design. Visit data were obtained from the practice billing system for a resident continuity practice and 2 nearby private practices for the 3-year period from July 1, 1992, to June 30, 1995. Visit data used were restricted to patients seen in the office of the practices during regular office hours. Continuity was measured using 5 different indices: 1) the usual provider of care index, visits by the usual clinician/total visits, 2) continuity for patient, the average proportion of visits that an individual patient was seen by his or her own physician, 3) continuity for physician (PHY), the average proportion of visits that an individual physician saw his or her own patients, 4) Continuity of Care Index (COC), and 5) the Modified, Modified Continuity Index. During the period examined, pediatric residents were present in the continuity prac-tice for 1 half-day each week. The resident continuity practice (RCP) had 57 residents and saw 3386 patients for 18 955 visits. Private practice 1 (PP1) had 4 pediatricians who saw 4968 patients for 33 537 visits. Private practice 2 (PP2) had 5 pediatricians who saw 11 953 patients for 75 778 visits.
Results. For all visit types, continuity in the RCP was not as high as in the private practices, PHY-RCP versus PP1, PP2; 53% versus 70%, 77%. However, continuity in RCP was greater than 50% for all measures except the COC index, which precipitously decreases as the number of clinicians seen increases. Examining continuity for health maintenance visits (PHY-RCP, PP2 vs PP1; 96%, 96% vs 82%) RCP was equal to the best of the private practices. The percentage of patients not seen for a health maintenance visit during the study period was lowest in the resident practice (RCP/PP1/PP2, 15/22/30).
Conclusion. Although continuity for all visits in this RCP was less than in private practice, it was surprisingly high, considering the limited time residents spend in
clinic. In a particularly important area for continuity, health maintenance visits, continuity was identical to one and superior to the other private practice.Pediatrics2001; 108:1263–1268;continuity of patient care, pediatric, intern-ship and residency, health services, evaluation studies.
ABBREVIATIONS. RRC, residency review committees; PP1, pri-vate practice 1; PP2, pripri-vate practice 2; RCP, resident continuity practice; UPC, usual provider of care; PHY, continuity for physi-cian; PAT, continuity for patient; COC, Continuity of Care Index; MMCI, Modified, Modified Continuity Index; CI, confidence in-terval.
C
ontinuity of care, a medical home for patients, and primary care are aspects of health care that are believed to be associated with en-hanced quality of care for patients. The terms “med-ical home”1,2 and “primary care”3are concepts that are understood and agreed on. However, the concept of continuity of care is associated with confusion in the medical literature.4Starfield4 has defined continuity as the orderly transfer of medical information concerning a patient from one visit to the next, regardless of who sees the patient. This is the way many specialists use the term. Dr Starfield prefers the term “longitudinality” to refer to the long-term care of one patient by one physician. She notes that many studies on the subject of continuity have been published, but most fail to distinguish between the separate concepts of longi-tudinality (the presence and use of a regular pro-vider of care over time) and continuity (the sequence of visits in which there is a mechanism of informa-tion transfer).4,5
There have been⬎750 articles published concern-ing continuity of care since 1995. There are at least 10 different indices for measuring continuity, and each index addresses continuity in a somewhat different way.6 –14It is most common for the term continuity to be used for the concept Starfield defines as longitu-dinality. For the remainder of this article, the term continuity will refer to the use of the patient’s pri-mary care provider.
Despite the inconsistencies in the definition and measurement of continuity, there is evidence that a relationship with one physician does enhance as-pects of quality of care for patients. These include patient satisfaction, physician and staff satisfaction, increased health maintenance visits, increased im-munization rates, fewer sick visits, decreased emer-gency department visits, decreased hospitalizations, increased compliance with appointments and medi-cations, increased physician recognition and
discus-From the *Division of General Pediatrics, Department of Pediatrics and ‡Department of Biometry and Epidemiology, Medical University of South Carolina, Charleston, South Carolina; and §Charleston Pediatrics, Charles-ton, South Carolina.
Portions of this research were presented at the Southern Societies Meeting; New Orleans, LA; February 18 –20, 1999; and at the Pediatric Academic Societies Meeting; San Francisco, CA; May 1–5, 1999.
Received for publication Nov 17, 2000; accepted May 29, 2001.
Address correspondence to Paul M. Darden, MD, Department of Pediatrics, Medical University of South Carolina, 326 Calhoun St, Box 250106, Charles-ton, SC 29425. E-mail: [email protected]
sion of emotional and behavioral problems, and a decrease in lab and imaging studies.8,15–24 There is also evidence that the clinician rather than the site of care is important to see the beneficial effects of con-tinuity.25
There is inconsistent evidence that long-term con-tinuity decreases visits to emergency departments or decreases hospitalizations. Also inconsistent are re-ports of effects on costs, and morbidity or mortality in association with changes in continuity.19,21
For a number of years there has been recognition of the disparity between training in all primary care residencies and the actual practice of those primary care disciplines. Nowhere has this mismatch been more glaring than in pediatrics.15,26 –28General pedi-atricians note that over 95% of their patient encoun-ters occur in outpatient settings, whereas the major-ity of their residency training occurred in hospitals. Surveys of recent graduates from pediatric residency programs document that newly trained pediatricians feel well-trained to care for the critically ill child or newborn, but feel poorly trained in areas of care where pediatricians spend most of their time. These include health maintenance, the outpatient manage-ment of moderately ill children, the managemanage-ment of children with special health care needs, the recogni-tion and management of emorecogni-tional and behavioral problems, minor orthopedic problems, adolescent problems, and others.27–29
For these and other reasons, the Accreditation Council for Graduate Medical Education, and all primary care residency review committees (RRC) have encouraged residency training programs to of-fer a continuity experience.30,31Since 1989, the Pedi-atric RRC has required that for at least 1 half-day each week, residents must be available to follow a panel of patients during the 3 years of training. The latest RRC requirements recommended increasing this to 2 half-days per week.
Recently, questions have been raised concerning how effective pediatric resident continuity practices have been in offering a meaningful continuity expe-rience.27,29,32,33Garfunkel et al34also noted that there have been no reports comparing continuity in a res-ident clinic to a private pediatric practice.
The purpose of this study was to report a compar-ison of continuity between the residents’ continuity practice at the Medical University of South Carolina and 2 highly respected private group pediatric prac-tices in Charleston. We examined measures of conti-nuity suggested in the literature and proposed mea-sures of continuity that may be more suitable for evaluating resident education.
METHODS
Data from the 3 practices came from computer billing and appointment records. At each visit, all practices recorded the name of the patient, the examining physician, visit diagnoses and procedures, and the doctor assigned as that patient’s regular phy-sician. All 3 practices assign each patient/family to a specific physician as the primary care provider for that patient/family.
All practices were located in Charleston, South Carolina. One of the private practices, PP1, has a satellite office located in a nearby town. The other private practice, PP2, and the resident continuity practice (RCP) each operated out of a single site. PP1 was a
3-pediatrician practice (over the course of the study there were 4 different pediatricians but never ⬎3 at one time); PP2 was a 5-pediatrician practice; and RCP was a pediatric residency that accepts 12 interns each year. All practices saw adolescents. Visits were examined over the 3-year period from July 1, 1992, through June 30, 1995. This period was used because comparable data for all 3 practices were available. Data were extracted from the billing and/or appointment system at each site. PP1 and RCP both used OverSite (Medical Micro Systems, Inc, Charleston, SC). PP2 used CompuSystems (Columbia, SC). Both private practices (PP1 and PP2) had evening and weekend hours during the study period. All practices handled patient advice telephone calls within the office. In the private offices, a nurse handled most calls. In the resident practice, the residents or attending in the office would handle patient advice calls. In all practices referrals during office hours to the emergency department were not measured but were reported to be rare and only for true emergencies. All practices saw acute and/or walk-in patients in the office.
In RCP, similar to the private practices, patients were seen 5 days a week, morning and afternoon. Residents were available to see their own patients whenever RCP was open. The only excep-tion was between Christmas and New Years when RCP was open but staffed only for acute care. In RCP, the residents were sched-uled to be at the practice 1 half-day per week during the period studied. During their continuity practice time, the residents saw health maintenance visits; return visits and sick visits, as well as scheduled and unscheduled visits. They were excused from atten-dance only for illness, vacation, or when on out-of-town rotations. None of the faculty-attending pediatricians at RCP had assigned patients, although they may see patients (0 –2/session) as needed. In the RCP, administrative and computer support systems were in place to maximize continuity. Practice policy was that health maintenance visits and return visits should be scheduled for the primary resident physician. Staff could easily identify, within the scheduling software, both the primary physician for each patient and the resident’s schedule.
Continuity Calculations
Five different measures of continuity are presented in this study (see details of the calculation of continuity in the Appendix): 1. Usual Provider of Care (UPC).7UPC is the proportion of visits
in which a patient is seen by their assigned clinician. The calculation of UPC is straightforward and it has a denominator of patient visits.
2. Continuity for Physician (PHY). PHY is calculated for each clinician individually. It is the proportion of visits for each clinician in which they see their own patients. For each practice, the proportions for each clinician are added together and di-vided by the number of clinicians in that practice. The calcula-tion of PHY is straightforward and it has a denominator of number of physicians. PHY relies on having an explicitly as-signed clinician for each patient.
3. Continuity for Patient (PAT). PAT is calculated for each patient individually. It is the proportion of visits for each patient in which they see their own clinician. For each practice the pro-portions for each patient are added together and divided by the number of patients in that practice. The calculation of PAT is straightforward and it has a denominator of number of pa-tients. PAT relies on having an explicitly assigned clinician for each patient.
4. Bice Index or Continuity of Care Index (COC).6 COC is a
measure of dispersion. COC is calculated for each patient indi-vidually. For each practice, the individually calculated COC for each patient are added together and divided by the number of patients in that practice. Calculation of this measure does not require an assigned clinician; rather it looks at the number of different clinicians seen. The denominator of this measure is the number of patients. COC is difficult to calculate and the mea-sure is not linearly related to, but is extremely sensitive to, the number of different clinicians seen.
5. Modified, Modified Continuity Index (MMCI).11The MMCI is
another measure of dispersion. The calculation is modified from COC to make the measure perform in a more linear fashion. The denominator of this measure is the number of patients.
continuity that are commonly used (UPC, COC, MMCI) and 2 measures of continuity (PAT, PHY) that we believed were more intuitive and easily calculated (see Appendix for details of the calculations).
Visits that can never result in continuity were excluded from analyses. Visits to each practice that did not result in seeing a physician were not used in the calculations of continuity. Exam-ples of such visits include visits to a nurse, psychologist, substance abuse counselor, visits for laboratory testing, immunizations only, visits to measure weight change, or visits for research protocols.
Visits to physicians that were recorded differently between practices and are often discontinuous were excluded from analy-ses. Visits to physicians that were excluded from continuity anal-ysis were visits of patients aged 19 years or older, visits that occurred after hours or on weekends, or visits that occurred outside the office, such as emergency department and hospital visits. In RCP, visits occurring between Christmas and New Years were excluded. Visits to PP1 and PP2 on days that had only 1 physician in the office and occurred on a holiday were excluded from analyses.
Visits of patients with inadequate identifying information, such as an invalid medical record number or missing dates of birth, were dropped from the analysis.
When calculating PHY, visits to clinicians who did not have assigned patients in that practice were excluded from those cal-culations. When calculating PAT, COC, and MMCI, visits to cli-nicians who did not have patients in the RCP were included, as these visits could potentially have been with the patient’s regular clinician. The measures of continuity described above and, more completely, in the Appendix can be characterized by the denom-inator of the measure. Most of the measures have a denomdenom-inator of the patient (COC, MMCI, PAT). PHY has a denominator of the physician and UPC has a denominator of visits.
Each of these measures was calculated for all eligible visits to the practice. The UPC index and Continuity for Physicians were also calculated for health maintenance visits (International Classi-fication of Diseases, Ninth Revisioncode V20.2). For each practice, the number of patients who were never seen for health mainte-nance over the 3-year period was calculated.
Examining the differences in proportions between the 3 prac-tices was done using the binomial proportion and 95% confidence interval (CI). Comparing differences between practices for vari-ables with dichotomous outcomes and controlling for confound-ing variables used logistic regression. The logistic parameter was converted to an odds ratio and 95% CI. Examining the differences in means between practices was done using linear regression analyses with least square means to estimate the mean and 95% CI. A 95% CI that excluded the other practices’ mean was consid-ered significant. All analyses were done using SAS version 8.1 (SAS Institute, Cary, NC).
This project was reviewed and approved by the Institutional Review Board for Human Research at the Medical University of South Carolina.
RESULTS
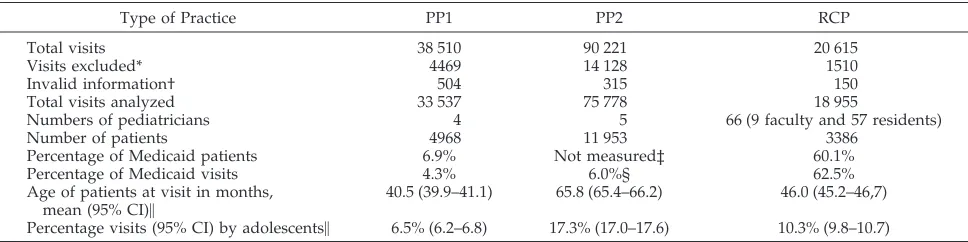
All the practices studied differed from the other practices. The private practices tended to be more similar to each other than to the resident practice. The resident practice saw a more varied group of patients, having more racial minority and Medicaid-insured patients (Table 1). The age distribution of patient visits was different for all practices with PP2 having a higher mean and median age (mean age in months PP1/PP2/RCP– 40/66/46, P ⬍ .05), and a higher proportion of adolescents (age ⱖ11 years) than the other 2 practices (Table 1). The percentage of visits in each practice for health maintenance was statistically significantly different (PP1/PP2/RCP, 39%/33%/36%, P⬍ .05). Much of the difference in percentage of visits for health maintenance was ex-plained by the difference in the age distribution of the practices.
The distribution of patients and physicians dif-fered among the practices. PP2 saw the most patients per day (visits/day, PP1/PP2/RCP, 44.4/97.9/25.7), whereas RCP had the most physicians seeing pa-tients (physicians/day, PP1/PP2/RCP, 2.5/3.9/5.7). From the data, we could not differentiate a physician seeing patients for a full day versus half a day. Each practice differed in the number of visits per patient (visits/patient, PP1/PP2/RCP– 6.8/6.3/5.6,P⬍ .05) with RCP seeing their patients significantly less of-ten. This difference in visits per patient between practices persisted after adjusting for the differing age distributions of the practices.
Measures of continuity that looked at all visits to the practices showed, as expected, both private prac-tices having greater continuity than the resident practice. The measures of continuity are presented in tabular form in Table 2. The measures of continuity within each practice differed by as much as 30.5 percentage points for PAT minus COC in RCP to as little 16.8 percentage points for MMCI minus COC in PP2. All measures of continuity with denominators of visits (UPC) or patients (PAT, COC, MMCI) dem-onstrated statistically significant differences between all practices. These statistically significant differences were related to the large number of observations
TABLE 1. Description of Practices
Type of Practice PP1 PP2 RCP
Total visits 38 510 90 221 20 615
Visits excluded* 4469 14 128 1510
Invalid information† 504 315 150
Total visits analyzed 33 537 75 778 18 955
Numbers of pediatricians 4 5 66 (9 faculty and 57 residents)
Number of patients 4968 11 953 3386
Percentage of Medicaid patients 6.9% Not measured‡ 60.1%
Percentage of Medicaid visits 4.3% 6.0%§ 62.5%
Age of patients at visit in months,
mean (95% CI)㛳 40.5 (39.9–41.1) 65.8 (65.4–66.2) 46.0 (45.2–46,7)
Percentage visits (95% CI) by adolescents㛳 6.5% (6.2–6.8) 17.3% (17.0–17.6) 10.3% (9.8–10.7)
* Excluded visits were: hospital visits including newborn nursery visits, visits after usual office hours, visits exclusively for puposes of research (RCP). Also, visits that did not include the physicians were excluded for all practices.
† Visits for which there was incomplete or invalid data were excluded.
‡ In the archival data available from PP2, insurance status for individual visits was not available. § Percentage of Medicaid visits for PP2 estimated from percentage of Medicaid charges.
(visits, patients) and may not represent clinical sig-nificance.
UPC, with a denominator of visits, was statistically different between all practices with PP2 at 77.4%, PP1 at 70.4%, and RPC at 52.8% (Table 2). PAT, COC, and MMCI, measures with denominators of patients, were statistically different between all practices. Continuity was highest when measured by MMCI in both private practices (MMCI, PP1/PP2/RCP, 84.9/ 83.6/52.5). Continuity measured by COC was lowest in all practices and substantially lower in RCP (COC, PP1/PP2/RCP, 63.5/66.8/24.0; Table 2).
PHY, with a denominator of physicians, was sta-tistically different between the private practices and RCP, but no statistical difference was found between PP1 and PP2 (PHY, PP1/PP2/RCP, 68.4/76.4/53.1). Within each practice, different measures of conti-nuity varied by 21.4 percentage points for PP1, 16.8 percentage points for PP2, and 30.5 percentage points for RCP. The relative rank of the practices by these measures of continuity was not as variable; the private practices had higher continuity than the res-ident practice on every measure. However, between the 2 private practices, PP2 was generally higher than PP1, although this relationship was reversed for MMCI. With exception of COC, the RCP was very stable across measures of continuity. The maximum difference between measures was only 2.6 percent-age points.
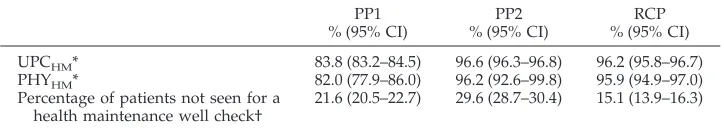
Clinicians and patients, depending on the type of visit, may value continuity differently. We examined health maintenance visits (International Classification of Diseases, Ninth Revisioncode V20.2), a type of visit valued by both patients and educators. The 3 prac-tices were different from each other in the percentage of patients never seen for health maintenance. RCP had a significantly lower percentage of their patients who were not seen for health maintenance over the period studied (PP1/PP2/RCP, 21.6/29.6/15.1,P ⬍
.5). On 2 measures (UPCHMand PHYHM) of continu-ity for health maintenance visits, the resident prac-tice performed extraordinarily well. Residents saw
their assigned patients for health maintenance 96% of the time. This was indistinguishable from the best performing private practice (PHYHM, PP1/PP2/ RCP, 82.0/96.2/95.9; Table 3).
DISCUSSION
Continuity, as the term is commonly used, is mea-sured in many ways. When to use the various indices is an open question. The 5 measures examined tend to vary in the same direction, but they are not iden-tical.
Most measures examine continuity from the per-spective of the patient and have the number of pa-tients as the denominator (COC, MMCI, PAT). Con-ceptually, for the attainment of patient goals related to continuity this seems appropriate. It is not clear that one measure is superior to the other in its asso-ciation with patient outcome. The Bice Index or COC has 2 disadvantages. It is extremely sensitive to the number of clinicians a patient has seen and it is not a linear measure.6,9 The MMCI is more linear but is also relatively difficult to calculate. Continuity for patient or PAT is an intuitive measure and easy to understand and to calculate. Its disadvantage is that it requires each patient to have an identified primary care clinician within the data.
The UPC measure, with a denominator of visits, is conceptually related to an episode of care. If the data contains an identified primary care clinician, this measure is the easiest to calculate. The disadvantage of UPC is that the measure is not conceptually di-rectly related to either patient or physician outcomes. We have proposed a measure of continuity from the perspective of the physician (PHY). This measure is easy to calculate, however, it does require that the assigned physician for each patient visit be identified in the data. This measure would be appropriate when outcomes related to physicians are relevant. This measure should be considered when examining the educational experience of trainees such as pedi-atric residents.
Each of the measures of continuity examined var-ies significantly both between and within practices. Continuity is clearly better in these private practices when compared with the resident practices. How-ever, the continuity in the resident’s practice com-pares favorably when examined from the perspective that residents are only present for 1 half-day per week, whereas in the private practices the pediatri-cians were in the office 8 or 9 half-days per week. It is interesting to note the high proportion of health maintenance visits where patients saw their own resident physician in RCP. Also, the percentage of
TABLE 2. Measures of Continuity for Each Practice PP1
% (95% CI)
PP2 % (95% CI)
RCP % (95% CI)
UPC 70.4 (69.9–70.9) 77.4 (77.1–77.7) 52.8 (52.0–53.5) PHY 68.4 (59.8–77.0)† 76.4 (68.7–84.1)† 53.1 (50.8–55.4) PAT* 75.0 (74.2–75.8) 78.1 (77.6–78.6) 54.5 (53.6–55.5) COC* 63.5 (62.5–64.4) 66.8 (66.2–67.4) 24.0 (22.8–25.2) MMCI* 84.9 (84.2–85.6) 83.6 (83.1–84.0) 52.2 (51.3–53.1)
* All practices statistically different from each other;P⬍.05. † PPI and PP2 statistically different from RCP;P⬍.05.
TABLE 3. Continuity Calculations Utilizing Only Visits for Health Maintenance PP1
% (95% CI)
PP2 % (95% CI)
RCP % (95% CI)
UPCHM* 83.8 (83.2–84.5) 96.6 (96.3–96.8) 96.2 (95.8–96.7)
PHYHM* 82.0 (77.9–86.0) 96.2 (92.6–99.8) 95.9 (94.9–97.0)
Percentage of patients not seen for a health maintenance well check†
21.6 (20.5–22.7) 29.6 (28.7–30.4) 15.1 (13.9–16.3)
* PP1 different from PP2 and RCP;P⬍.05.
patients never seen for a health maintenance visit was higher in the private practices.
There are studies that show that patients value immediate access to health care more highly than they value continuity.22,35–38 Most of these studies indicate that it is for acute illnesses that patients are most anxious to have immediate access to any com-petent clinician. There are also studies that suggest that for certain types of visits, parents prefer to wait to see their child’s regular physician.8,12,23,39 In ex-amining the available evidence, our interpretation is that parents value their child being seen by their own clinician for: health maintenance visits, visits for be-havior/emotional problems, school performance problems, long-term management of chronic health problems, and follow-up for recurring acute ill-nesses.
The types of visits where parents value long-term continuity with the same physician are the types of visits where continuity can be accommodated in a RCP or in a private group practice. Both types of practices can also provide a type of continuity for acute illnesses, by a physician who has easy access to the patient’s record, thus providing the orderly transfer of information between clinicians.5
The results of this project should be interpreted with some caution. It involves a relatively small number of practices in one area of the country and may not be generalizable to practices or residencies in different areas or with different organizational structures. We relied on billing data in all practices rather than data specifically gathered to measure continuity. Another issue with this study is the sub-stantial differences in the types of patients and vol-ume of patients. Some differences between the pri-vate practices and resident practices may be attributable to practice characteristics other than res-idency training.
The types of visits where parents highly value continuity are the types of visits for which many practicing generalist pediatricians find they were poorly prepared by their residency programs.27–29 The preparation for these patients and types of visits should be and are best taught in a continuity expe-rience. It is also worth noting that it is in the conti-nuity practice where residents provide a valuable service to underserved children, and learn to enjoy being an advocate for this segment of our popula-tion. In most programs, these opportunities are only offered in the resident’s continuity practice, whether in a hospital outpatient setting, or in a private prac-tice.
It seems reasonable that there are types of visits for which continuity is associated with a better outcome and other types for which this is not true. Perhaps those visits for which continuity is valued by parents are the types of visits that are associated with better outcomes and so indicate quality care. To be most informative, studies of continuity need to differenti-ate between types of visits and their outcomes.
CONCLUSION
A comparison of continuity in 1 pediatric resi-dency practice to 2 private group pediatric practices
shows continuity for patients and physicians to be higher in the private groups. However, the level of continuity in the resident’s continuity practice com-pares favorably, particularly in health maintenance visits and in the percentage of patients seen for health maintenance.
Continuity in resident practices is espoused as a desirable educational goal. Residency programs should be monitoring the continuity of their resi-dents as an outcome of the residency training and correlating continuity with patient outcomes. This monitoring can be problematic within systems that do not routinely collect resident information. These problems are magnified when residents are in mul-tiple sites, especially when those sites include both hospital-based and office-based practices.
APPENDIX: MEASURES OF CONTINUITY
1. Usual Provider of Care (UPC):7
Calculation of the UPC determines the overall proportion of visits during which a patient was seen by his or her assigned physician.
Cupc⫽
nc
nt
Cupc ⫽ Continuity, usual provider of care
nc ⫽ Number of visits in which a patient saw the assigned
provider
nt ⫽ Total number of visits to the office
2. Continuity for Physicians (PHY):
PHY is the average proportion of patients seen by each pro-vider who were his or her assigned patients.
Cphy⫽
冘
npi
npt
Pt
Cphy is Continuity for Physicians
npi is the number of patients that physicianphas seen who
are his own
npt is the total number of patients that physicianphas seen
Pt is the total number of physicians
3. Continuity for Patients (PAT):
PAT is the average proportion of visits for each patient in which they were seen by their assigned physician.
Cpat⫽
冘
nsi
nst
St
Cpat is Continuity for patients
nsi is the number of visits for patient s that they are seen by
their own physician
nst is the total number of visits that patient s makes
St is the total number of patients
4. Bice Index or Continuity of Care Index (COC):6
The Bice Index is a measure of dispersion. It does not take into account the assigned clinician, rather it looks at the number of clinicians seen.
Ccoc⫽
冘 冘
nj2⫺n
n共n⫺1兲/pn
Ccoc is the Bice Index, or Continuity of Care Index
nj is the total visits by the patient to provider j
n is the total number of visits to the practice by the patient
pn is the total number of patients in the practice
5. Modified, Modified Continuity Index (MMCI):11
MMCI is a measure of dispersion. It is modified from the Bice Index to make the measure perform in a more linear fashion. This measure does not take into account the assigned physician but only the number of physicians seen.
Cmmci⫽
冘
冉
1⫺共np/关nv⫹0.1兴兲
1⫺共1/nv⫹0.1兲
冊
冒
pn
Cmmci is Modified, Modified Continuity Index
np is the number of physicians the patient saw
nv is the total number of visits to the practice
pn is the total number of patients in the practice
The MMCI is calculated for each patient individually, summed over all patients in the practice, and then divided by the total number of patients in the practice.
ACKNOWLEDGMENTS
This study was supported, in part, by the Healthy South Caro-lina Initiative, Medical University of South CaroCaro-lina, Charleston, South Carolina.
We thank the physicians and staff of Parkwood Pediatrics and Charleston Pediatrics, Charleston, South Carolina, for help in ob-taining and understanding data on their practices the authors.
REFERENCES
1. American Academy of Pediatrics, Ad Hoc Task Force on Definition of the Medical Home. The medical home.Pediatrics. 1992;90:774 2. American Academy of Pediatrics. The medical home statement
addendum: Pediatric Primary Health Care (RE9262).Pediatric News. 1993
3. Starfield B.What is Primary Care? Primary Care: Concepts, Evaluation, and Policy. New York: Oxford University Press, Inc; 1992:3–9
4. Starfield B. Continuous confusion?Am J Public Health. 1980;70:117–119 5. Starfield B.Longitudinality and Managed Care. Primary Care: Concepts, Evaluation, and Policy. New York: Oxford University Press, Inc; 1992: 41–55
6. Bice TW, Boxerman SB. A quantitative measure of continuity of care.
Med Care. 1977;15:347–349
7. Breslau N, Reeb KG. Continuity of care in a university-based practice.
J Med Educ. 1975;50:965–969
8. Dietrich AJ, Marton KI. Does continuous care from a physician make a difference?J Fam Pract. 1982;15:929 –937
9. Eriksson EA, Mattsson LG. Quantitative measurement of continuity of care. Measures in use and an alternative approach.Med Care. 1983;21: 858 – 875
10. Hansen MF. Continuity of care in family practice. Part 3: measurement and evaluation of continuity of care.J Fam Pract. 1975;2:439 – 444 11. Magill MK, Senf J. A new method for measuring continuity of care in
family practice residencies.J Fam Pract. 1987;24:165–168
12. Rogers J, Curtis P. The concept and measurement of continuity in primary care.Am J Public Health. 1980;70:122–127
13. Ejlertsson G, Berg S. Continuity-of-care measures. An analytic and empirical comparison.Med Care. 1984;22:231–239
14. Smedby O, Eklund G, Eriksson EA, Smedby B. Measures of continuity of care. A register-based correlation study.Med Care. 1986;24:511–518 15. Alpert JJ, Robertson LS, Kosa J, Heagarty MC, Haggerty RJ. Delivery of
health care for children: report of an experiment.Pediatrics. 1976;57: 917–930
16. Christakis DA, Wright JA, Koepsell TD, Emerson S, Connell FA. Is greater continuity of care associated with less emergency department utilization?Pediatrics. 1999;103:738 –742
17. Christakis DA, Mell L, Koepsell TD, Zimmerman FJ, Connell FA. As-sociation of lower continuity of care with greater risk of emergency department use and hospitalization in children.Pediatrics. 2001;107: 524 –529
18. Garrison WT, Bailey EN, Garb J, Ecker B, Spencer P, Sigelman D. Interactions between parents and pediatric primary care physicians about children’s mental health.Hosp Community Psychiatry. 1992;43: 489 – 493
19. Gill JM, Mainous AG III. The role of provider continuity in preventing hospitalizations.Arch Fam Med. 1998;7:352–357
20. Gill JM, Mainous AG III, Nsereko M. The effect of continuity of care on emergency department use.Arch Fam Med. 2000;9:333–338
21. Lewis C. What is the evidence?Am J Dis Child. 1971;122:469 – 474 22. Lochman JE. Factors related to patients’ satisfaction with their medical
care.J Community Health. 1983;9:91–109
23. McCune YD, Richardson MM, Powell JA. Psychosocial health issues in pediatric practices: parents’ knowledge and concerns.Pediatrics. 1984; 74:183–190
24. Weiss GL, Ramsey CA. Regular source of primary medical care and patient satisfaction.QRB Qual Rev Bull. 1989;15:180 –184
25. Mainous AG III, Gill JM. The importance of continuity of care in the likelihood of future hospitalization: is site of care equivalent to a pri-mary clinician?Am J Public Health. 1998;88:1539 –1541
26. Charney E. The education of pediatricians for primary care: the score after two score years.Pediatrics. 1995;95:270 –272
27. Roberts KB, Starr S, DeWitt TG. The University of Massachusetts Med-ical Center office-based continuity experience: are we preparing pedi-atrics residents for primary care practice?Pediatrics. 1997;100(4). Avail-able at: http://www.pediatrics.org/cgi/content/full/100/4/e2 28. Schatz IJ, Realini JP, Charney E. Family practice, internal medicine, and
pediatrics as partners in the education of generalists.Acad Med. 1996; 71:35–39
29. Liebelt EL, Daniels SR, Farrell MK, Myers MG. Evaluation of pediatric training by the alumni of a residency program. Pediatrics. 1993;91: 360 –364
30. Accreditation Council for Graduate Medical Education (US).Manual of Policies and Procedures For Graduate Medical Education Review Committees. Chicago, IL: Accreditation Council for Graduate Medical Education; 1999
31. American Medical Association, Accreditation Council for Graduate Medical Education (US). Graduate Medical Education Directory. 1999 –2000 Chicago, IL: American Medical Association; 1999 32. Drutz JE, Serwint JR, Feigelman S, Dumont-Driscoll M. The pediatric
continuity experience: do academic sites still have a role?Arch Pediatr Adolesc Med. 1999;153:561–564
33. Dumont-Driscoll MC, Barbian LT, Pollock BH. Pediatric residents’ con-tinuity clinics: how are we really doing?Pediatrics. 1995;96:616 – 621 34. Garfunkel LC, Byrd RS, McConnochie KM, Auinger P. Resident and
family continuity in pediatric continuity clinic: nine years of observa-tion.Pediatrics. 1998;101:37– 42
35. Chesteen SA, Warren SE, Woolley FR. A comparison of family practice clinics and free-standing emergency centers: organizational character-istics, process of care, and patient satisfaction.J Fam Pract. 1986;23: 377–382
36. Dixon RA, Williams BT. Patient satisfaction with general practitioner deputising services.BMJ. 1998;297:1519
37. Forrest CB, Starfield B. Entry into primary care and continuity: the effects of access.Am J Public Health. 1998;88:1330 –1336
38. Rizos J, Anglin P, Grava-Gubins I, Lazar C. Walk-in clinics: impli-cations for family practice [see comments].Can Med Assoc J. 1990; 143:740 –745
DOI: 10.1542/peds.108.6.1263
2001;108;1263
Pediatrics
Paul M. Darden, Walton Ector, Colleen Moran and Thomas G. Quattlebaum
Comparison of Continuity in a Resident Versus Private Practice
Services
Updated Information &
http://pediatrics.aappublications.org/content/108/6/1263
including high resolution figures, can be found at:
References
http://pediatrics.aappublications.org/content/108/6/1263#BIBL
This article cites 33 articles, 9 of which you can access for free at:
Subspecialty Collections
_management_sub
http://www.aappublications.org/cgi/collection/administration:practice
Administration/Practice Management
following collection(s):
This article, along with others on similar topics, appears in the
Permissions & Licensing
http://www.aappublications.org/site/misc/Permissions.xhtml
in its entirety can be found online at:
Information about reproducing this article in parts (figures, tables) or
Reprints
http://www.aappublications.org/site/misc/reprints.xhtml
DOI: 10.1542/peds.108.6.1263
2001;108;1263
Pediatrics
Paul M. Darden, Walton Ector, Colleen Moran and Thomas G. Quattlebaum
Comparison of Continuity in a Resident Versus Private Practice
http://pediatrics.aappublications.org/content/108/6/1263
located on the World Wide Web at:
The online version of this article, along with updated information and services, is
by the American Academy of Pediatrics. All rights reserved. Print ISSN: 1073-0397.